Search Knowledge Base by Keyword
Which Trading Strategy Works for Crypto, Stocks and Forex? 5-Year Backtest
Most traders use one strategy in every market. Our data shows that this is a mistake. We tested 4 trading strategies on 40 instruments for 5 years. This article shows which strategy worked in crypto, in stocks and in forex.
Last updated: November 17, 2026 | By: altFINS Research Team | Reading time: 7 minutes | Level: Intermediate
Quick answer: which trading strategy works best?
It depends on the market. In a 5-year backtest of 4,791 trades, trend following gave the best result in crypto (profit factor 1.77) and in stocks (1.78). In forex, trend following lost money (0.72) and buying oversold pairs made money (1.44). In stocks, all 4 long strategies made money and all 4 short strategies lost money.
Open Crypto ScreenerOpen Stock ScreenerOpen Forex Screener
Key Findings From the Backtest
- Crypto: trend following won only 28% of trades, but the average winner was +44.7% and the average loser was -9.7%.
- Crypto, last 12 months: buying oversold coins lost money on all 10 assets. Short trend trades had a profit factor of 7.46.
- Stocks: buying oversold stocks had the highest win rate (64%). Short strategies had profit factors from 0.48 to 0.68.
- Forex: trend and breakout strategies lost money in the full 5 years and in the last 12 months. RSI extremes won 61% of trades.
- All markets: a high win rate did not mean a profit. The strategy with the lowest win rate made the most money in crypto.
How We Tested the Trading Strategies
We used simple rules that you can find on any chart. We did not optimise the parameters.
- Markets: 10 large crypto assets, 20 large US stocks, 10 major forex pairs.
- Period: November 2021 to November 2026, daily candles.
- Execution: signal on the daily close, entry on the next open.
- Holding period: not fixed. The exit rule closes the trade. The average trade was open 14 to 44 days.
- Risk rules: no stop loss, no take profit and no leverage.
- Fees per side: 0.10% for crypto, 0.05% for stocks, 0.02% for forex.
- Trades: 1,576 in crypto, 2,234 in stocks, 981 in forex.
| Strategy | Entry rule | Exit rule | altFINS strategy |
|---|---|---|---|
| Trend | EMA 12 crosses above EMA 50 | EMA 12 crosses below EMA 50 | Trading Moving Average Crossovers EMA 12/50 Crossovers signal |
| Breakout | Close above the 20-day high | Close below the 10-day low | Trading Key Levels New Local High signal |
| Oversold bounce | RSI 14 falls below 30 | RSI 14 above 50, or 20 days | Oversold / Overbought RSI 14 signal |
| Pullback in trend | Price above SMA 200 and RSI 14 falls below 40 | RSI 14 above 60, or 20 days | Pullback in Uptrend Pullback in Uptrend signal |
Short trades use the opposite rules. For forex we show long and short trades together, because each pair has two currencies.
Each strategy in the test is a simple version of a strategy from the free altFINS Trading Course. The altFINS signals can use more conditions than our test rules. For example, the altFINS Pullback in Uptrend signal uses the altFINS trend score, and our test uses the SMA 200. For the full list of strategies, read Crypto Trading Strategies.
What is profit factor?
Profit factor is the total profit of the winning trades divided by the total loss of the losing trades. A value above 1.0 means the strategy made money. A value of 1.77 means $1.77 of profit for each $1.00 of loss.
Results: Which Strategy Works in Which Market
The table shows the profit factor, the win rate and the average result per trade after fees, for the full 5 years.
| Strategy | Crypto (long) | Stocks (long) | Forex (long + short) |
|---|---|---|---|
| Trend (EMA 12/50) | 1.77 | 28% wins | +5.4% | 1.78 | 37% wins | +2.8% | 0.72 | 28% wins | -0.3% |
| Breakout (20-day high) | 1.44 | 33% wins | +3.2% | 1.59 | 42% wins | +1.8% | 0.74 | 37% wins | -0.3% |
| Oversold bounce (RSI 30) | 0.98 | 55% wins | -0.1% | 1.69 | 64% wins | +1.7% | 1.44 | 61% wins | +0.3% |
| Pullback in trend | 0.86 | 42% wins | -0.9% | 1.43 | 55% wins | +1.1% | 1.15 | 55% wins | +0.1% |
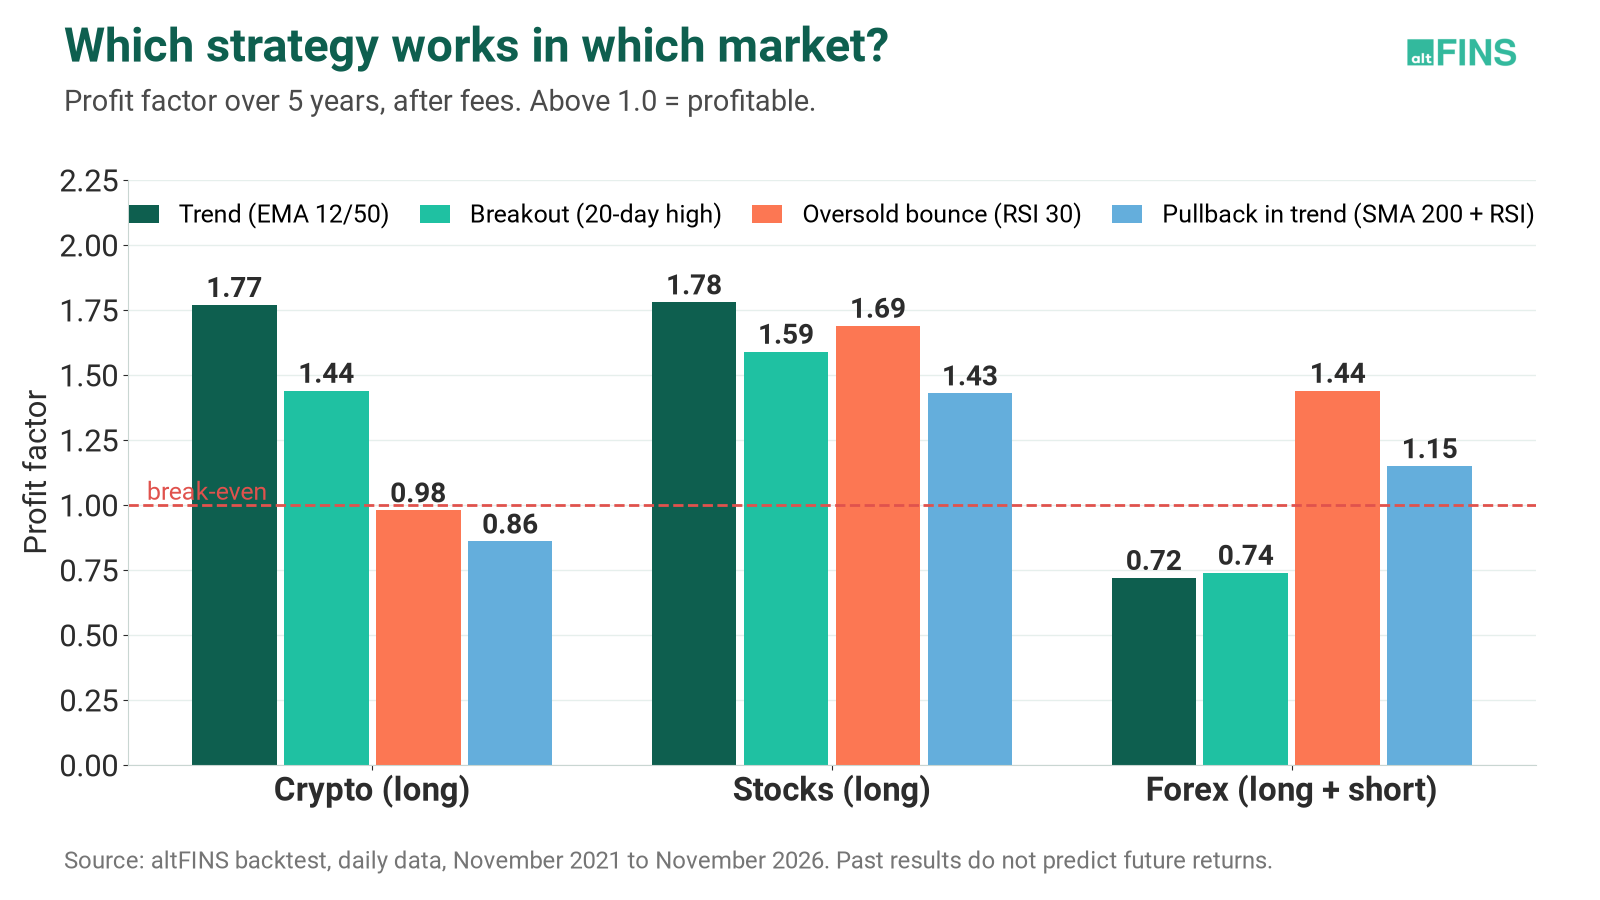
Profit factor by strategy and market, November 2021 to November 2026. Source: altFINS.
Crypto: Trend Following Works, Dip Buying Does Not
In crypto, the two strategies that follow price made money. The two strategies that buy weakness did not. Trend following lost 72% of its trades. A small number of large trends paid for all the small losses. The best trade gained 471%.
The oversold bounce won 55% of trades and made nothing. The losses were larger than the wins (-14.6% against +11.6%).
The last 12 months: same logic, opposite direction
The average crypto asset in the test fell 47% in the last 12 months. Long trades stopped working. Short trades with the same rules worked.
| Strategy, last 12 months | Long | Short |
|---|---|---|
| Trend (EMA 12/50) | 1.01 | 7.46 | 70% wins |
| Breakout / breakdown | 0.62 | 2.34 | 59% wins |
| RSI 30 long / RSI 70 short | 0.33 | 0 of 10 assets profitable | 1.43 | 63% wins |
| Pullback in trend | 0.00 | 0 wins in 13 trades | 1.59 | 73% wins |
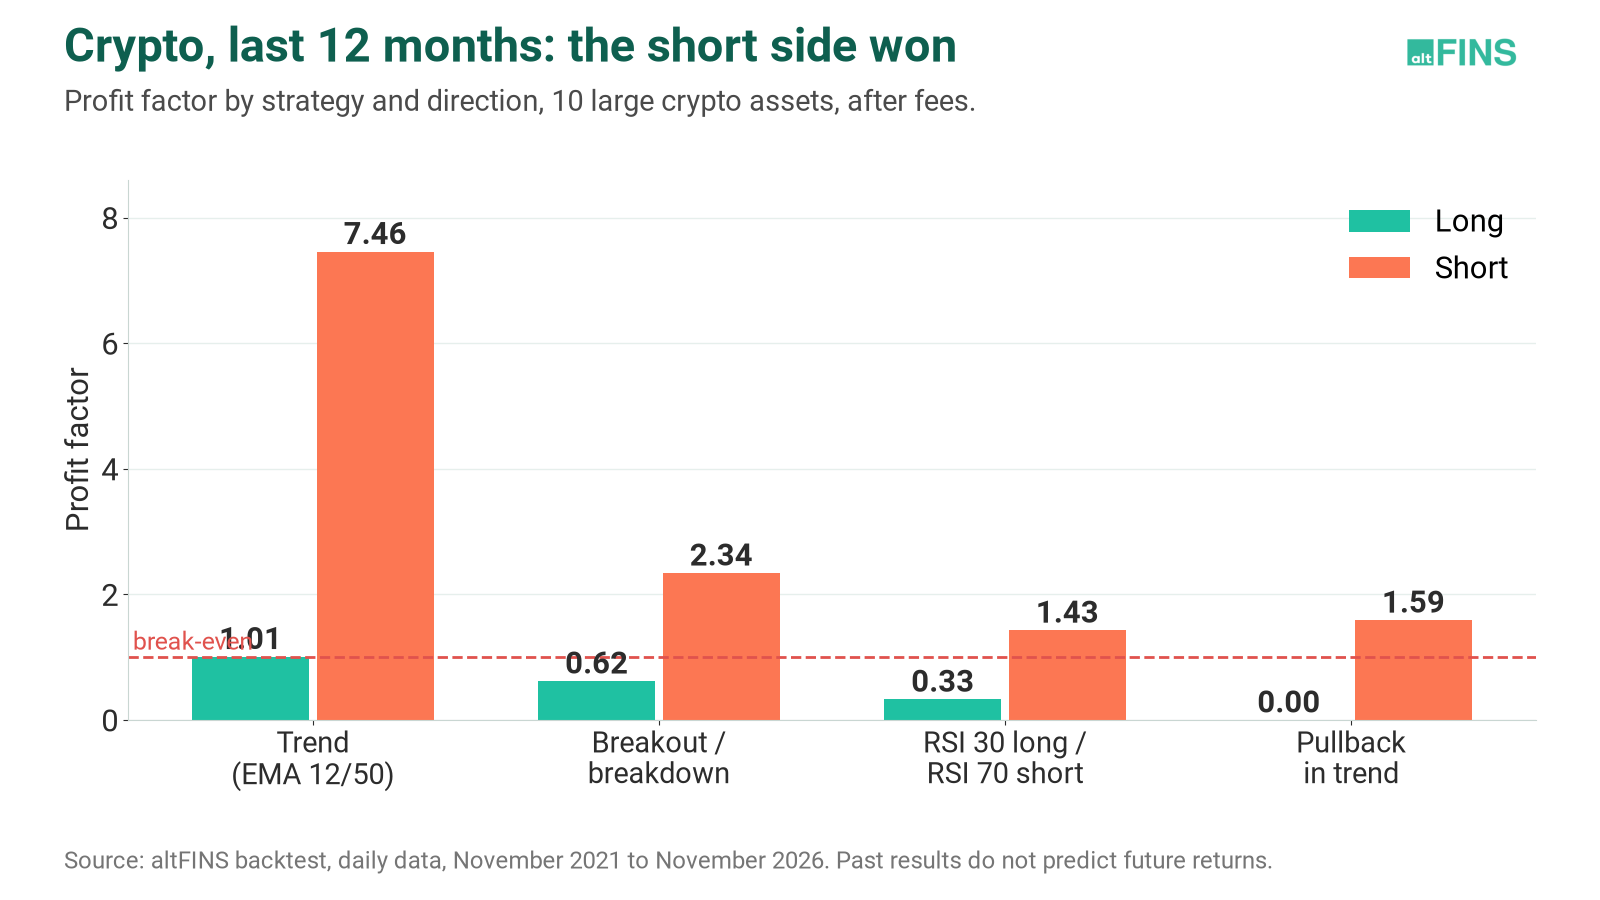
Crypto strategies by direction, November 2025 to November 2026. Source: altFINS.
Trend following depends on the year
| Average result per trend trade (long) | 2022 | 2023 | 2024 | 2025 | 2026 |
|---|---|---|---|---|---|
| Crypto | -11.0% | +19.7% | +16.9% | -2.9% | +0.1% |
| Stocks | -3.1% | +10.5% | +2.3% | +2.6% | +2.3% |
Live example: Bitcoin, November 2026
The EMA 12 crossed below the EMA 50 on Bitcoin on October 30, 2026. Bitcoin is down 17% from that day. On November 12, the RSI fell below 30. A trader who bought that oversold signal is down 10%. The crypto Fear and Greed Index is at 12 (extreme fear). Extreme fear alone is not a buy signal.
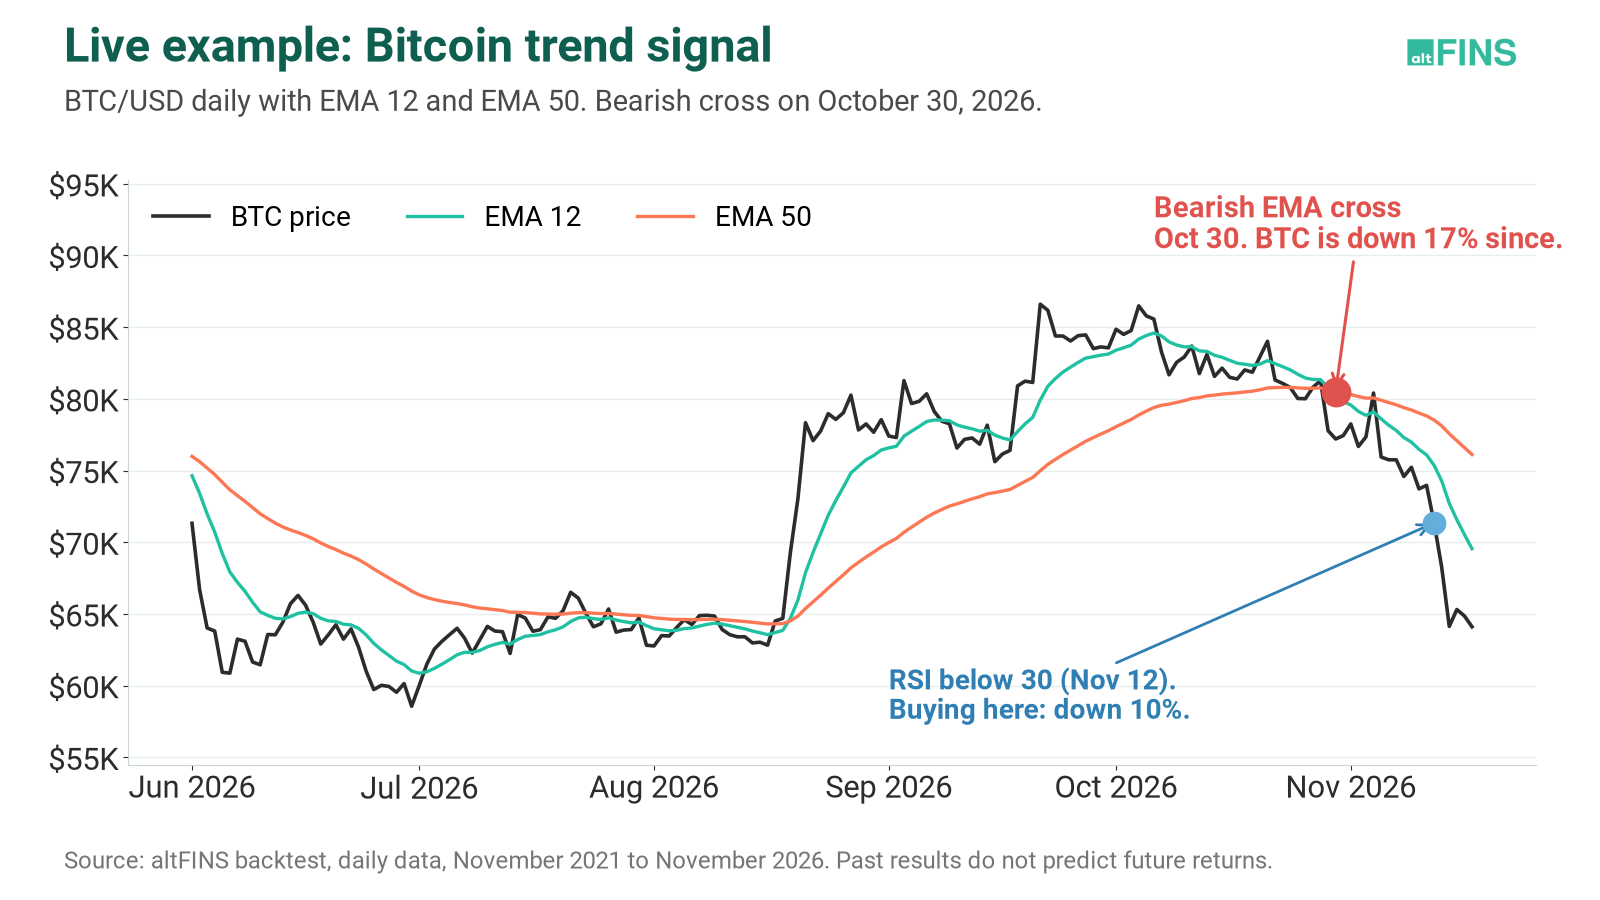
Bitcoin with the bearish EMA 12/50 cross and the RSI oversold signal. Source: altFINS.
What to do in crypto
Trade with the trend, in the two directions. Accept a low win rate. Do not buy an oversold coin in a downtrend without a confirmation, for example an RSI divergence. Learn the altFINS strategies: Momentum and Uptrend, Short Selling and How to trend trade crypto.
See Crypto Trend SignalsOpen Crypto Screener
Stocks: Stay Long, Do Not Short
Stocks gave the clearest result. All 4 long strategies made money. All 4 short strategies lost money. The average stock in the test gained 78% in 5 years, and this upward drift helps each long trade.
| Strategy | Long | Short |
|---|---|---|
| Trend (EMA 12/50) | 1.78 | 37% wins | 0.48 | 24% wins |
| Breakout / breakdown | 1.59 | 42% wins | 0.52 | 28% wins |
| RSI 30 long / RSI 70 short | 1.69 | 64% wins | 0.61 | 52% wins |
| Pullback in trend | 1.43 | 55% wins | 0.68 | 45% wins |
If you want a high win rate, buy oversold stocks. If you want large winners, buy breakout stocks and hold the trend.
The altFINS strategies for these setups are Pullback in Uptrend, Oversold in Uptrend and Momentum Stocks.
Live example: stock rotation, November 2026
The S&P 500 is only 3% lower than one month ago. The stocks inside the index moved much more. Breakouts in Coca-Cola, Walmart and Procter & Gamble from the middle of October are up 9% to 15%. Nvidia is down 27% in one month and Intel is down 38%. Oversold buy signals in these two stocks are down 15% to 18%.
The lesson: the oversold bounce works in stocks over 5 years, but it does not protect you when a market leader breaks down. Use a stop loss.
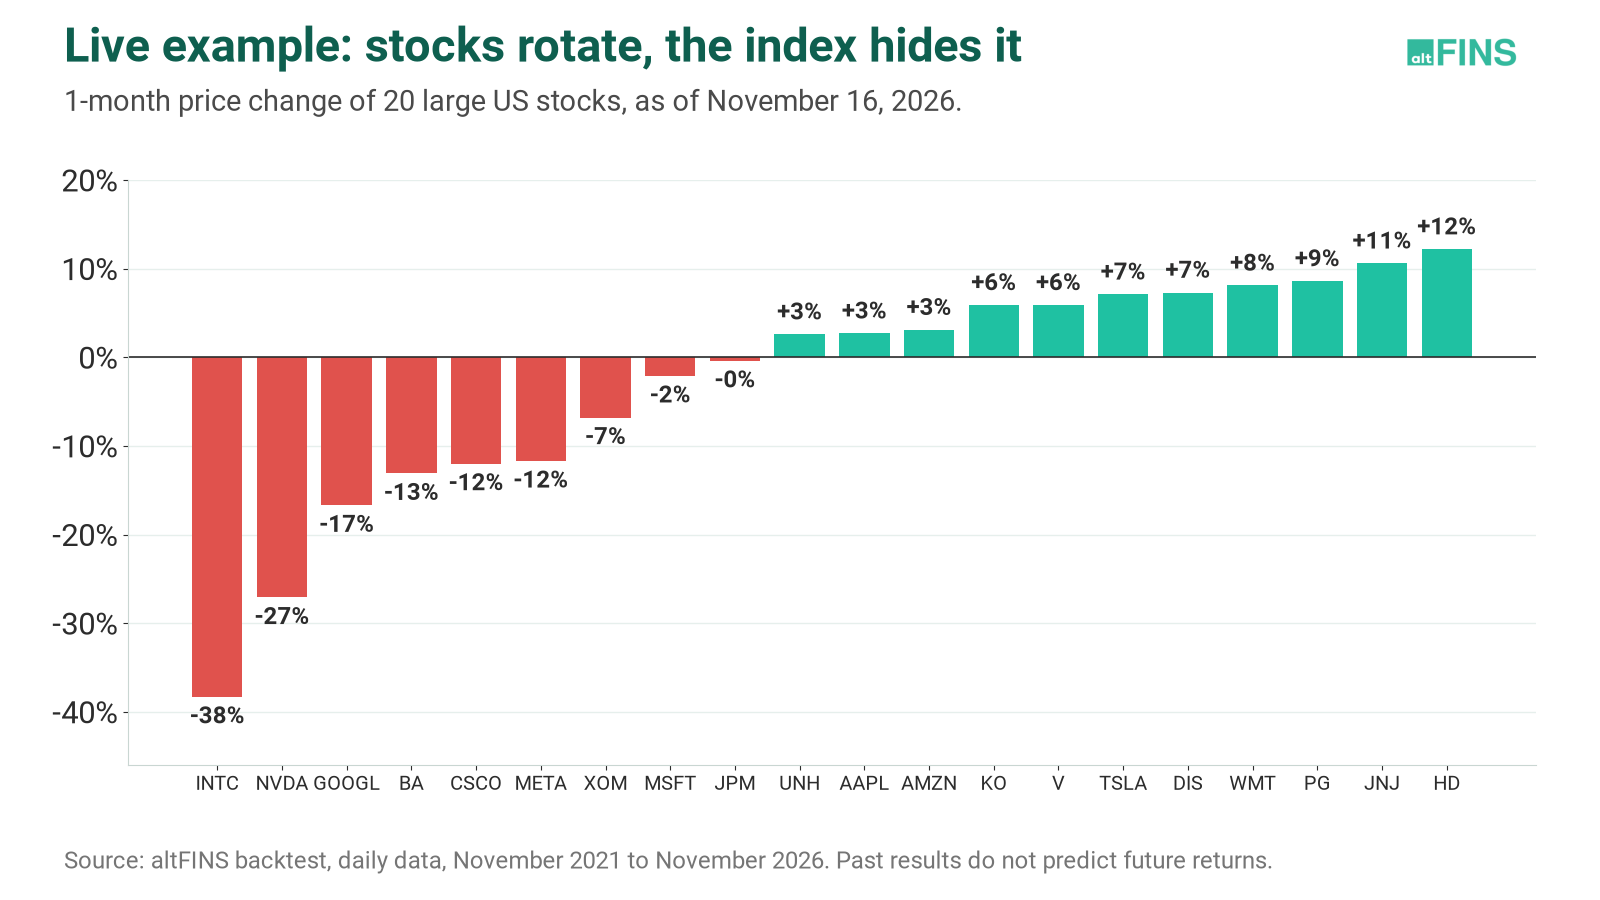
1-month price change of 20 large US stocks, as of November 16, 2026. Source: altFINS.
Scan 500 Stocks for BreakoutsRead the Stock Screener Guide
Forex: Trade Extremes, Not Trends
Forex gave the opposite result to crypto. Trend and breakout strategies lost money on major pairs. Strategies that buy oversold pairs and sell overbought pairs made money. The result was the same in the full 5 years and in the last 12 months.
| Strategy (long + short) | 5 years | Last 12 months |
|---|---|---|
| Trend (EMA 12/50) | 0.72 | 28% wins | 0.38 | 18% wins |
| Breakout (20-day high / low) | 0.74 | 37% wins | 0.43 | 35% wins |
| RSI 30 long / RSI 70 short | 1.44 | 61% wins | 1.69 | 64% wins |
| Pullback in trend | 1.15 | 55% wins | 2.24 | 67% wins |
Forex moves are small. The average winning RSI trade gained 1.4% without leverage. Leverage makes the profit and the loss larger.
The altFINS strategies for these setups are Oversold / Overbought and Trading Ranges.
Live example: EUR/USD, November 2026
EUR/USD is at a 52-week low of 1.099 and the RSI is at 29. The trend short from September is up 4.2%. It is one of the few trend trades that made money this year. The oversold long from October 29 is down 1.5%. AUD/USD gave a new oversold signal this week.
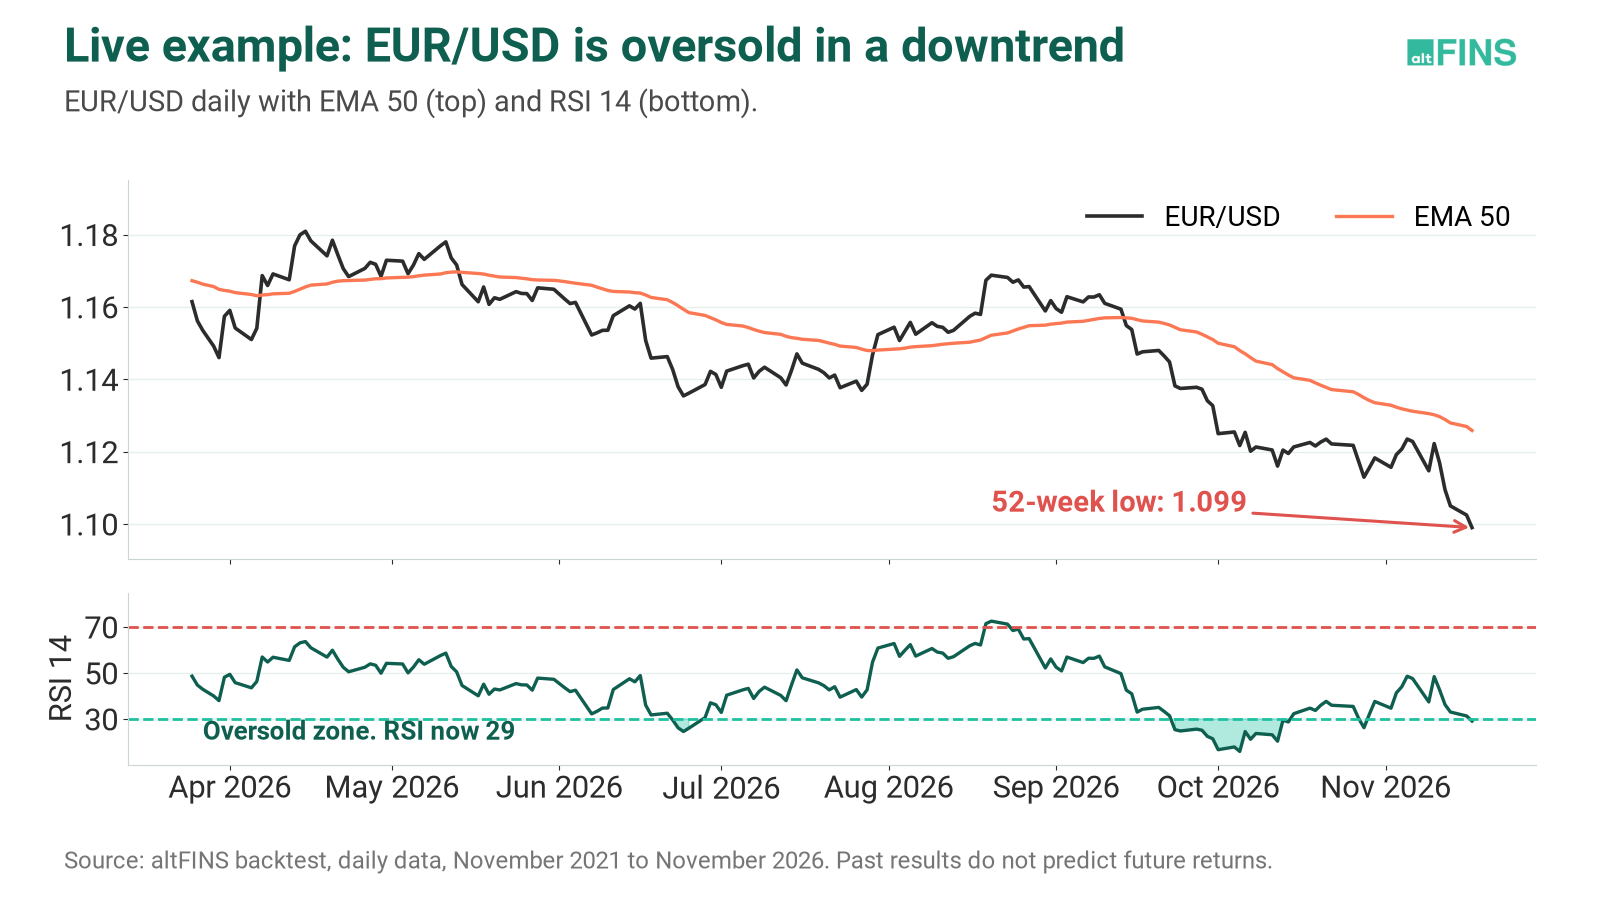
EUR/USD with the EMA 50 and the RSI 14. Source: altFINS.
Open Forex Signals FeedScan 25 Forex Pairs
altFINS Strategies for Each Setup
altFINS scans crypto, stocks and forex each day. The table shows the altFINS strategy, the signal and the custom screener filter for each setup in this test. You can also start from the altFINS preset screener filters.
| Setup in this test | altFINS strategy | altFINS signal | Custom screener filter | Markets |
|---|---|---|---|---|
| Trend | Trading Moving Average Crossovers | Bullish / Bearish Cross EMA 12 and EMA 50 | EMA 12 cross EMA 50, Above or Below | Crypto, Stocks, Forex |
| Breakout | Trading Key Levels | New Local High (20 period), Resistance Breakout | New High in the last 20 periods | Crypto, Stocks, Forex |
| Oversold bounce | Oversold / Overbought | Oversold RSI below 30 | RSI 14 at 30 or lower | Crypto, Stocks, Forex |
| Pullback in trend | Pullback in Uptrend | Pullback in Uptrend, Oversold in Uptrend | Price above SMA 200 and RSI 14 at 40 or lower | Crypto, Stocks, Forex |
| Short trades | Short Selling | Strong Downtrend | The opposite value of each filter | Crypto, Stocks, Forex |
| Chart pattern breakouts | Trading Chart Patterns | Automated chart patterns | Not applicable | Crypto only |
The trend and breakout filters give the same signals as the test. The RSI value on altFINS can be different from the value in the test, so the oversold and pullback signals can come on a different day.
Open Signals SummaryStart the Free Trading Course
Limits of This Backtest
- The stock list contains the large companies of today. Companies that failed are not in the list. This makes the stock results look better.
- The crypto trend result depends on a small number of very large winners. It is not statistically conclusive (t-statistic 1.6). The stock results and the forex trend losses are stronger (t-statistic above 2.0).
- The test does not include funding rates, swap costs or dividends.
- The test has no stop loss. The worst crypto trades lost 40% to 50%. Read Risk Management before you trade these setups.
- The results are an average of all trades. They are not a portfolio simulation with position sizing.
- Past results do not predict future returns.
Frequently Asked Questions
Which trading strategy works best for crypto?
Trend following. In our 5-year test, the EMA 12/50 crossover had a profit factor of 1.77 on 10 large crypto assets. It won only 28% of trades, but the winners were much larger than the losers. In the last 12 months, the short side of the same strategy worked best.
Which trading strategy works best for stocks?
All 4 long strategies made money on large US stocks. Trend following had the highest profit factor (1.78). Buying oversold stocks (RSI below 30) had the highest win rate (64%). Short strategies lost money.
Which trading strategy works best for forex?
Mean reversion. Buying pairs with RSI below 30 and selling pairs with RSI above 70 had a profit factor of 1.44 and a 61% win rate on 10 major pairs. Trend following and breakout strategies lost money.
Is a high win rate better than a high profit factor?
No. In crypto, the oversold bounce won 55% of trades and made no money. Trend following won 28% of trades and had the best result. The size of the wins and losses is more important than the win rate.
Does trend following work in forex?
Not in this test. The EMA 12/50 crossover on 10 major pairs had a profit factor of 0.72 in 5 years and 0.38 in the last 12 months. Single trends, for example EUR/USD in autumn 2026, did make money.
How current is this data?
The backtest uses daily data to November 17, 2026. The live examples show the market on that date.
Find the right setup for each market
Scan crypto, stocks and forex for trends, breakouts and oversold signals. Start free.
Disclaimer: This article is for education only. It is not investment advice. Backtest results are hypothetical and do not include all trading costs. Trading crypto, stocks and forex has a high risk of loss.