Search Knowledge Base by Keyword
Mastering Candlestick Patterns for Successful Crypto Trading
What Are Candlestick Patterns?
Update: September, 2025
Definition: Candlestick patterns visually represent price movements in cryptocurrency markets. Each “candle” on a trader’s chart provides key details about the opening, closing, high, and low prices within a chosen time frame, such as minutes, hours, days, or weeks. The shape and arrangement of these candles form patterns that reveal valuable insights into market sentiment and potential price trends.
altFINS crypto screener allows traders to create custom filters based on Candlestick patterns. These patterns include 1-Candle Patterns, 2-Candle Patterns, and patterns involving 3 or more candles. Traders can enhance their trading strategies by selecting from an additional 120 technical indicators. Soon, candlestick patterns appear in the Pre-set filter and Signal Summary.
Read more about the essential candlestick patterns in this article.
Where To Find Candlestick Patterns on altFINS?
To access Candlestick patterns on altFINS, go to
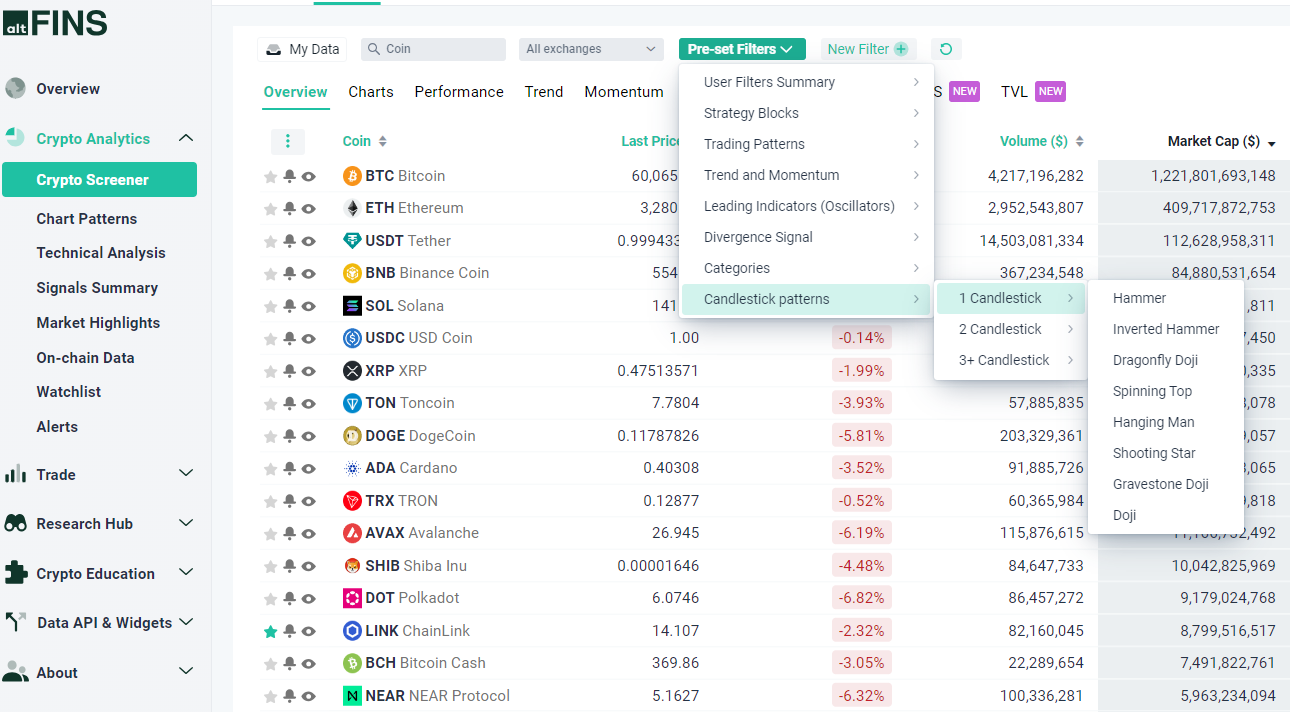
1. Crypto Screener: Preset Filters
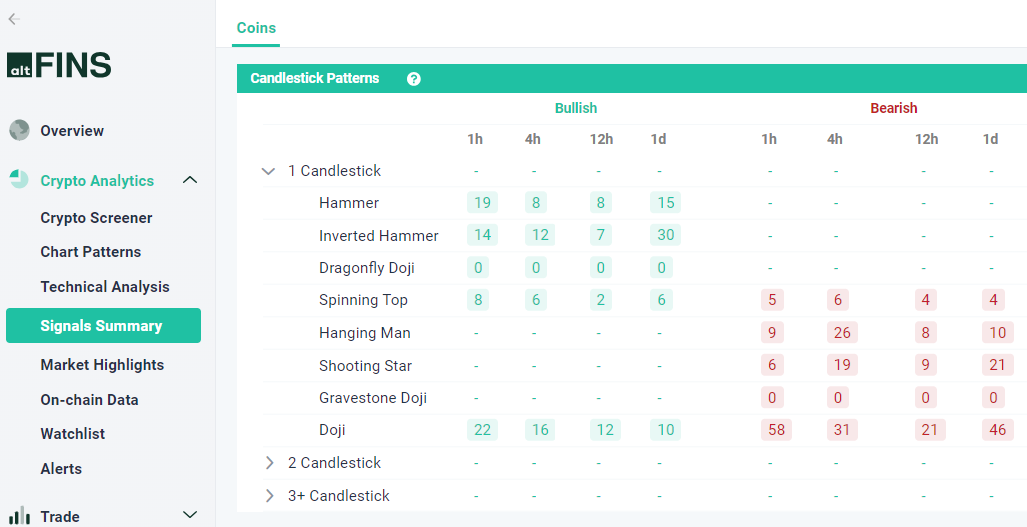
2. Signals Summary
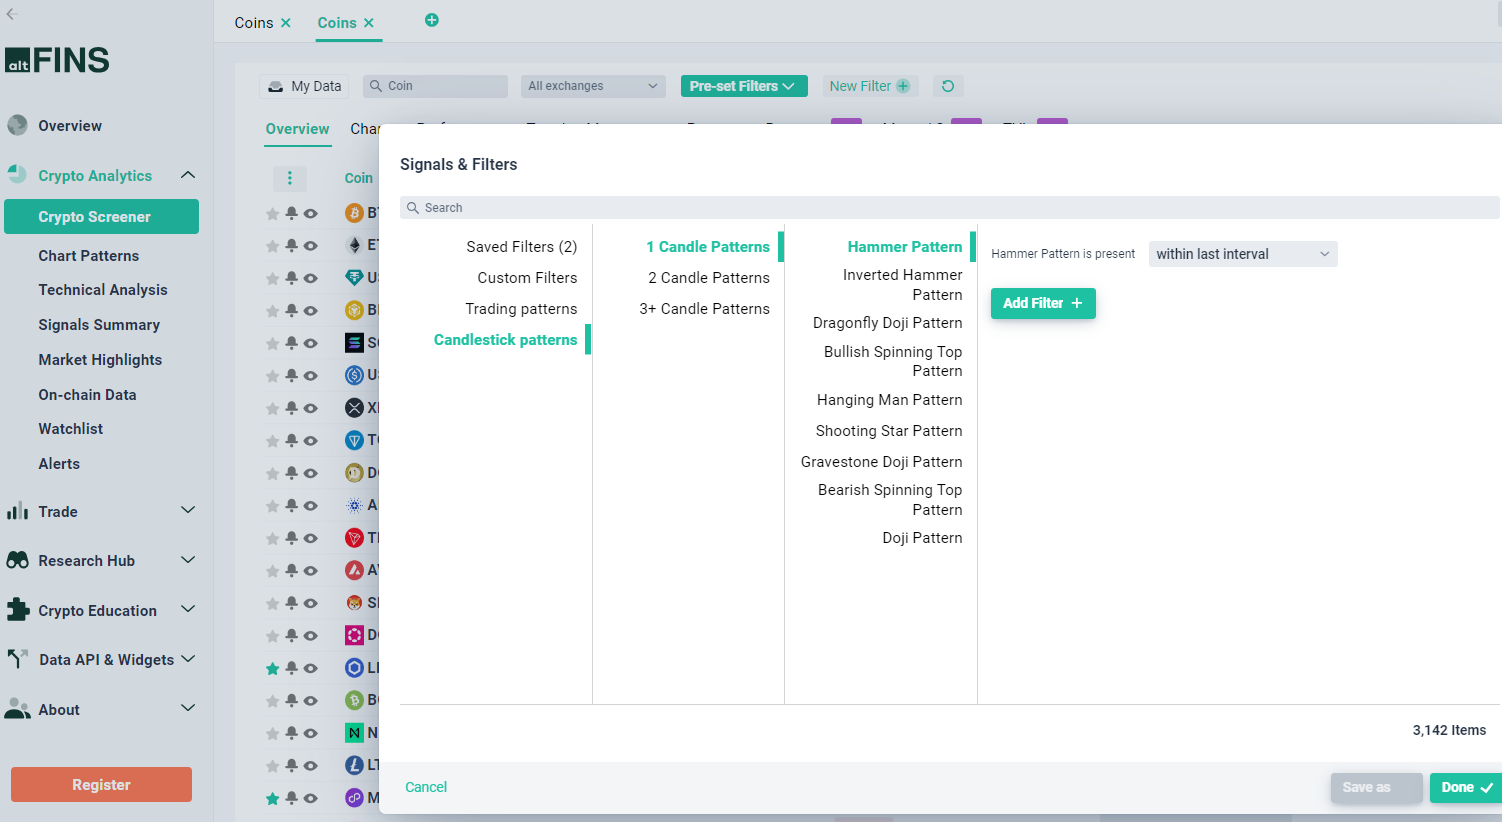
3. Crypto Screener: Custom Filters
Leveraging Candlestick Patterns in Crypto Trading
Given the inherent volatility of cryptocurrency markets, technical analysis tools like candlestick patterns are indispensable for crypto traders. By analyzing these patterns, crypto traders can pinpoint potential trend reversals, continuation patterns, and consolidation phases. Some primary ways to harness the power of candlestick patterns in crypto trading include:
- Predicting Reversals: Certain patterns act as indicators for possible trend reversals, aiding crypto traders in strategic entry and exit points.
- Confirmation of Signals: The integration of candlestick patterns with other technical indicators can enhance the accuracy of trading signals.
- Enhancing Risk Management: By comprehending patterns, crypto traders can set up stop-loss and take-profit parameters with greater precision.
Pros and Cons of Implementing Candlestick Patterns in Crypto Trading
Pros of using Candlestick Patterns:
- Visual Clarity: Candlestick patterns offer crypto traders a visually intuitive depiction of market sentiment and trends.
- Widespread Recognition: These patterns are universally acknowledged, making them accessible and comprehensible to crypto traders of varying experience levels.
- Optimized Timing: Crypto traders can finely time their entry and exit strategies through effective pattern analysis.
Cons of using Candlestick Patterns:
- Subjectivity: Interpreting candlestick patterns can be subjective, potentially leading to misinterpretations by crypto traders.
- Challenges in Volatile Markets: Sudden price fluctuations in crypto markets can trigger false signals from patterns.
- Exclusive Focus on Technicals: Relying solely on technical analysis might overshadow critical fundamental factors impacting crypto markets.
Your Guide to Candlesticks Patterns on the altFINS Crypto Screener
For crypto traders seeking to navigate the dynamic world of cryptocurrency markets, the altFINS platform emerges as an invaluable ally. With its comprehensive coverage of candlestick patterns, (32 total including 1- 2- and 3+ candle patterns), altFINS equips crypto traders with powerful tools to enhance their crypto trading strategies. In this informative guide, we will delve into the array of candlestick patterns available on the altFINS crypto screener section, catering to the needs of every crypto trader.
Watch this tutorial video and learn how to identify and use Candlestick patterns on altFINS platform
Create your own filter on altFINS Crypto Screener
Diverse types of Candlestick patterns on altFINS platform:
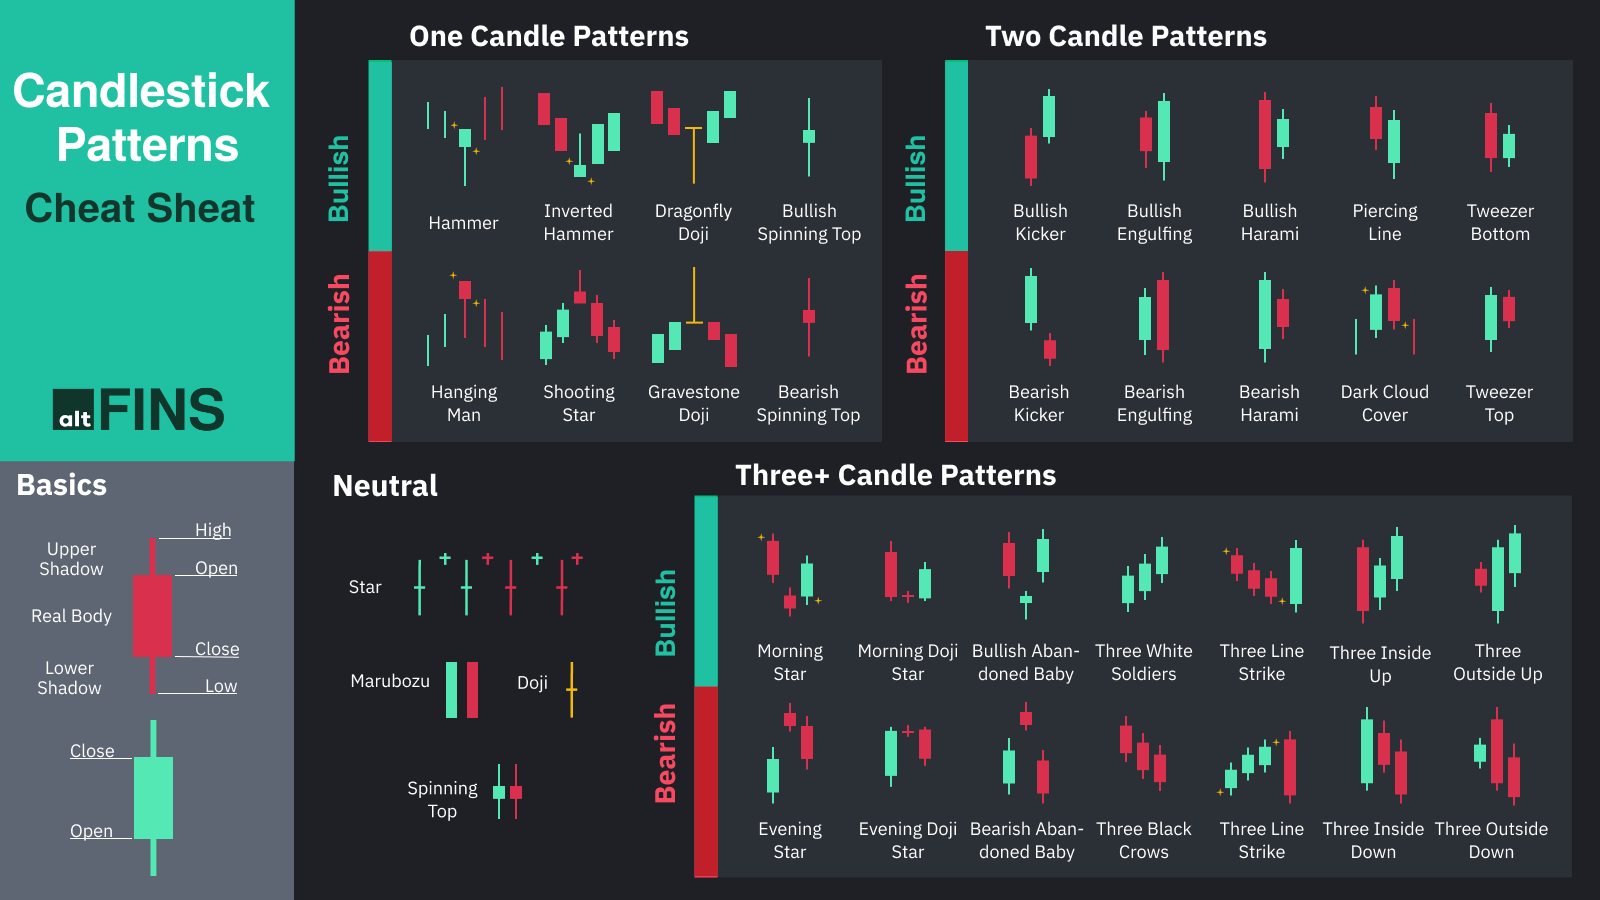
1-Candle Patterns: Insights for Swift Crypto Trading Decisions
The altFINS crypto screener boasts an array of 1-candle patterns, providing crypto traders with concise insights that can aid in rapid decision-making. Within this category, you’ll find:
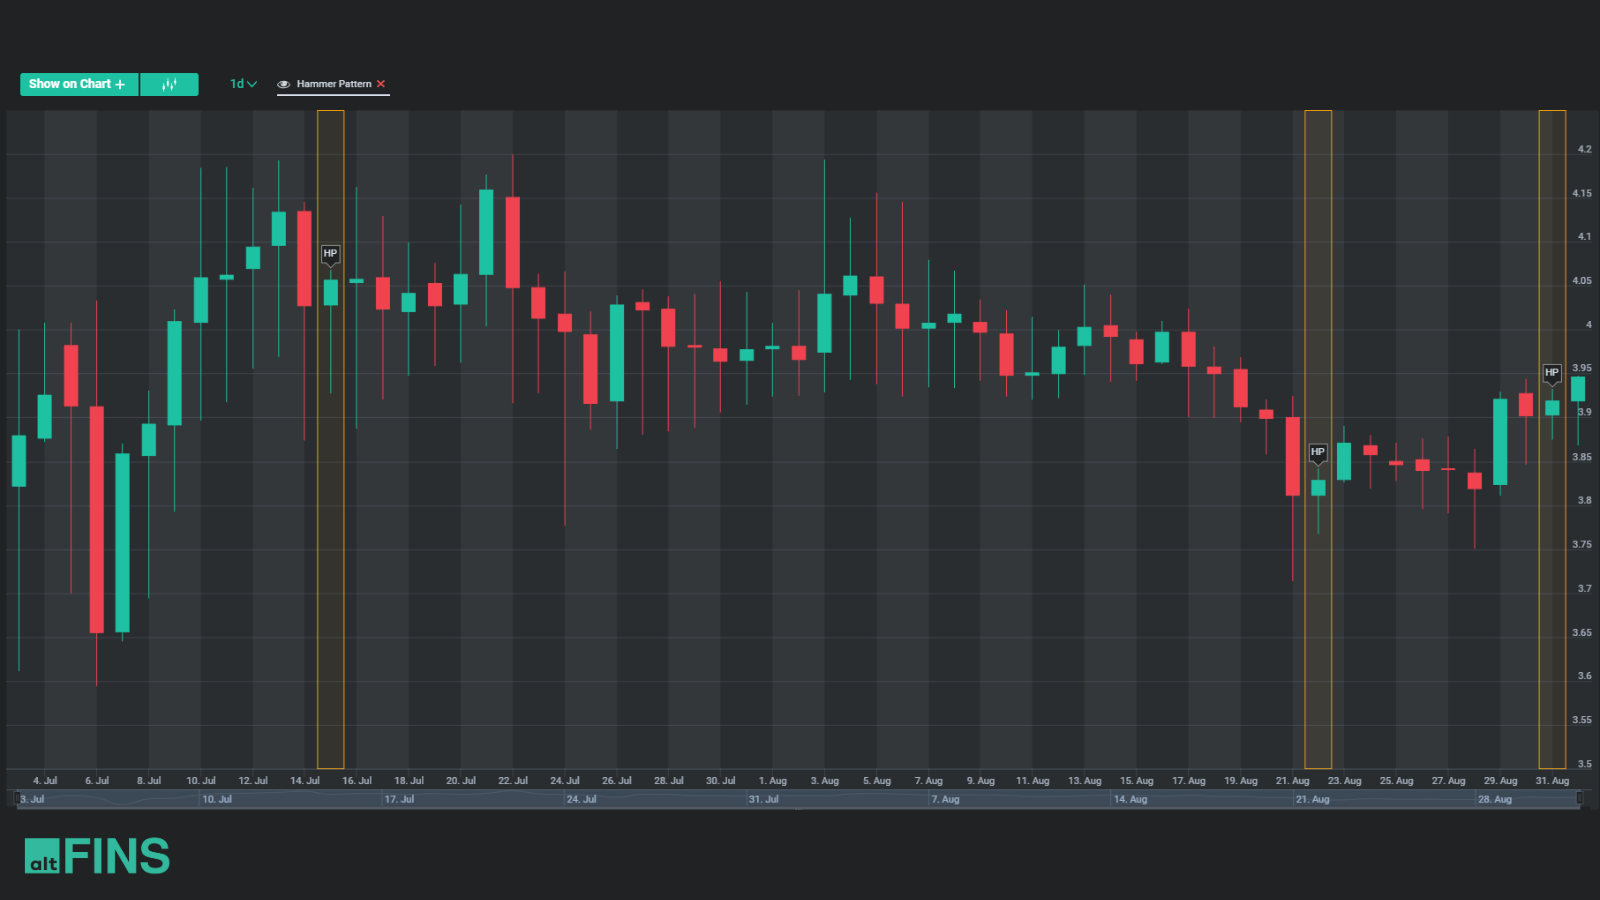
- Hammer Pattern: A bullish formation signaling potential trend reversals, characterized by a small body near the top and a long lower shadow.
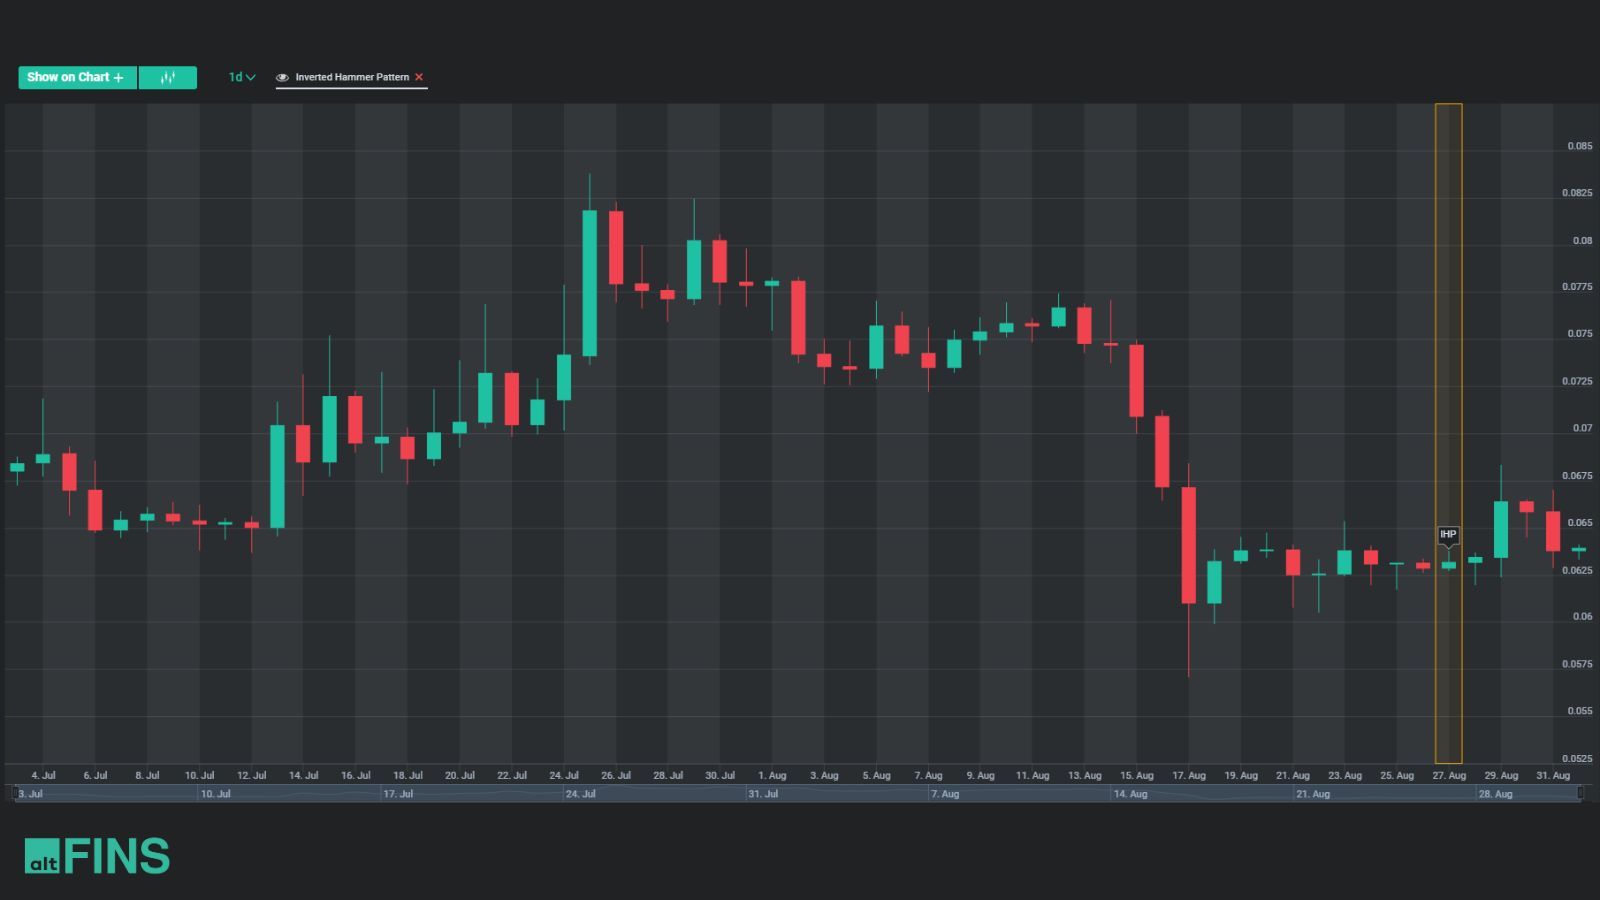
- Inverted Hammer Pattern: Appearing after a downtrend, this pattern features a small real body near the bottom and a long upper shadow, hinting at bullish reversals.
- Dragonfly Doji Pattern: Indicating potential trend reversals, this pattern showcases a small real body near the top and a long lower shadow, suggesting buyer resurgence.
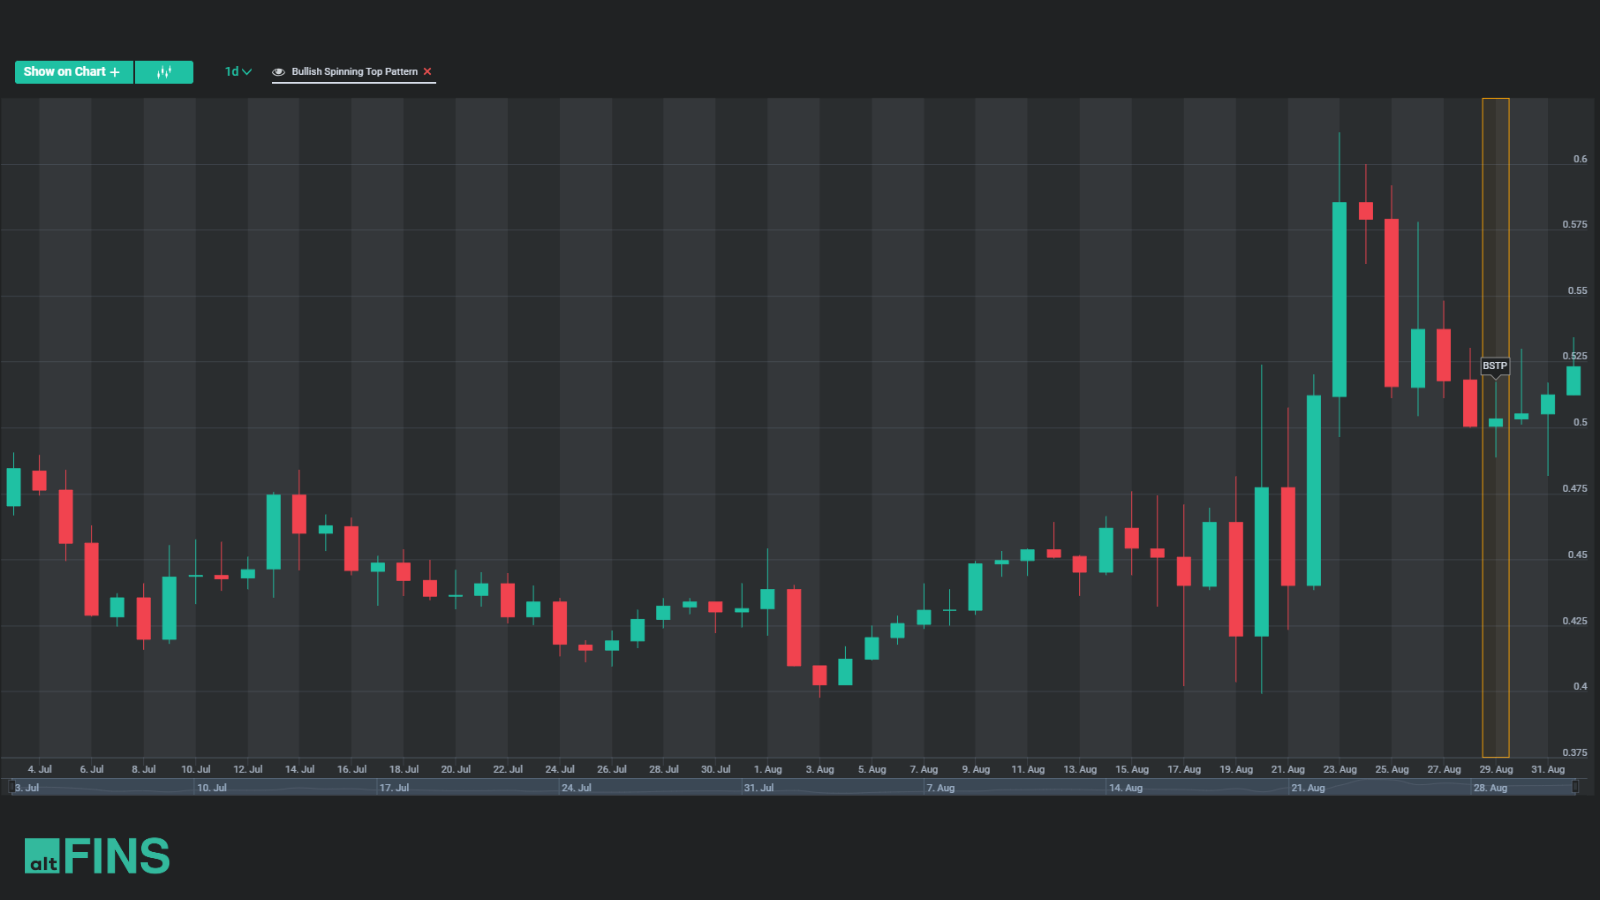
- Bullish Spinning Top Pattern: Reflecting market indecision, this pattern emerges as a small real body with long upper and lower shadows, potentially signaling shifts in momentum.
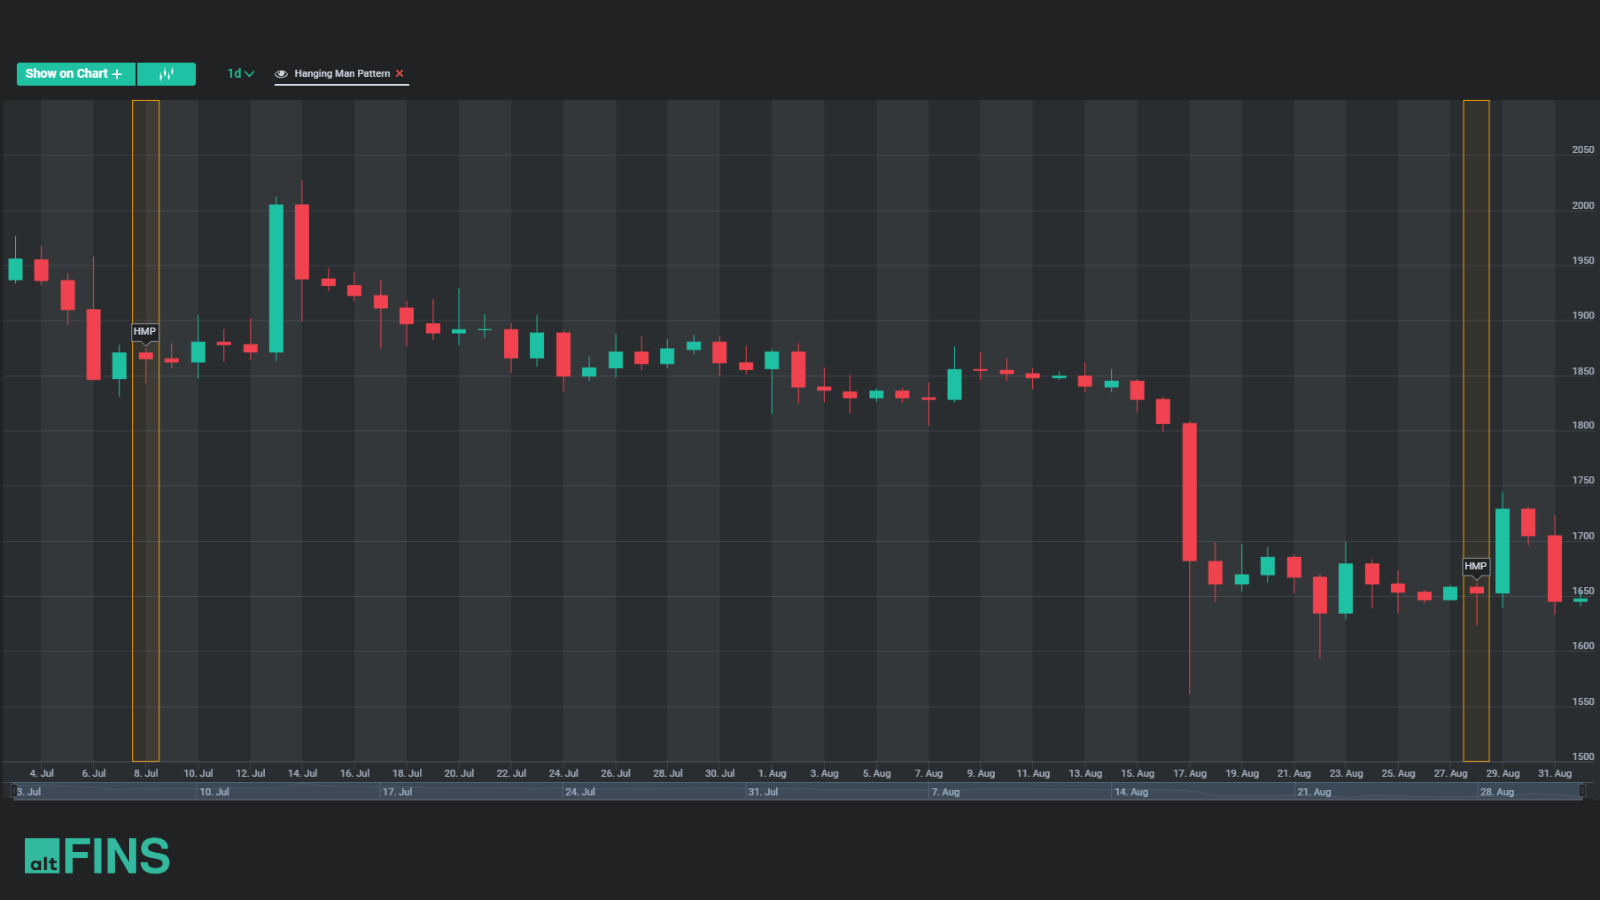
- Hanging Man Pattern: With a small real body near the top and a long lower shadow, this bearish pattern warns of potential trend reversals, especially after an uptrend.
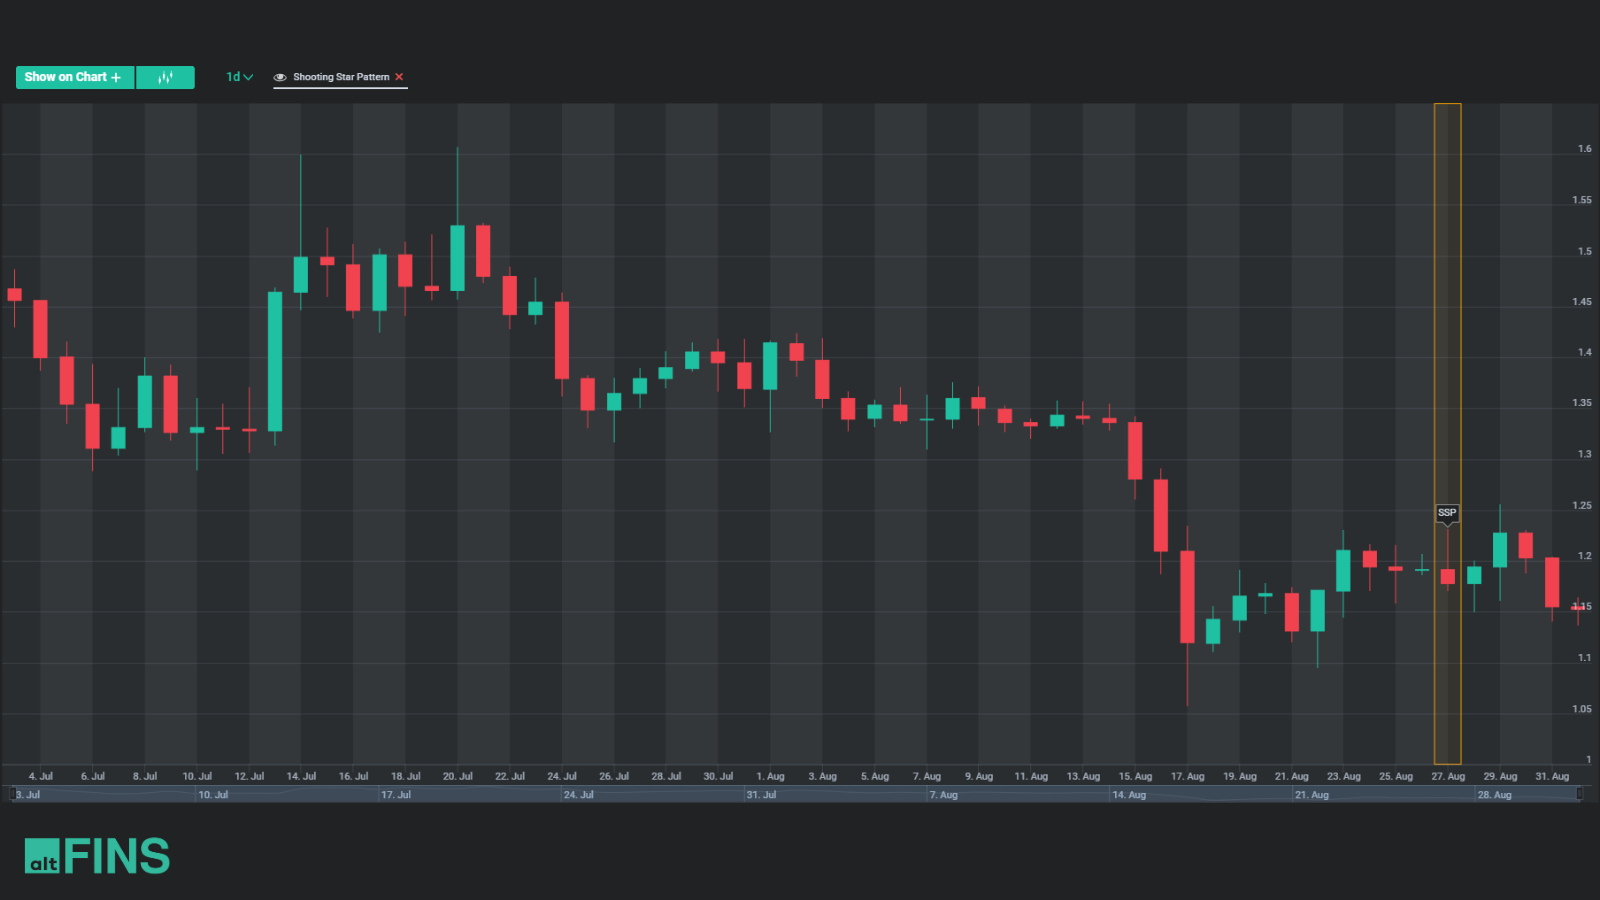
- Shooting Star Pattern: Occurring after an uptrend, this pattern features a small real body near the bottom and a long upper shadow, suggesting bearish reversals.
- Gravestone Doji Pattern: Following an uptrend, this bearish reversal pattern displays a small real body at the bottom and a long upper shadow, emphasizing potential reversals.
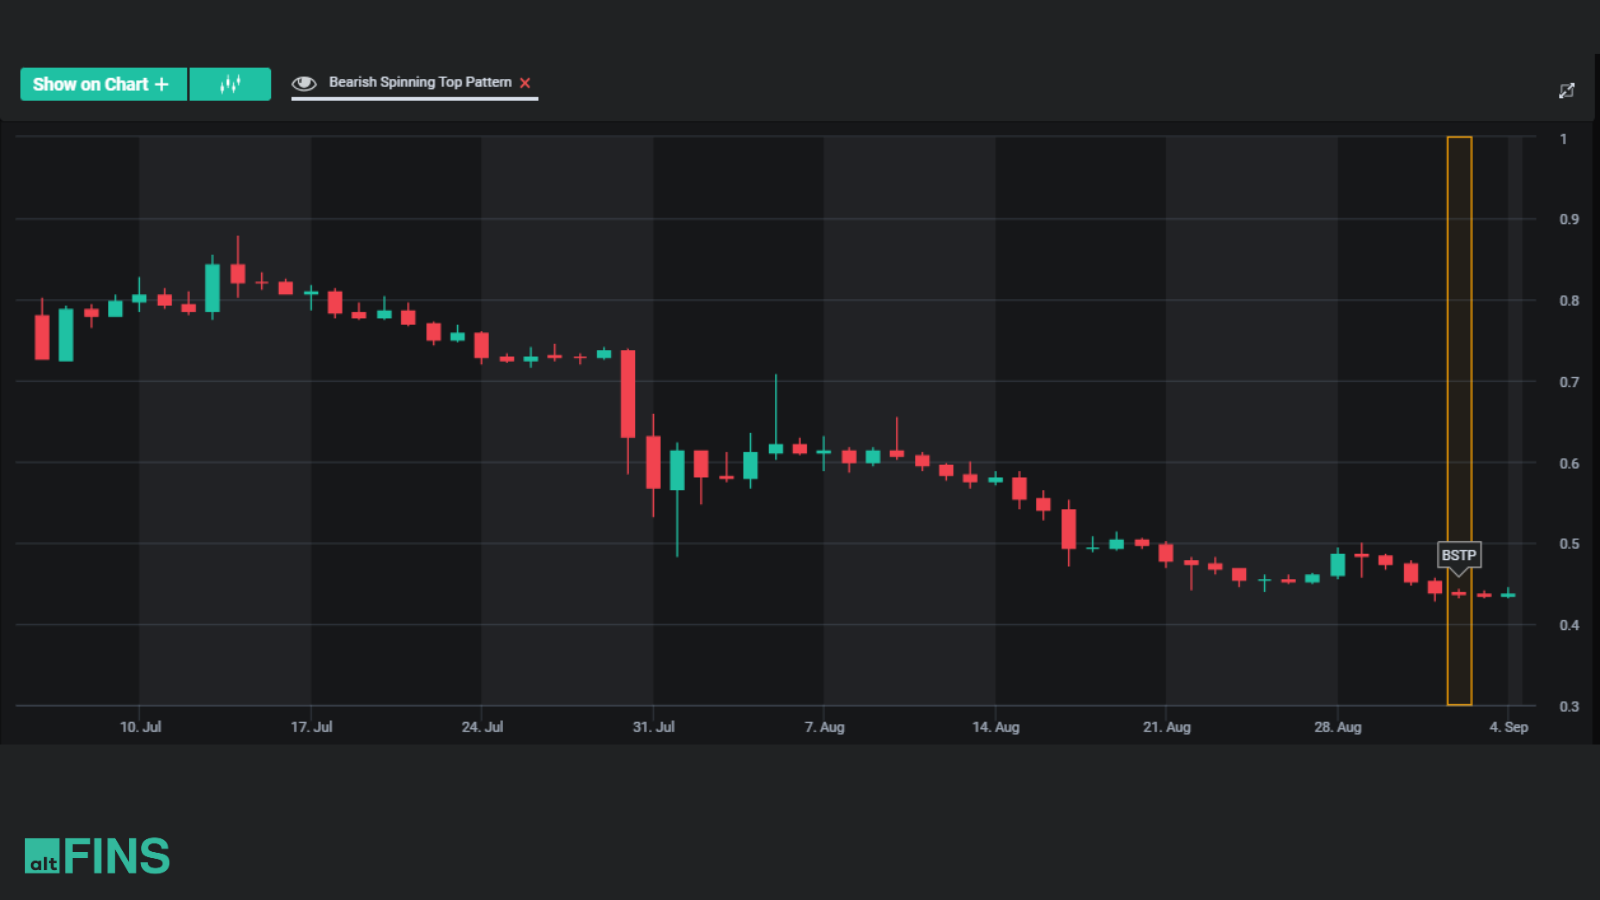
- Bearish Spinning Top Pattern: Indicating market indecision after an uptrend, this pattern’s small real body and extended shadows hint at impending bearishness.
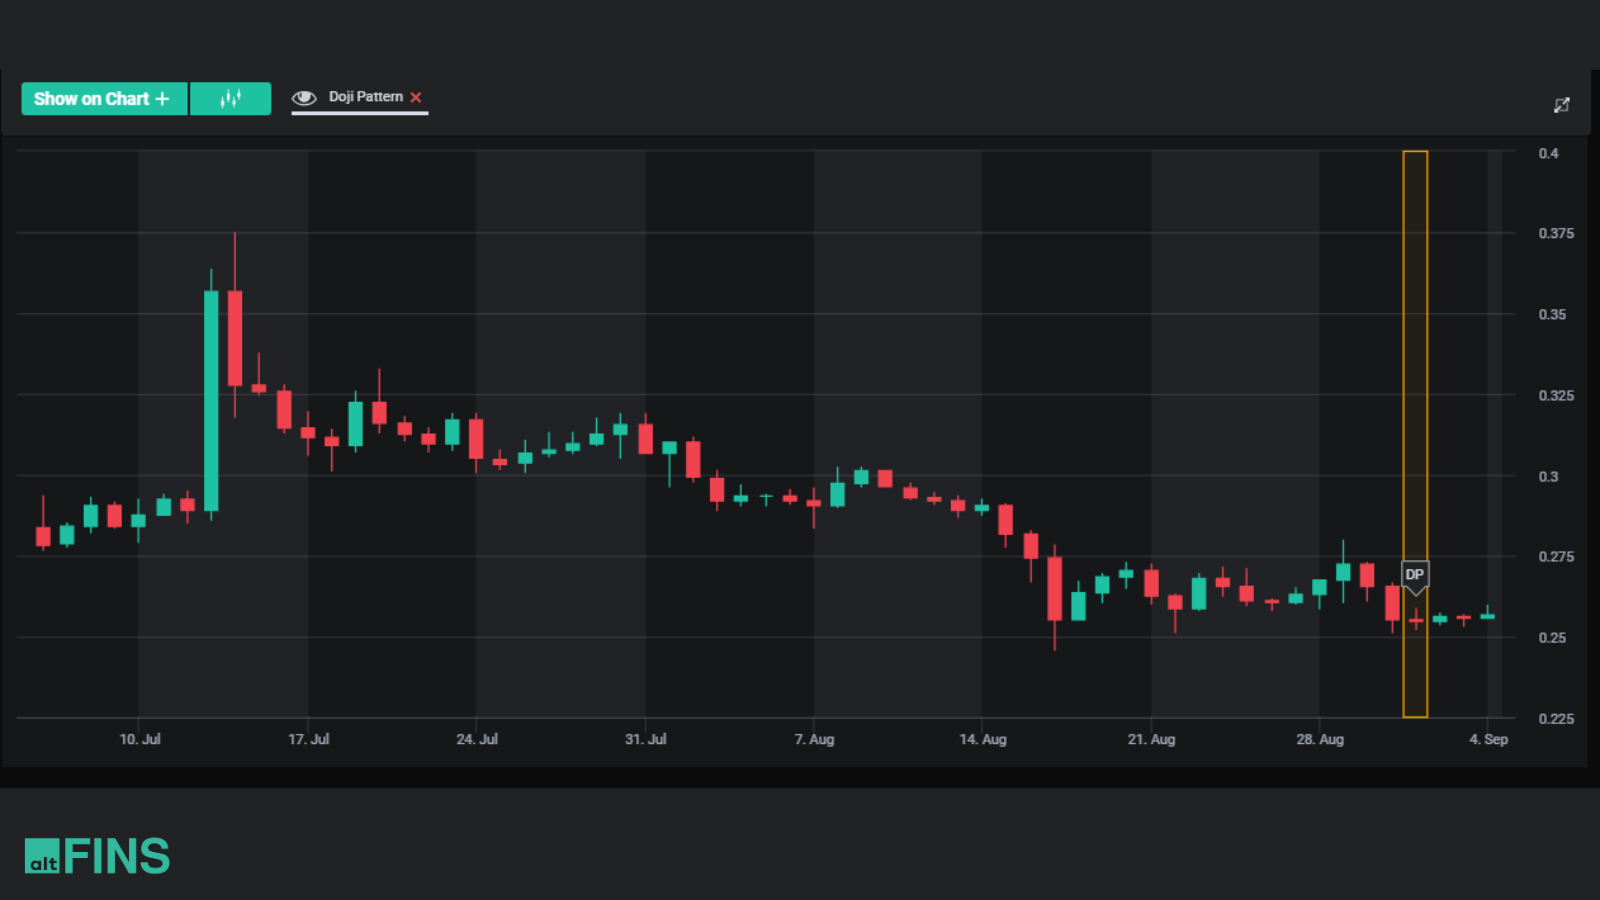
- Doji Pattern: A hallmark of indecision, the Doji presents virtually identical opening and closing prices, signaling potential reversals for crypto traders.
2-Candle Patterns: Deeper Insights for Nuanced Crypto Trading Strategies
Within the 2-candle patterns, altFINS offers crypto traders the means to dive deeper into market dynamics. The platform covers an array of formations, including:
- Bullish Kicker Pattern: A bullish reversal pattern, with the second candle opening higher than the previous candle’s close, indicating potential upward momentum.
- Bullish Engulfing Pattern: This pattern features a larger bullish candle that engulfs the prior bearish candle, suggesting a shift towards bullish sentiment.
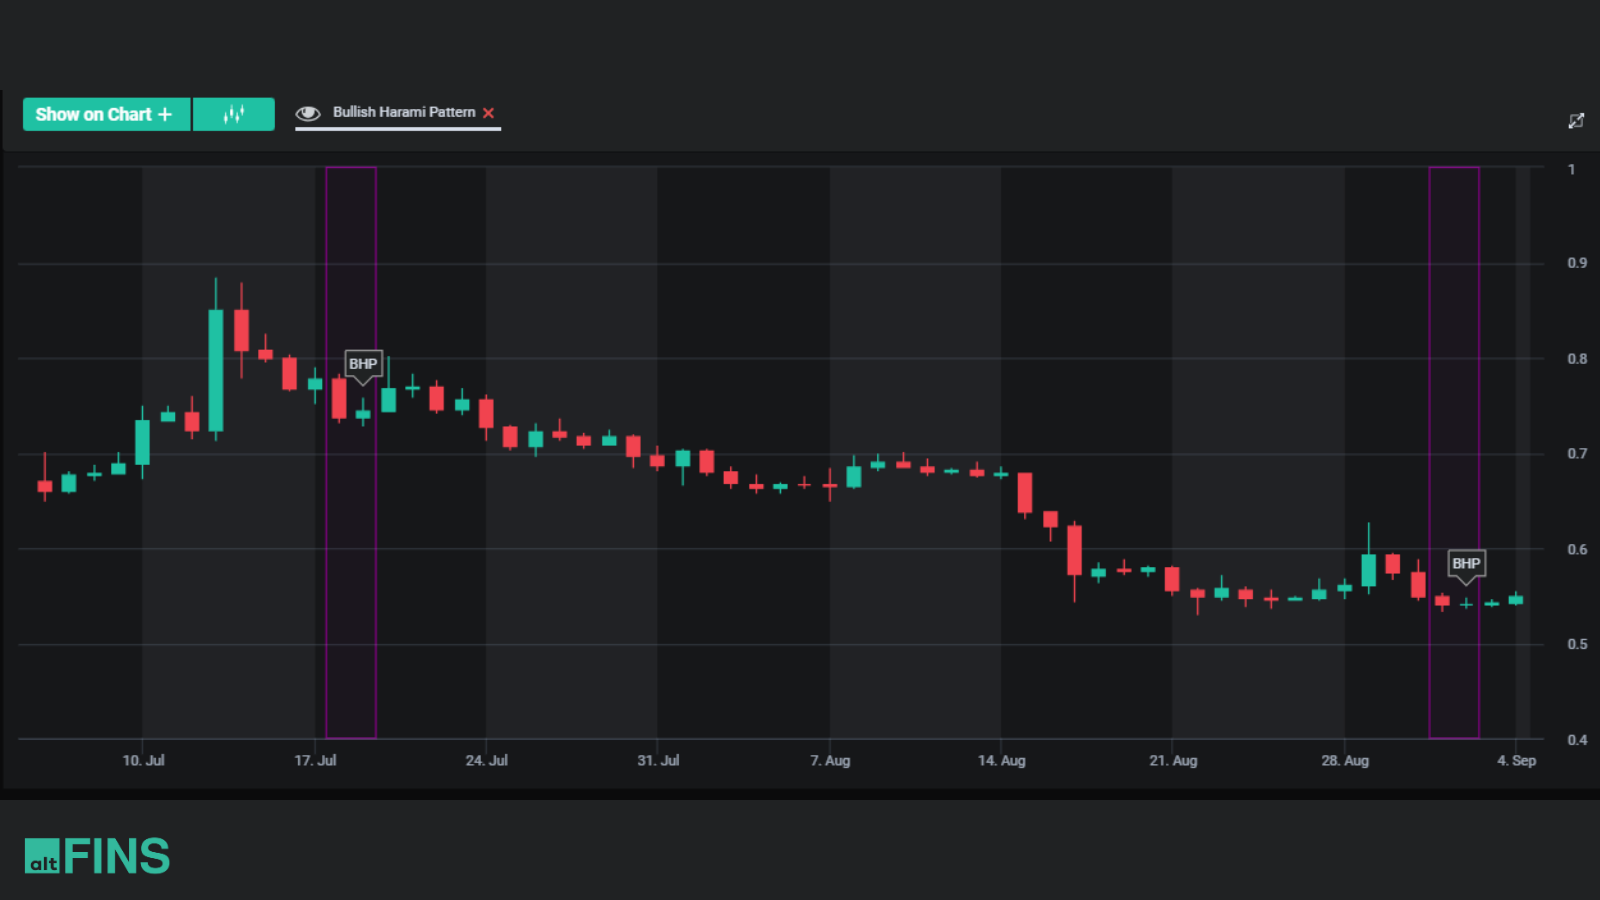
- Bullish Harami Pattern: Emerging after a downtrend, this pattern showcases a small bullish candle within the previous candle’s body, indicating potential bullish reversals.
- Piercing Line Pattern: A two-candle formation, the second candle opens higher and closes above the midpoint of the first candle, signifying potential trend reversals.
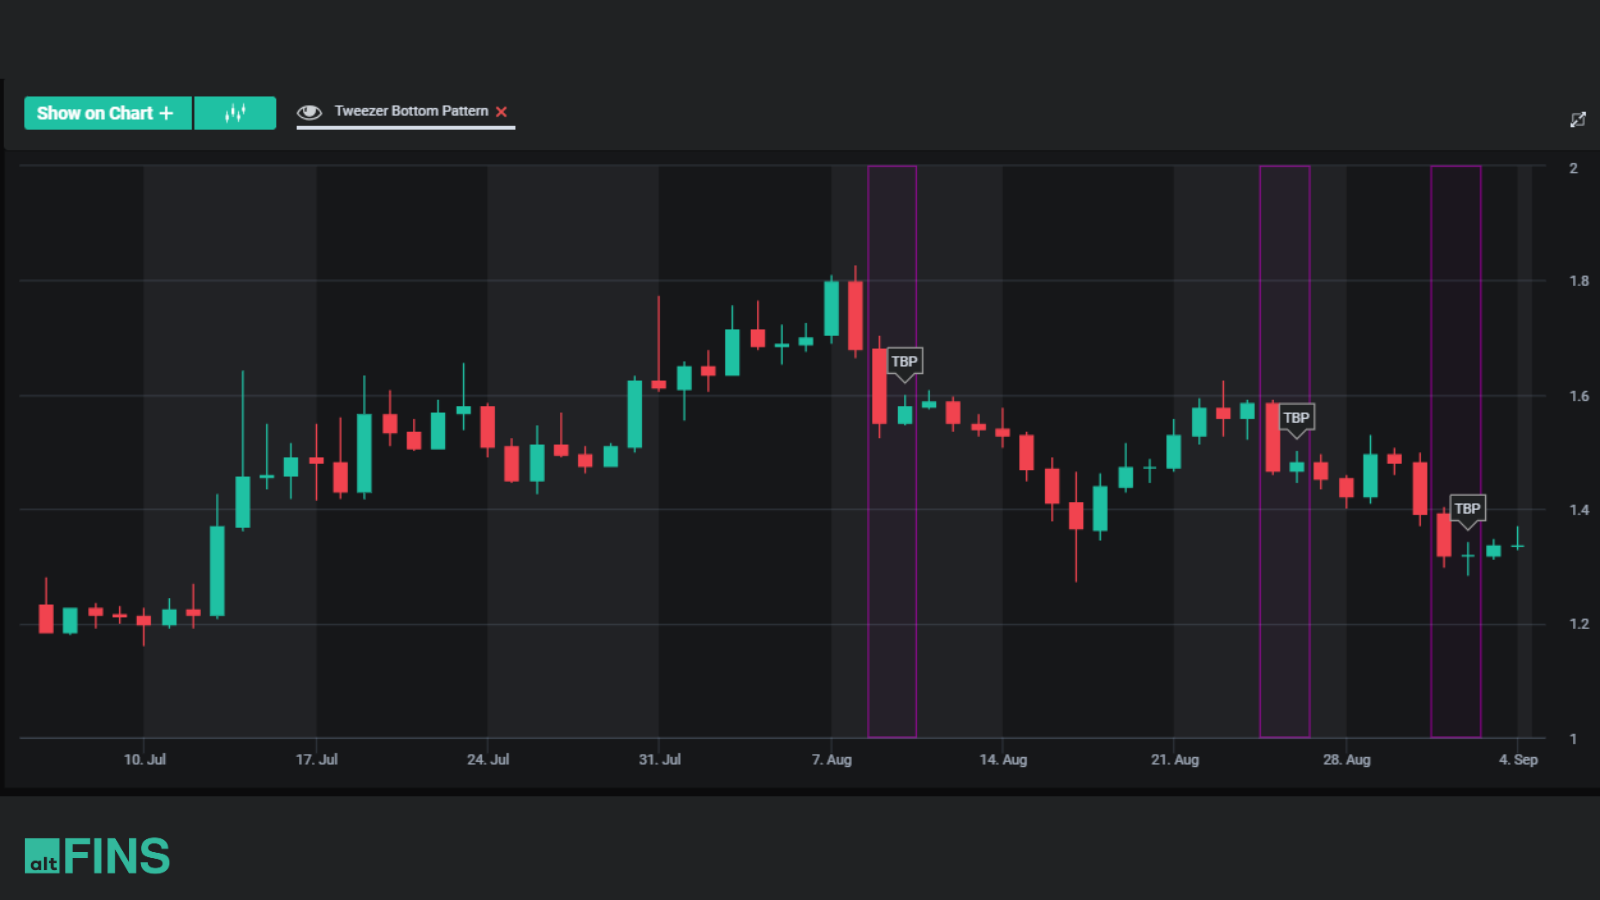
- Tweezer Bottom Pattern: Displaying two candles with identical lows, this pattern suggests potential bullish reversals, especially in the context of downtrends.
- Bearish Kicker Pattern: An indicative bearish reversal, the second candle opens lower than the prior bullish candle’s close, signaling potential downward momentum.
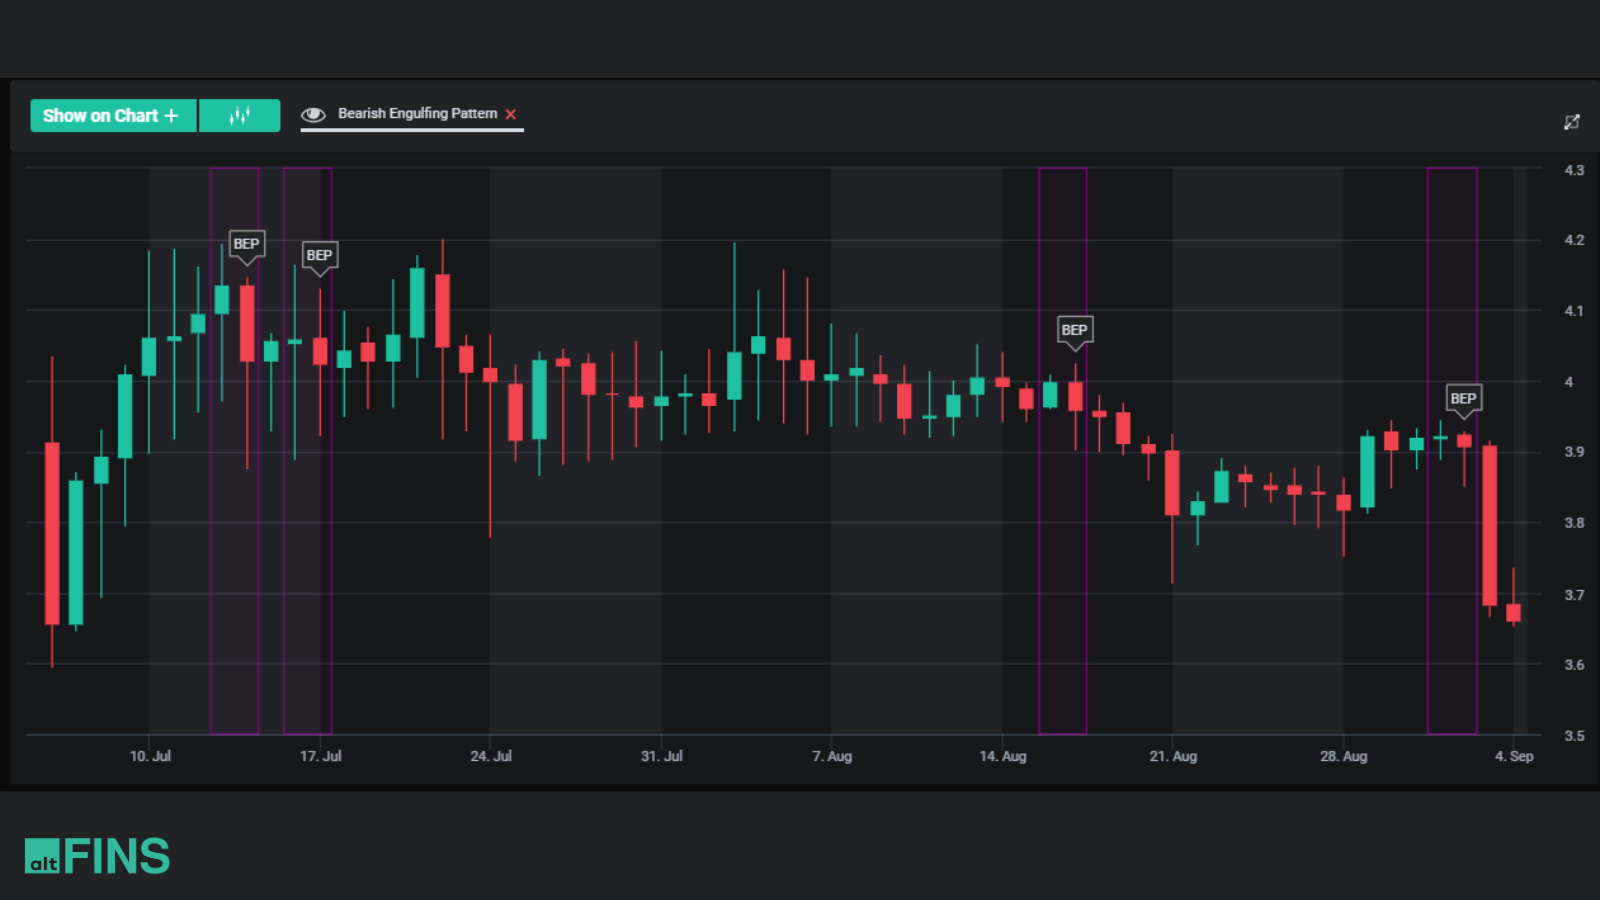
- Bearish Engulfing Pattern: With a larger bearish candle engulfing the preceding bullish one, this pattern hints at a shift towards bearish sentiment.
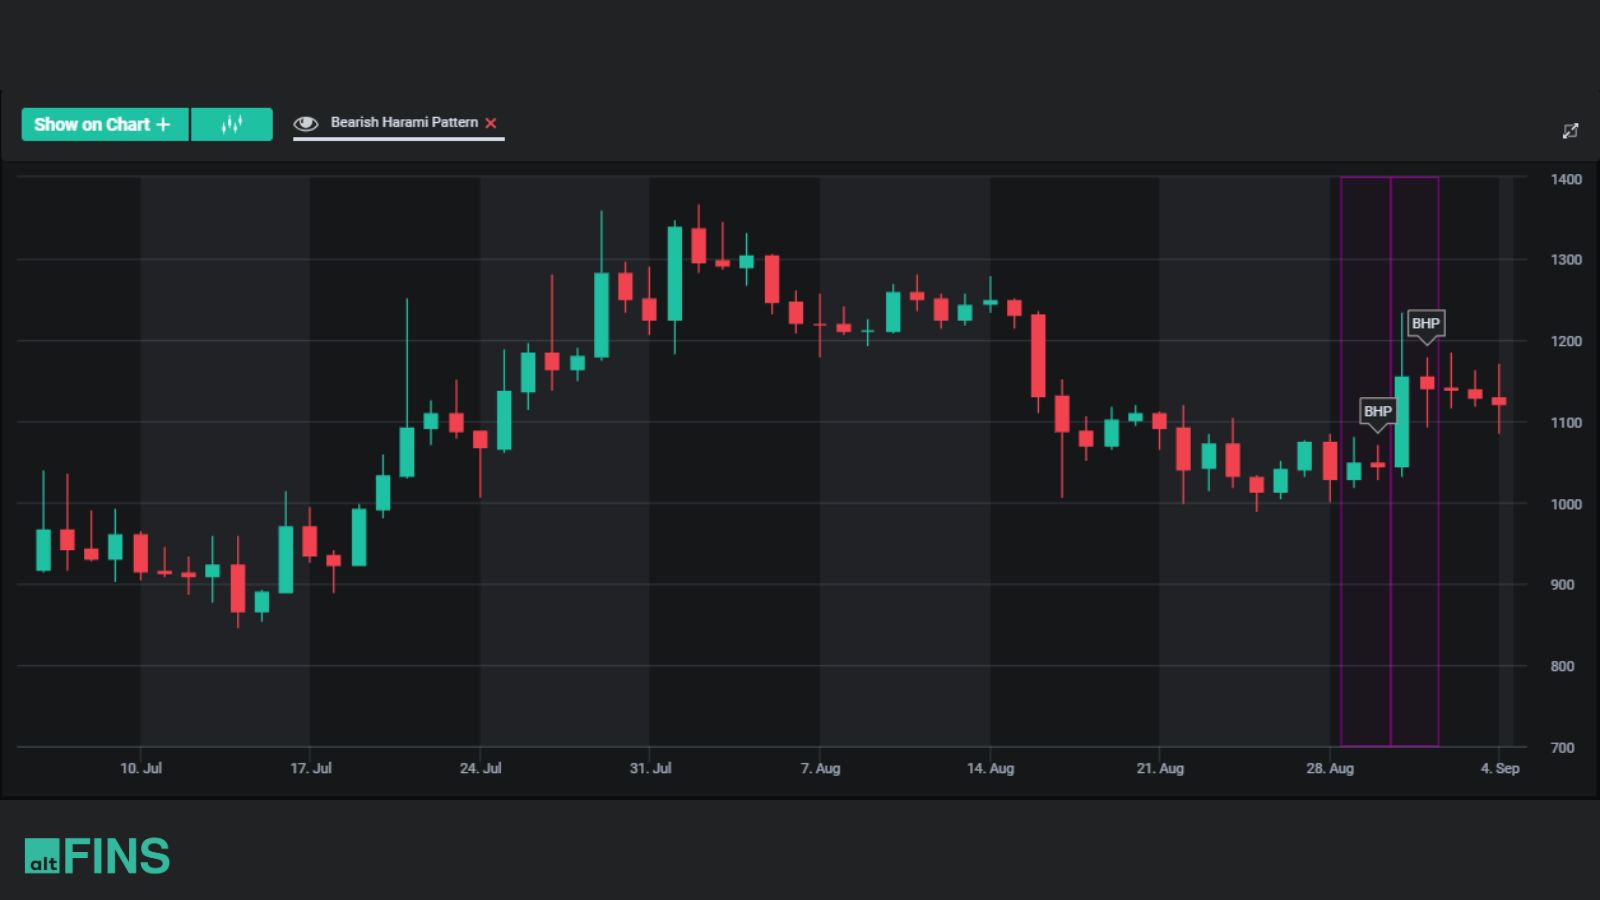
- Bearish Harami Pattern: Following an uptrend, this pattern involves a small bearish candle within the prior candle’s body, suggesting potential bearish reversals.
- Dark Cloud Cover Pattern: A bearish pattern, the second candle opens higher but closes below the midpoint of the first candle, indicating potential trend reversals.
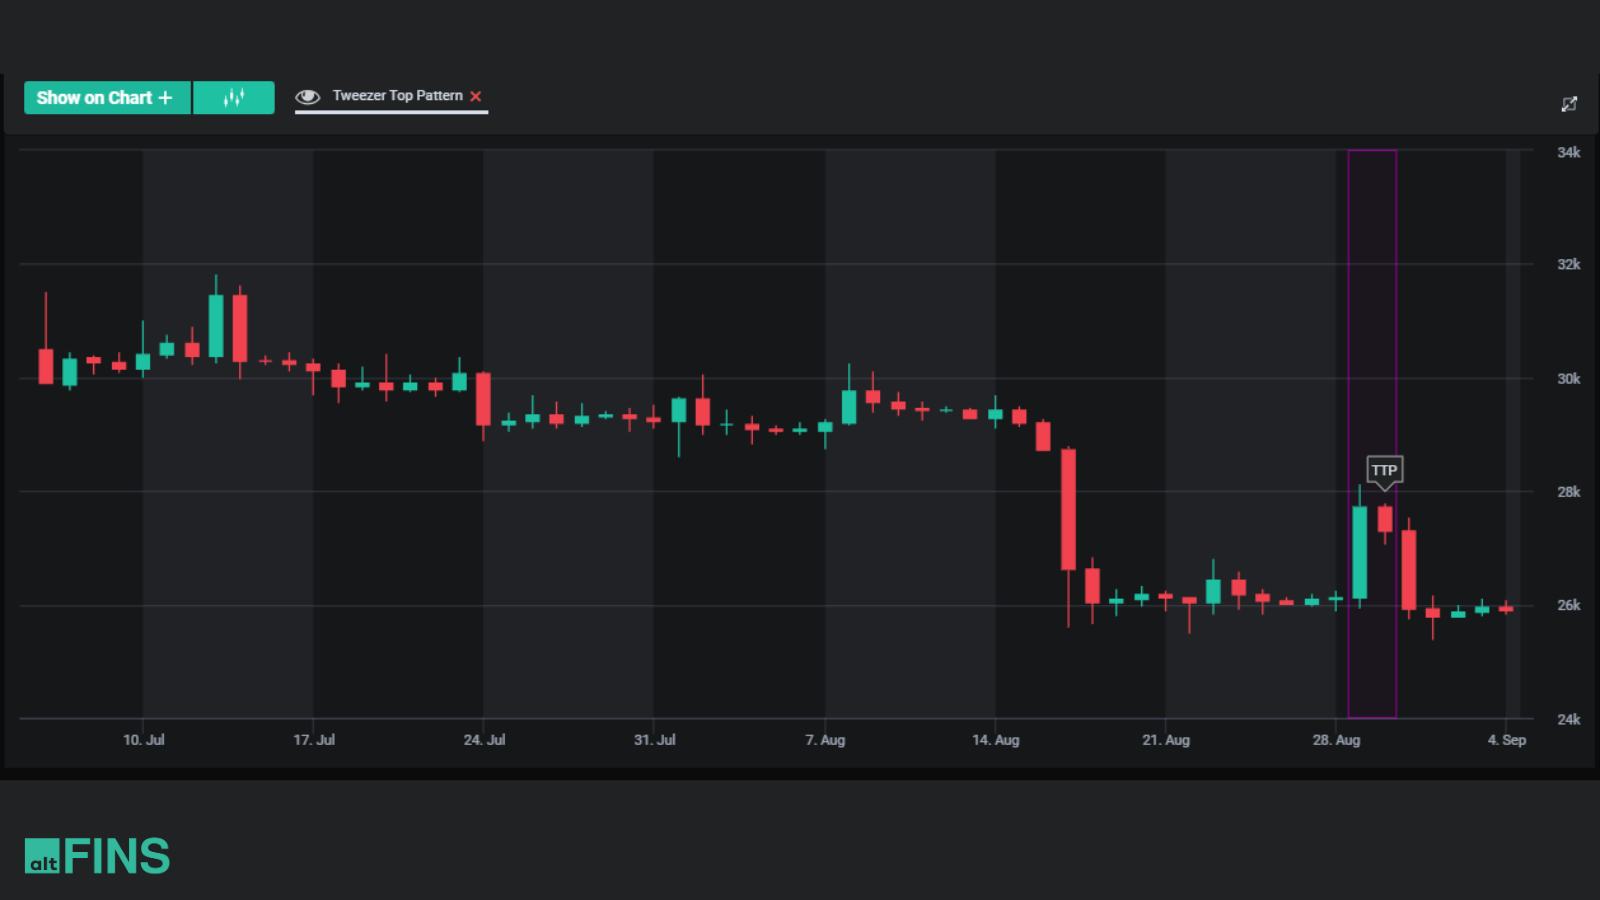
- Tweezer Top Pattern: With two candles sharing identical highs, this pattern suggests potential bearish reversals, particularly in the context of uptrends.
3+ Candles Patterns: Insights for Complex Market Dynamics
For crypto traders delving into more intricate market scenarios, the altFINS crypto screener offers a variety of 3+ candles patterns, including:
- Morning Star Pattern: A bullish reversal formation, it features a star in the middle flanked by a bearish candle and a larger bullish candle.
- Morning Doji Star Pattern: This pattern’s center candle is a Doji, making it a powerful bullish reversal signal when accompanied by surrounding candles.
- Bullish Abandoned Baby Pattern: A rare and potent pattern, it includes a gap between two Doji candles, suggesting a strong bullish reversal.
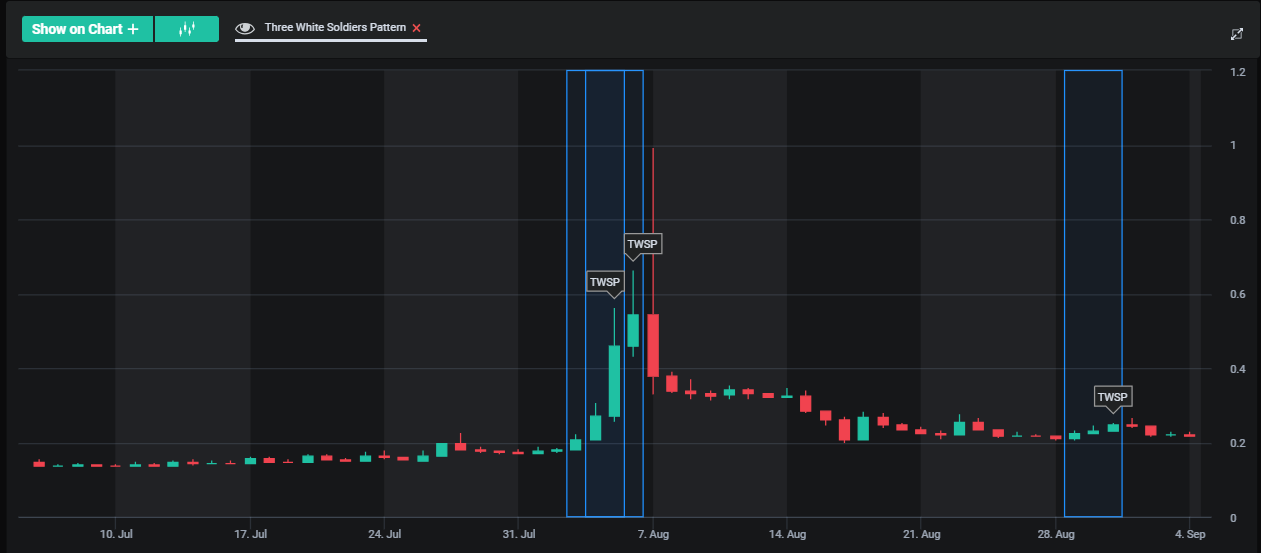
- Three White Soldiers Pattern: This pattern involves three consecutive bullish candles, signifying strong upward momentum.
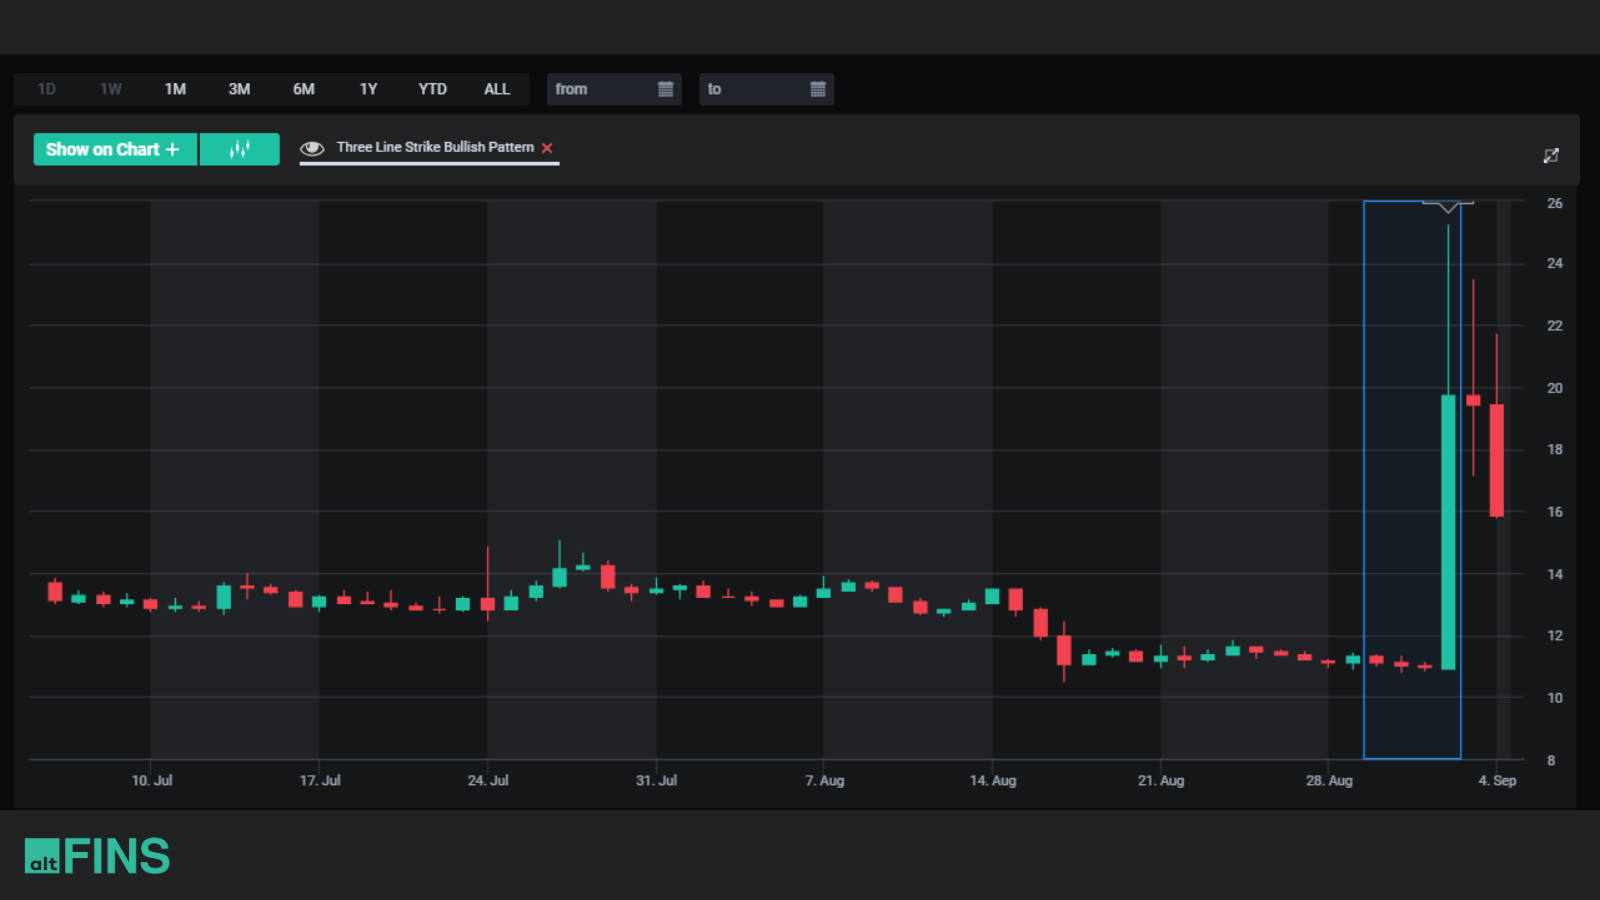
- Three Line Strike Bullish Pattern: Emerging as three bullish candles following a downtrend, this pattern hints at potential trend reversals.
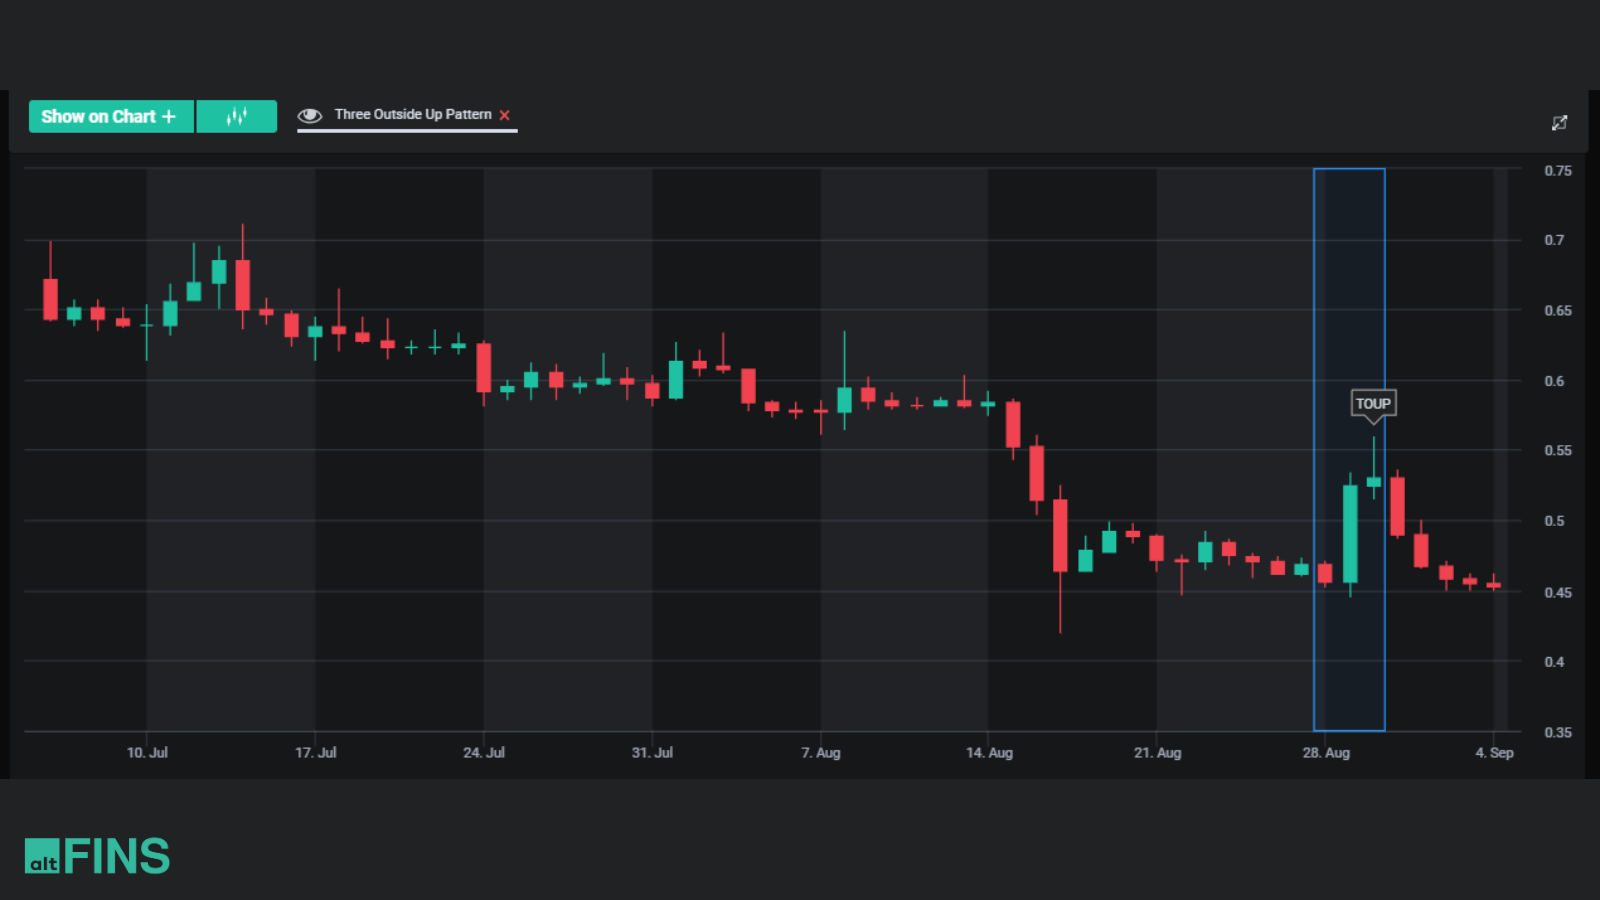
- Three Inside Up Pattern: Consisting of three candles, this pattern showcases a small bullish candle within the body of the previous bearish candle, signifying bullish potential.
- Evening Star Pattern: A bearish reversal pattern, it comprises a star flanked by a bullish candle and a larger bearish candle.
- Evening Doji Star Pattern: The center candle in this pattern is a Doji, making it a potent bearish reversal signal when accompanied by the surrounding candles.
- Bearish Abandoned Baby Pattern: Similar to its bullish counterpart, this bearish pattern features a gap between two Doji candles, suggesting a strong bearish reversal.
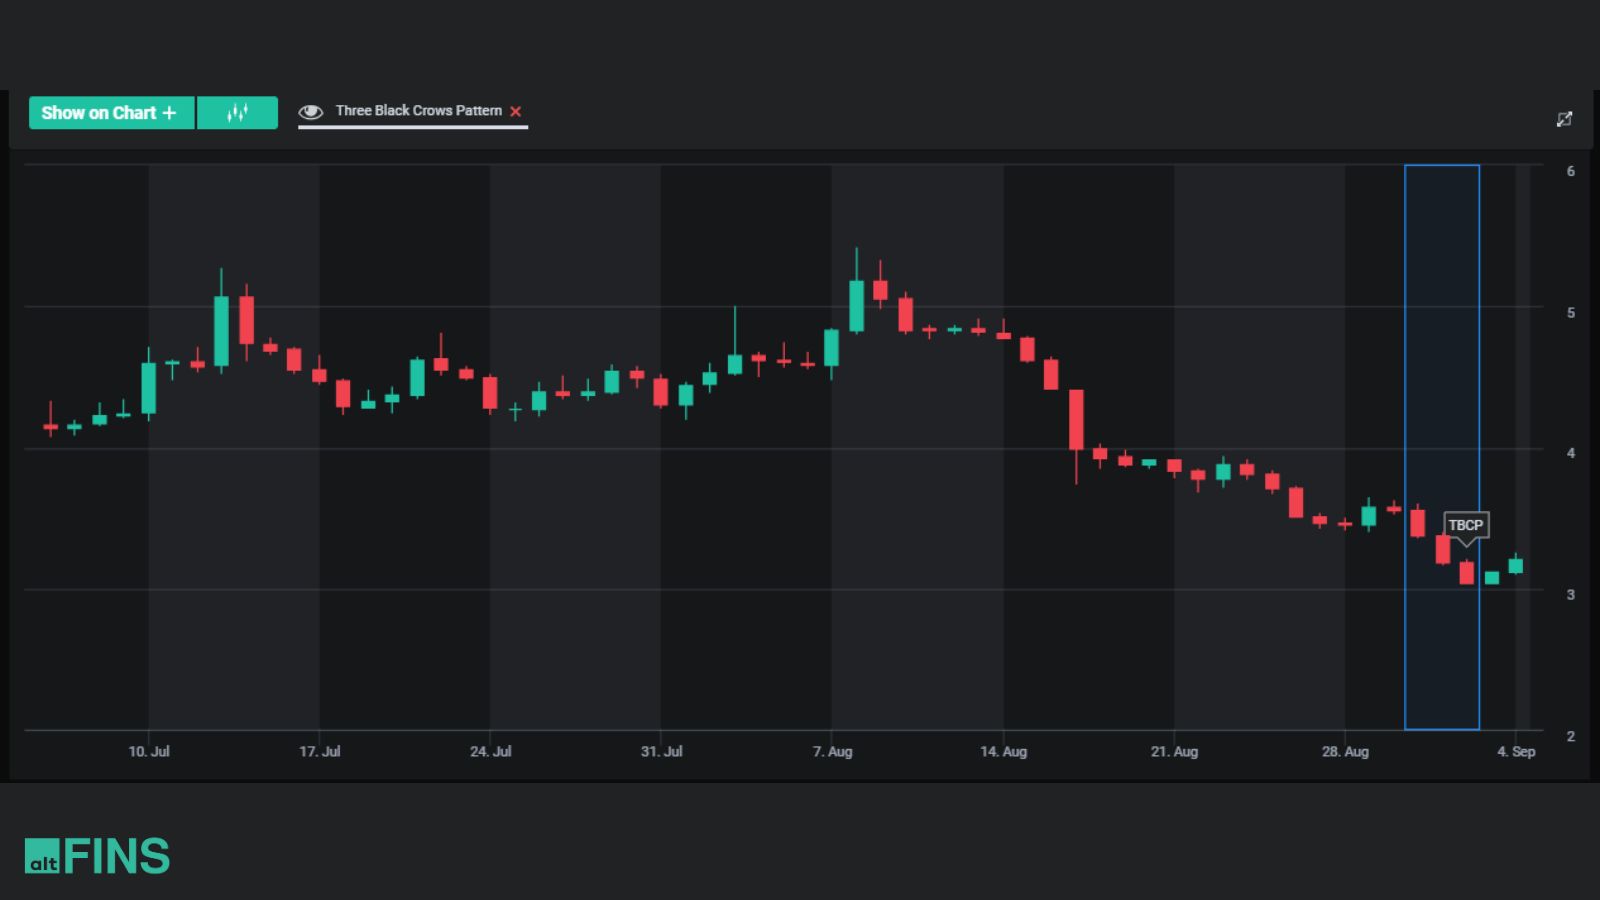
- Three Black Crows Pattern: Three consecutive bearish candles signify strong downward momentum, indicating potential bearish trends.
- Three Line Strike Bearish Pattern: Following an uptrend, this pattern involves three bearish candles, suggesting potential trend reversals.
- Three Inside Down Pattern: Featuring a small bearish candle within the body of the previous bullish candle, this pattern implies bearish potential.
- Three Outside Down Pattern: A bearish continuation pattern, it involves two bearish candles surrounding a larger bullish candle.
Step by Step Guide: How To Create a Custom Filter with Candlestick Patterns on altFINS Crypto Screeener!
altFINS Crypto Screener is a powerful tool for traders and investors looking to analyze cryptocurrency markets. One of its standout features is the ability to create custom filters, allowing you to pinpoint specific trading opportunities. In this step-by-step guide, we’ll show you how to create a custom filter using candlestick patterns on altFINS Crypto Screener:
Step 1: Access altFINS Crypto Screener
Start by visiting the altFINS website and logging into your account. If you don’t have an account, you can sign up for free.
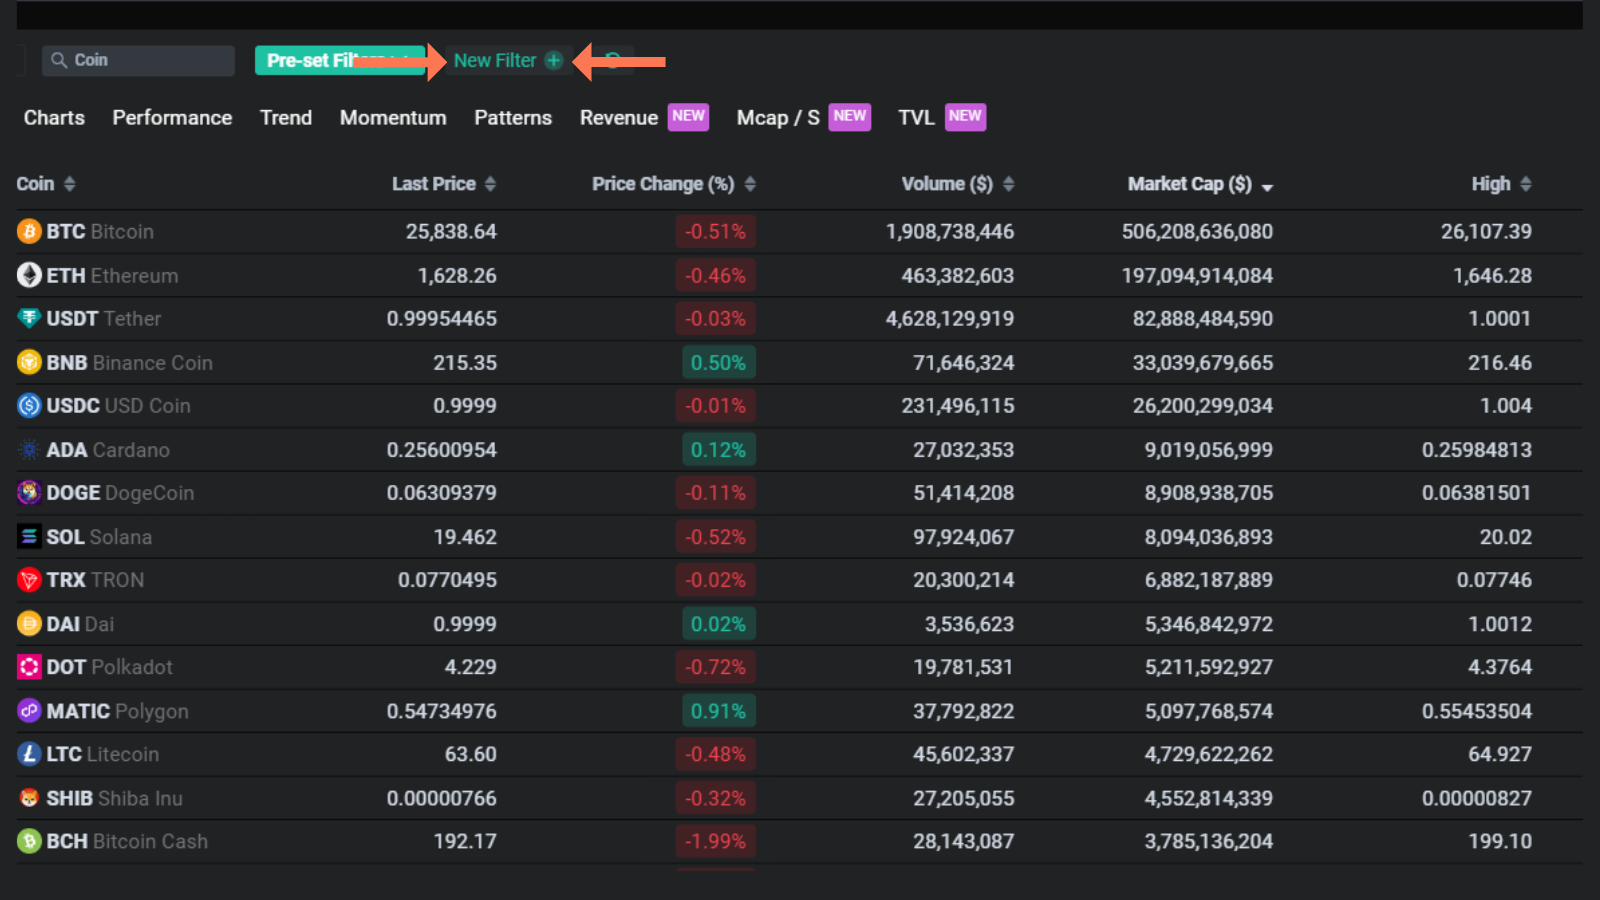
Step 2: Navigate to the Screener and Click to New Filter
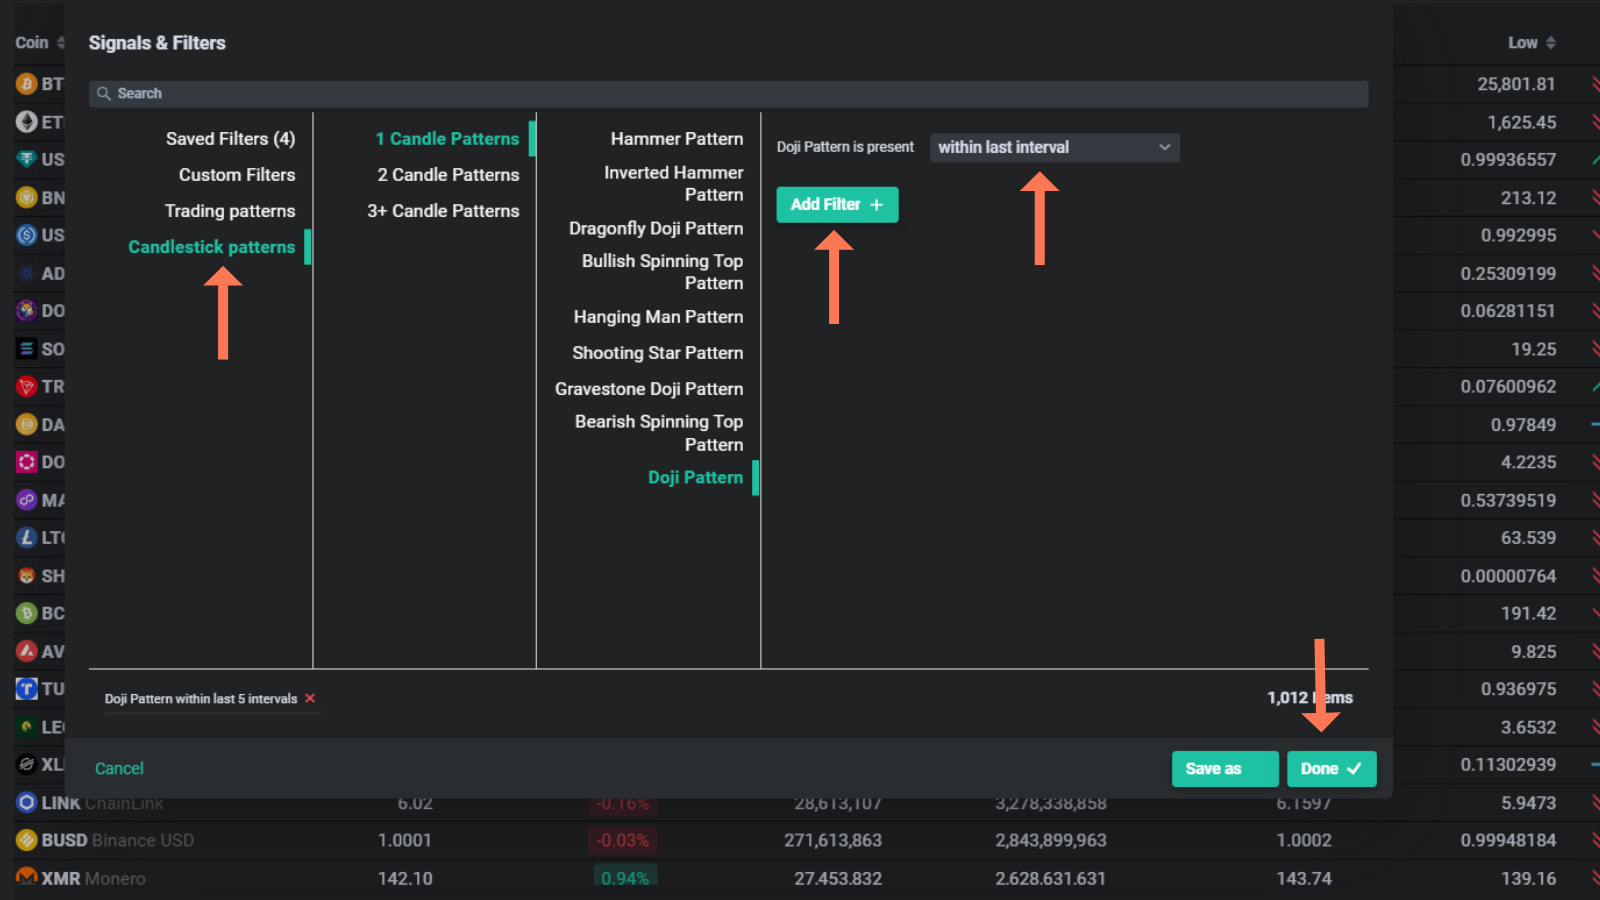
Step 3: Choose Candlestick patterns and Interval. Click to Add Filter and Done buttons.
altFINS Crypto Screener offers a wide range of candlestick patterns to choose from. Select the patterns that align with your trading strategy. For example, you might choose “Bullish Engulfing” and “Hammer” if you’re looking for bullish signals.
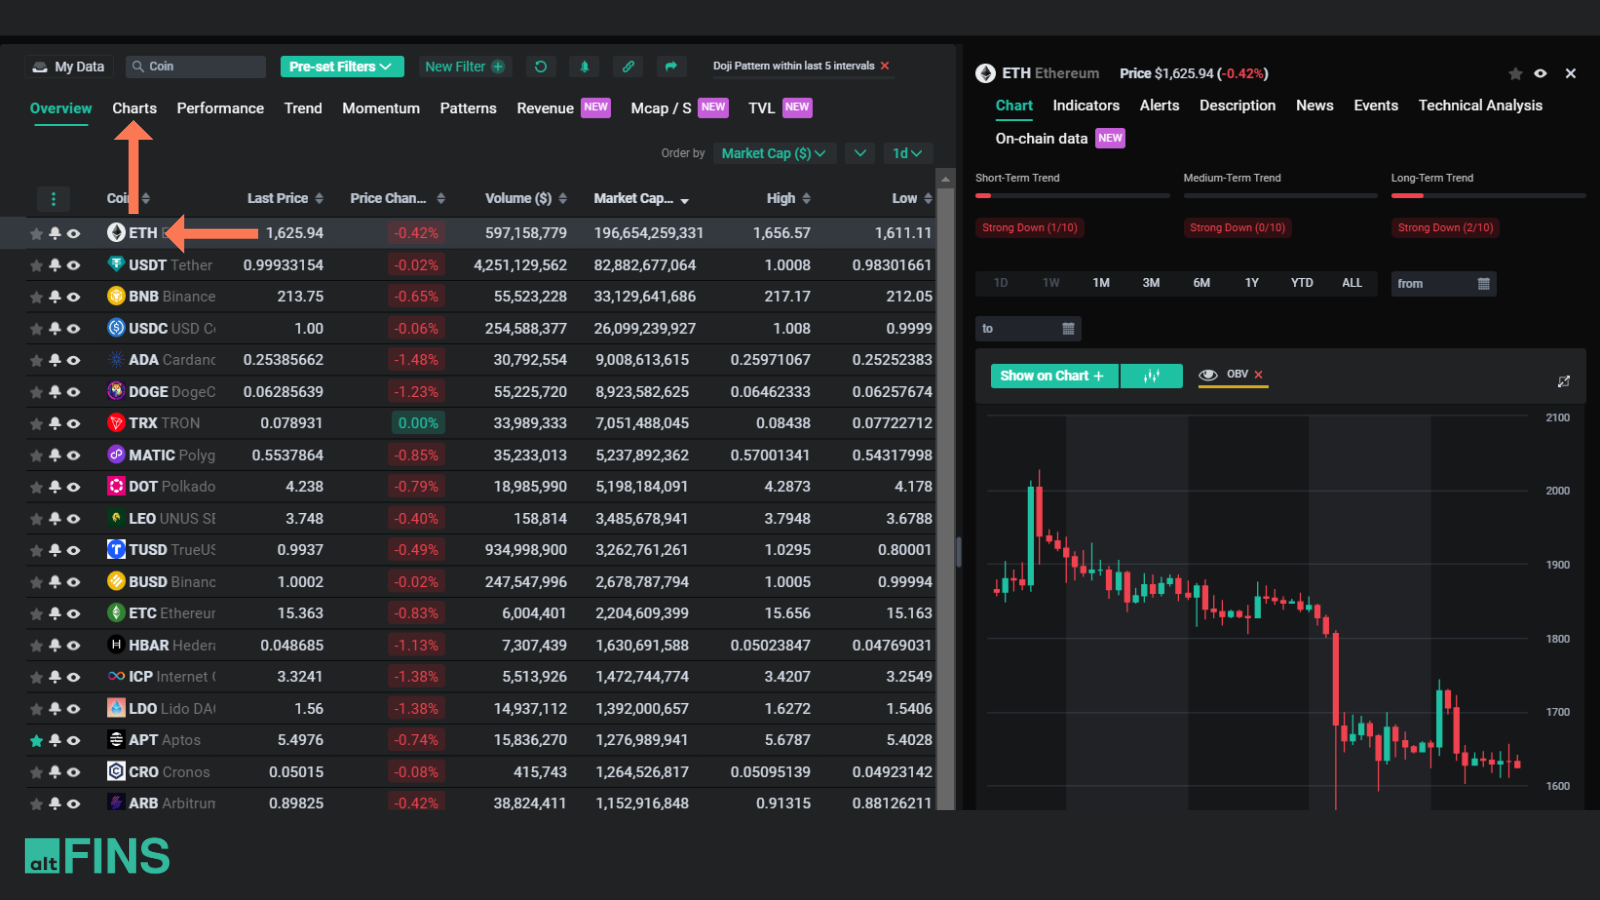
Step 4: Select “Charts” tab or select asset to analyze its chart in Details section.
Step 5: Change chart type to Candlestick
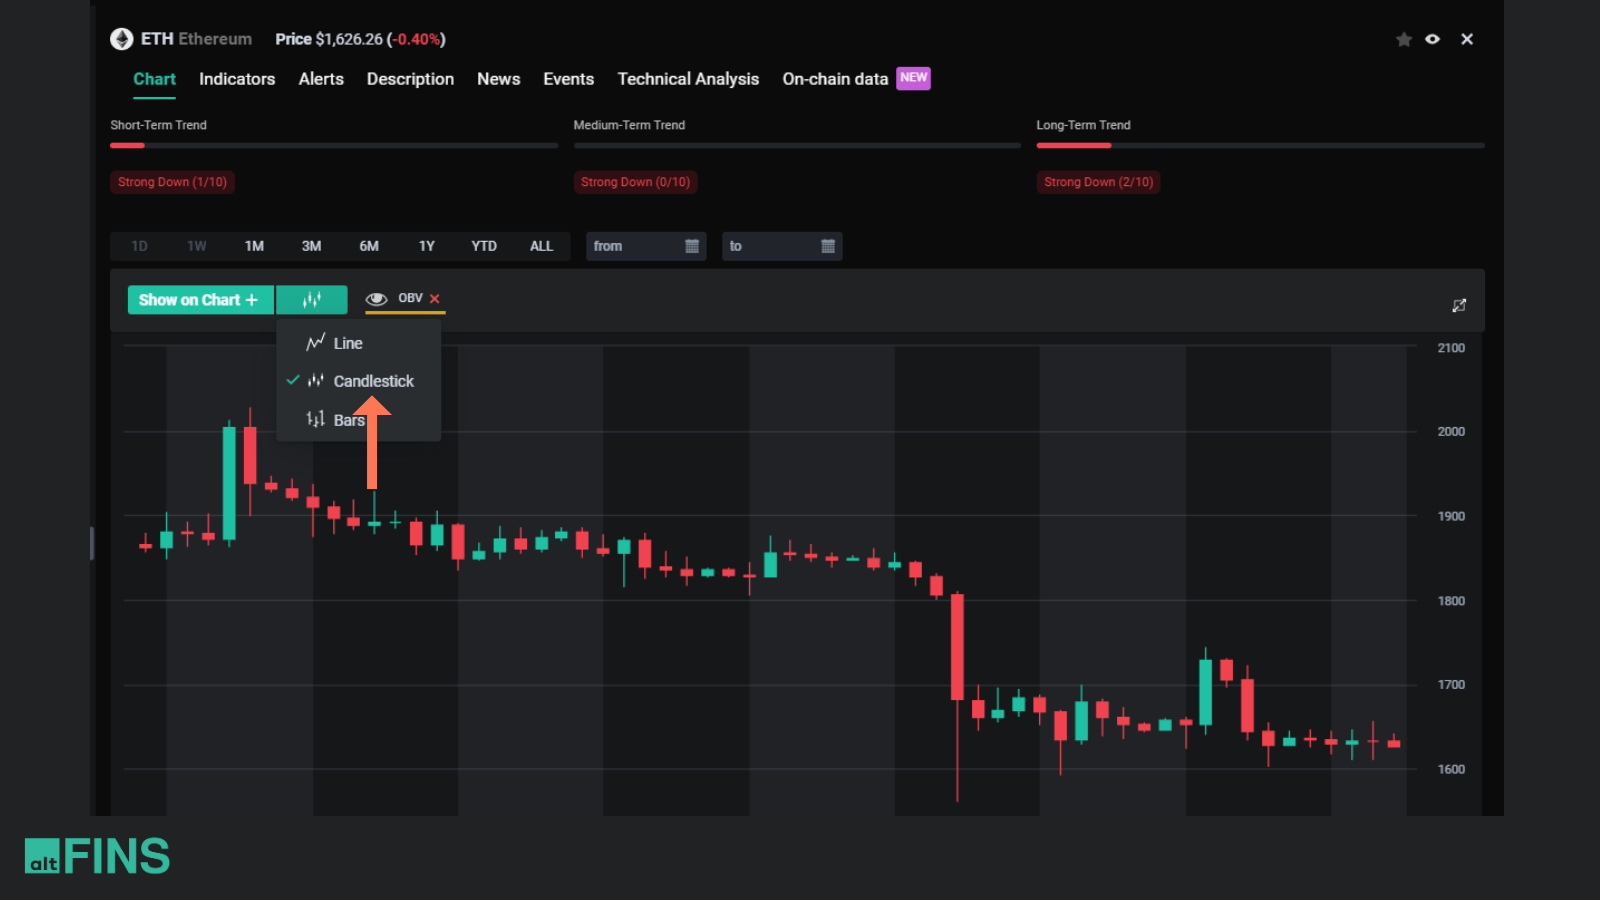
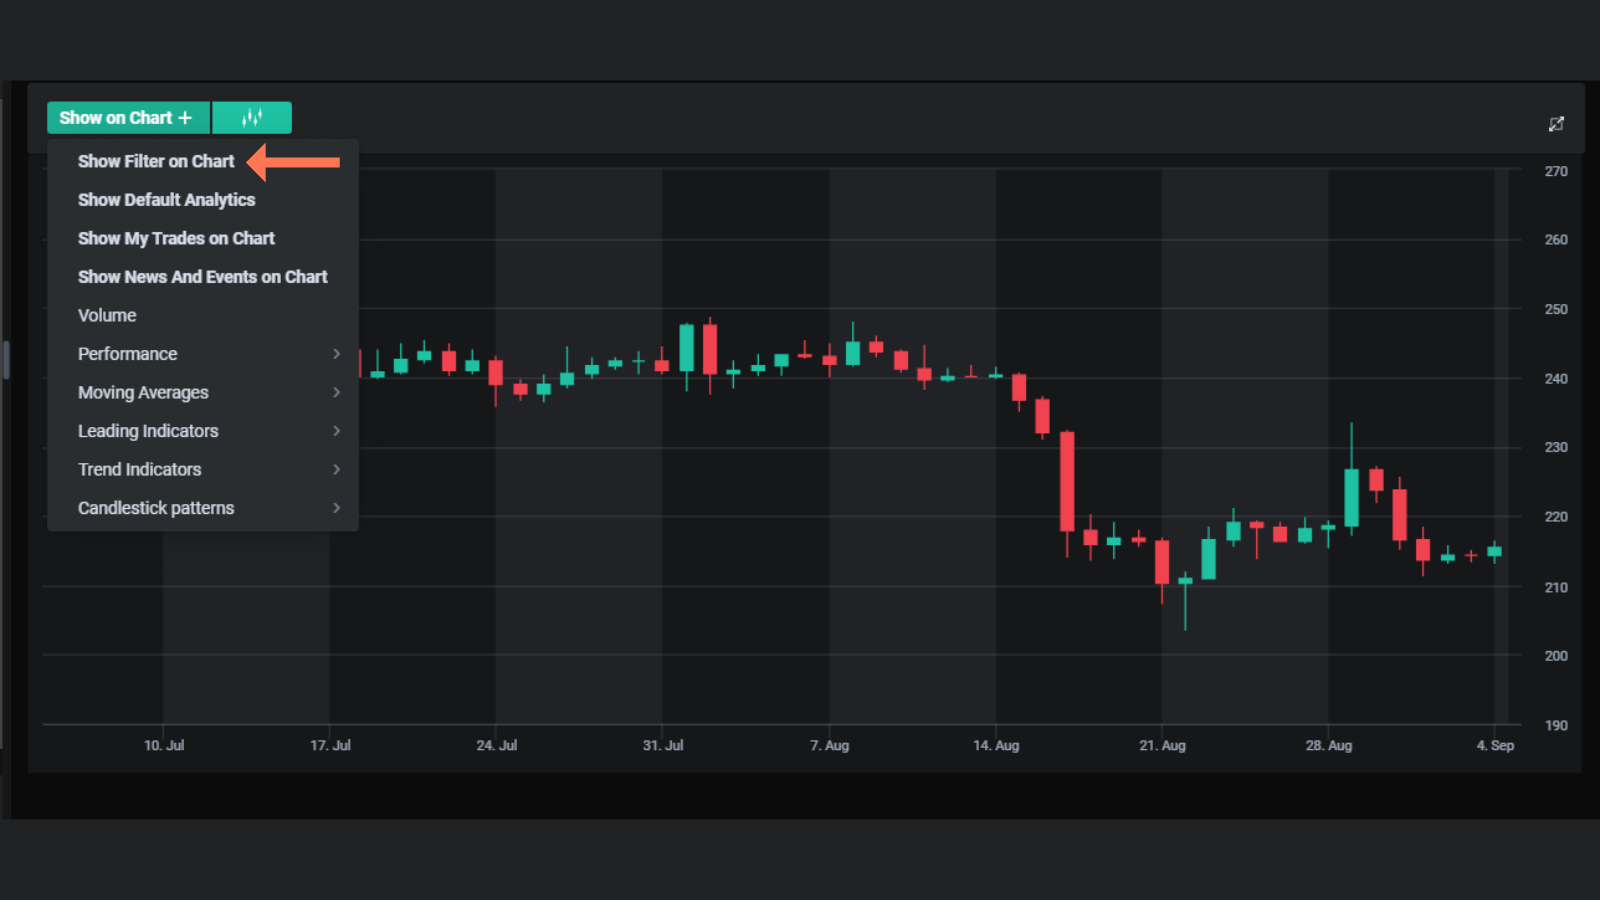
Step 6: Click to Show on Chart button and choose: “Show Filter on Chart” too see selected Candlestick pattern
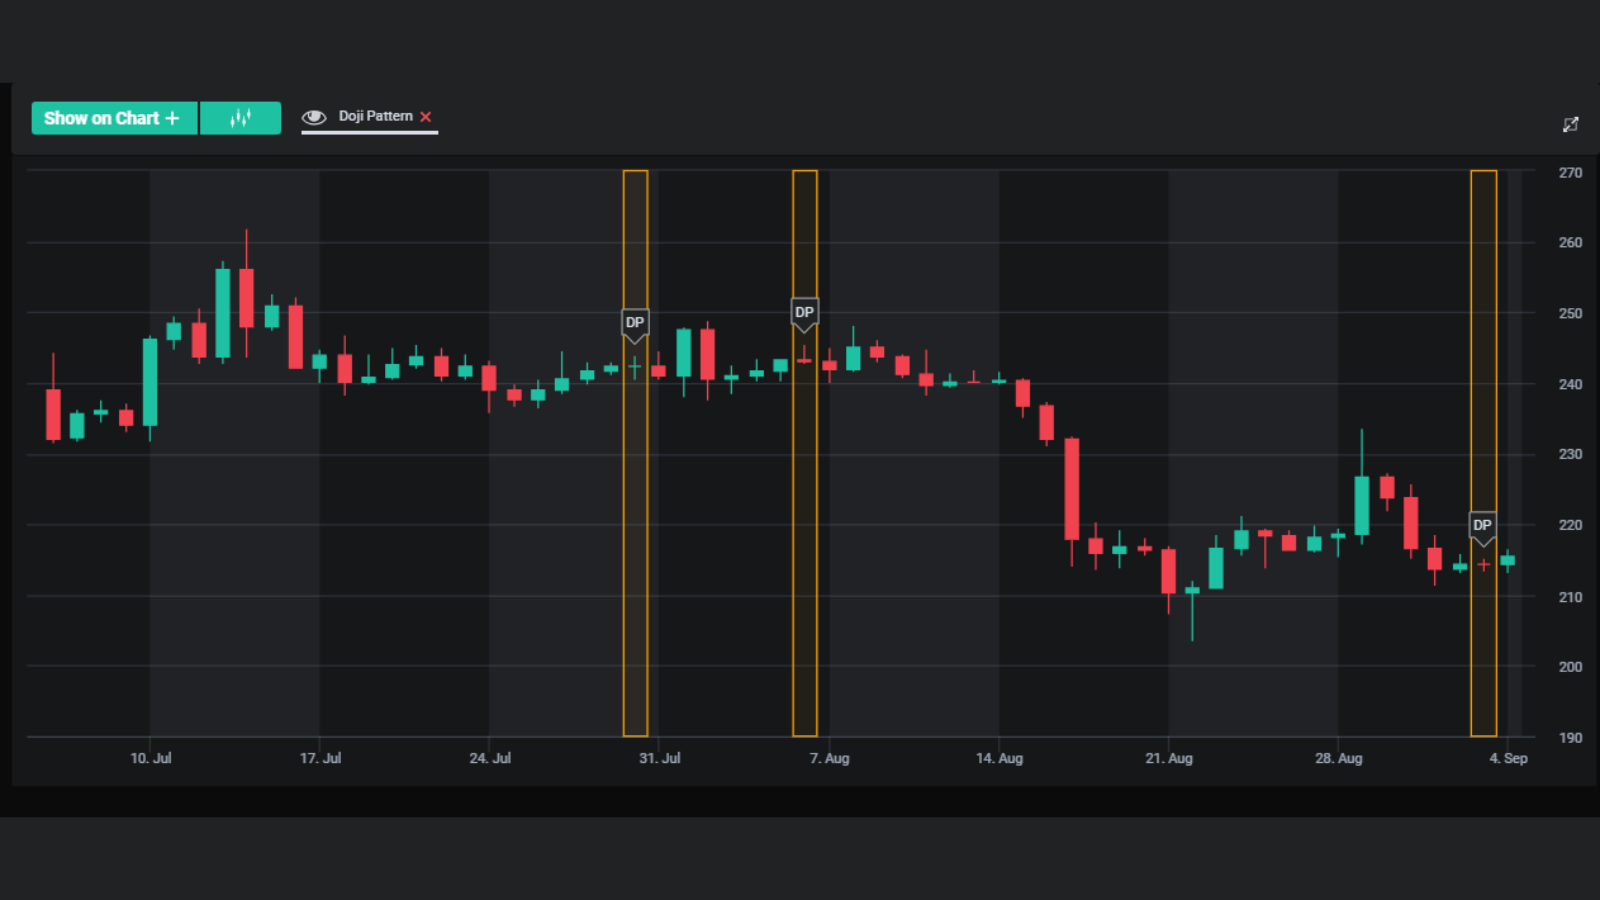
Step 7: Analyze Chart
Review the list of cryptocurrencies that meet your selected candlestick pattern and additional criteria.
Conclusion: Creating a custom filter with candlestick patterns on altFINS Crypto Screener is a valuable tool for traders and investors looking to identify potential opportunities in the cryptocurrency market. By following these steps, you can streamline your analysis and improve your chances of success in the dynamic world of crypto trading. Start using this powerful feature today to enhance your crypto trading strategy.
Do you still have questions regarding Candelstick pattern in crypto trading? Contact us on [email protected] and our team will be happy to help you.
FAQ
Read also an article:
Mastering Candlestick Patterns for Successful Crypto Trading
The Dragonfly Doji Candlestick Pattern
The Hammer Candlestick Pattern
The Inverted Hammer Candlestick Pattern
The Hammer Candlestick Pattern
The Gravestone and Perfect Gravestone Doji Candlestick Patterns
Bullish Engulfing Candlestick Pattern
The Spinning Top Candlestick Pattern
The Hanging Man Candlestick Pattern
What is Candlestick Pattern (source: Investopedia)
