Search Knowledge Base by Keyword
-
Overview
-
Crypto Analytics
-
- Why use it?
- Overview > Charts > Scorecards > Performance > Trend > Oscillators
- Add table columns
- Detail view
- Charts
- Create a Trading Signal or Filter
- Find SMA crossover signals
- Time intervals
- Create an alert
- Extreme Overbought coins Due for a Pullback
- Early momentum detection
- Crypto Trend Changes
- Why use it-coins screener
- Mastering Candlestick Patterns for Successful Crypto Trading
- What Are Fibonacci Retracement Levels?
- Essential Candlestick Patterns for Crypto Traders
- Using Local High to Spot Breakouts
- Oversold in Uptrend
- Strong Uptrend
- Show all articles ( 4 ) Collapse Articles
-
- Overview
- Chart Patterns
- Crypto Chart Patterns Cheat Sheet
- Emerging v. Complete
- Key Horizontal levels
- Consecutive Candles
- Big Movement
- Fibonacci Patterns
- 10 steps for how to trade crypto using Crypto Chart Patterns
- How to trade Channel Down? | Crypto Chart Pattern
- Tutorial: Using Custom Chart Pattern Filters
- How To Set Up Chart Patterns Alerts?
- How To Trade Channel Up Pattern? | Crypto Chart Pattern
- How To Trade Ascending Triangles? | Crypto Chart Pattern
- How To Trade Bullish Flag Pattern? | Crypto Chart Pattern
- How To Trade Sideways Channel pattern? | Crypto Chart Pattern
- How To Trade Rising Wedge pattern? | Crypto Chart Pattern
- How To Trade Falling Wedge pattern? | Crypto Chart Pattern
- How To Trade Descending Triangle pattern? | Crypto Chart Pattern
- How To Trade Inverse Head and Shoulders pattern? | Crypto Chart Pattern
- Show all articles ( 5 ) Collapse Articles
-
- Signals Summary Overview
- How To Find And Trade Pullbacks In Uptrend (Buying Dips)?
- Momentum & Up / Down Trend
- Range in Up/Down Trend
- Momentum
- How to trade EMA 12 / 50 crossovers?
- Moving Average Ribbons
- Strong Up / Down Trend
- Strong Up / Down Trend (Short Term)
- Strong Up / Down Trend (Medium Term)
- Strong Up / Down Trend (Long Term)
- Price / SMA Crossovers In Crypto
- What are Price / EMA Crossovers in crypto?
- SMA Crossovers
- EMA Crossovers
- Unusual Volume Gainers / Decliners
- New Up/Down trend (ADX)
- Bollinger Band - Price Broke Upper / Lower Band
- Strong Up / Down Trend and Oversold / Overbought
- Strong Up / Down Trend and Strong / Weak Ultimate Oscillator
- MACD (12,27,9) Signal Line cross
- MACD (12,27,9) Center Line cross
- Commodity Channel Index cross
- Overall Score of Oscillators (Oversold / Overbought)
- Relative Strength Index (9)
- Relative Strength Index (14)
- Relative Strength Index (25)
- Stochastic RSI Fast (3, 3, 14, 14)
- Williams Percent Range (14)
- Bull Power
- MACD line
- Relative Strength Index (RSI) Divergence: Explained
- How to Trend Trade Crypto
- Early momentum detection
- Short-Medium-Long-Term Trend
- Relative Strength Index
- Uptrend and Fresh Bullish Momentum Inflection
- Using Local High to Spot Breakouts
- Oversold in Uptrend
- Strong Uptrend
- Show all articles ( 25 ) Collapse Articles
-
- Volume
- OBV Divergence Indicator
- SMA vs. EMA
- RSI Divergence and Trading RSI
- Stochastic (14, 3, 3) (STOCH)
- What is CCI 20? (Commodity Channel Index 20)
- ADX
- MACD Line and MACD Signal Line
- Williams %R
- Stochastic RSI Fast
- Bull / Bear Power
- What is the UO: Ultimate Oscillator (7, 14, 28)
- Short Term Trend
- Medium Term Trend
- Long Term Trend
- Oscillator Rating
- Trading Multiple Time Frames
- Support and Resistance
- Polarity principle
- Early momentum detection
- Crypto Trend Changes
- MACD Histogram (H1, H2)
- What Are Fibonacci Retracement Levels?
- Using Local High to Spot Breakouts
- Oversold in Uptrend
- Strong Uptrend
- Show all articles ( 11 ) Collapse Articles
-
-
Trade Crypto
-
- Initiating a trade
- Market vs. Limit order
- Refreshing tables
- Are derivatives such as futures, options and perpetual swaps supported?
- Does altFINS charge trading fees?
- Balances
- Open Orders
- Transaction History
- Order book & Trades
- Connecting to exchanges
- How to trade cryptocurrencies?
- Trading Risk Management
-
-
Research Hub
-
Crypto Education
-
- Where To Buy And Sell Cryptocurrency?
- When Is The Best Time To Buy And Sell Cryptocurrency?
- Crypto Profits: Full Guide How to Take Profits In Cryptocurrency
- What Is Crypto Copy Trading?
- What Is Leverage Trading Cryptocurrency?
- Crypto Arbitrage Trading: Meaning, Signals And Opportunities
- Crypto Hot Wallet vs. Cold Wallet: What is the Difference
- Crypto Trading Strategies
- Difference Between Crypto Fundamental and Technical Analysis
- List of TOP Decentralized Exchanges 2024
-
-
About
-
AFINS Token
- Articles coming soon
OBV Divergence Indicator

What is On-balance volume (OBV)?
On-balance volume (OBV) is a momentum indicator that uses volume flow to predict changes in stock price. It measures the buying or selling pressure. The idea of OBV divergence indicator is that volume precedes price, hence, when volume increases sharply without a significant change in the stock’s price, the price will eventually jump upward, and vice versa.
OBV indicator rises when volume on up days exceeds volume on down days.
OBV divergence indicator can be used to either confirm a price trend or indicate a price reversal.
Trend confirmation. When OBV indicator and price trends are in sync (same direction), then OBV simply confirms the price trend.
Divergences indicate potential reversals. The absolute value of OBV is not important, instead, the trend in OBV vs. trend in price are important to watch. If they divert, it’s a signal. Bullish divergence forms when OBV is rising while the price is flat or declining. This would suggest that the price should begin rising. Bearish divergence forms when OBV is declining while the price is flat or rising.
How is the OBV divergence indicator calculated?
- The OBV is a running total of volume (positive and negative). Calculation steps:
- If today’s closing price is higher than yesterday’s closing price, then: Current OBV = Previous OBV + today’s volume
- If today’s closing price is lower than yesterday’s closing price, then: Current OBV = Previous OBV – today’s volume
- If today’s closing price equals yesterday’s closing price, then: Current OBV = Previous OBV
Examples of OBV:
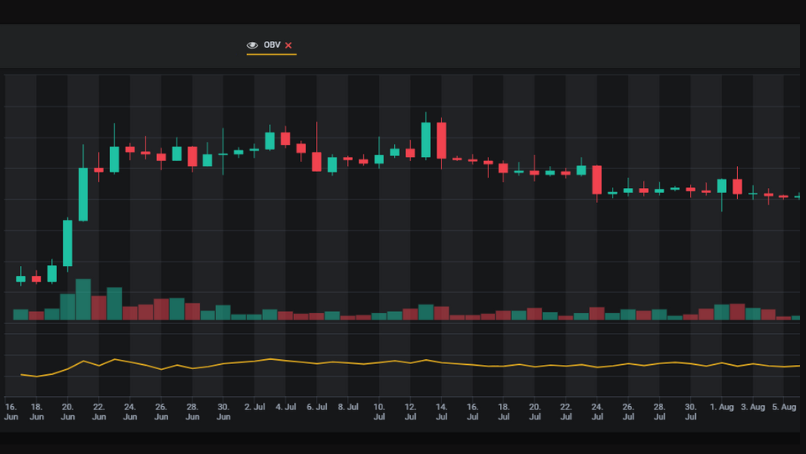
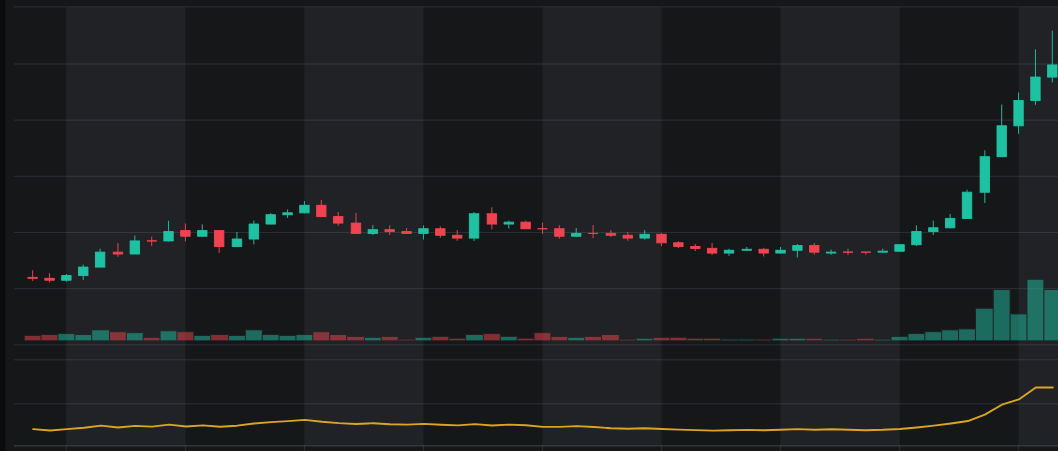
OBV rises when volume on up days exceeds volume on down days. OBV can be used to either confirm a price trend or indicate a price reversal.

Source: altFINS
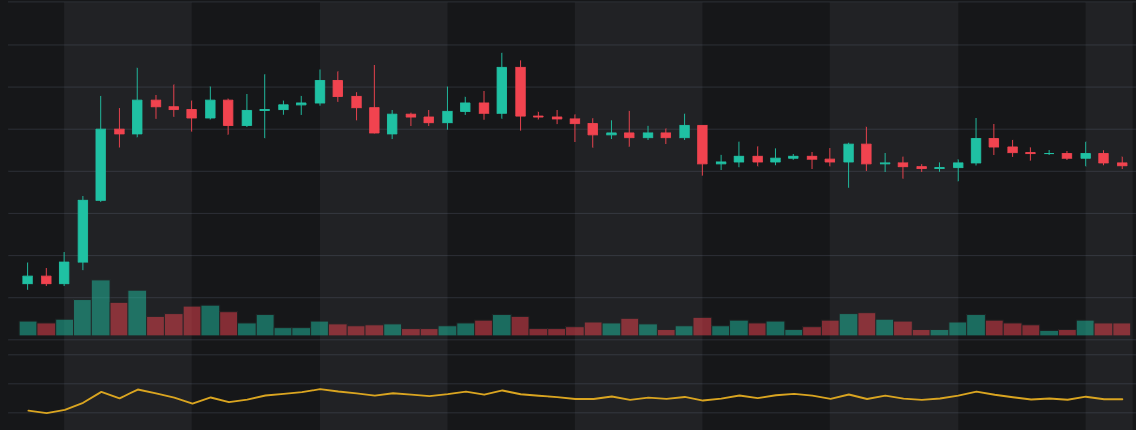
OBV declines when volume on down days exceeds volume on up days.

Source: altFINS
