

Search Knowledge Base by Keyword
Support and Resistance Crypto: The Complete 2026 Guide for Traders
Updated: July 2026 | Crypto Screener | 12 min read
Support and resistance are the two price levels every crypto trader learns first, and the two most traders never learn to read correctly. This guide explains what support and resistance mean in crypto trading, why these levels are critical for spotting breakouts, breakdowns, and reversals, and how they shape overall market structure. You will see real examples using Bitcoin, learn how support and resistance levels form, and understand how traders use them to plan entries, exits, and risk management.
We also show how altFINS automates support and resistance detection across 2,000+ cryptocurrencies, making it possible to scan the entire market and surface high-probability setups in seconds.
Key Takeaways
- Support is a price floor where buying pressure increases.
- Resistance is a price ceiling where selling pressure builds.
- Breakouts above resistance often start new uptrends.
- Breakdowns below support can accelerate selling.
- Strong levels repeat over time because of market psychology.
- Automated detection helps scale analysis across thousands of coins.
What Is Support and Resistance in Crypto?
Support and resistance in crypto are price levels where supply and demand repeatedly cause price reversals or breakouts. Support is a price floor where buying pressure increases, while resistance is a ceiling where selling pressure builds.
These are core technical analysis concepts that help traders understand where crypto prices are likely to pause, reverse, or break out. Support acts like a safety net where buying interest increases and prevents further decline, while resistance functions as a ceiling that limits upward movement. These levels reflect market psychology and often repeat over time, which makes them powerful tools for identifying entry points, profit targets, and risk management zones.
These levels help traders:
- Identify high-probability entry points
- Set stop-loss levels
- Define profit targets
- Anticipate breakouts and trend reversals
In volatile crypto markets, support and resistance levels often determine the next major move.
Example: Support and Resistance Levels for Bitcoin
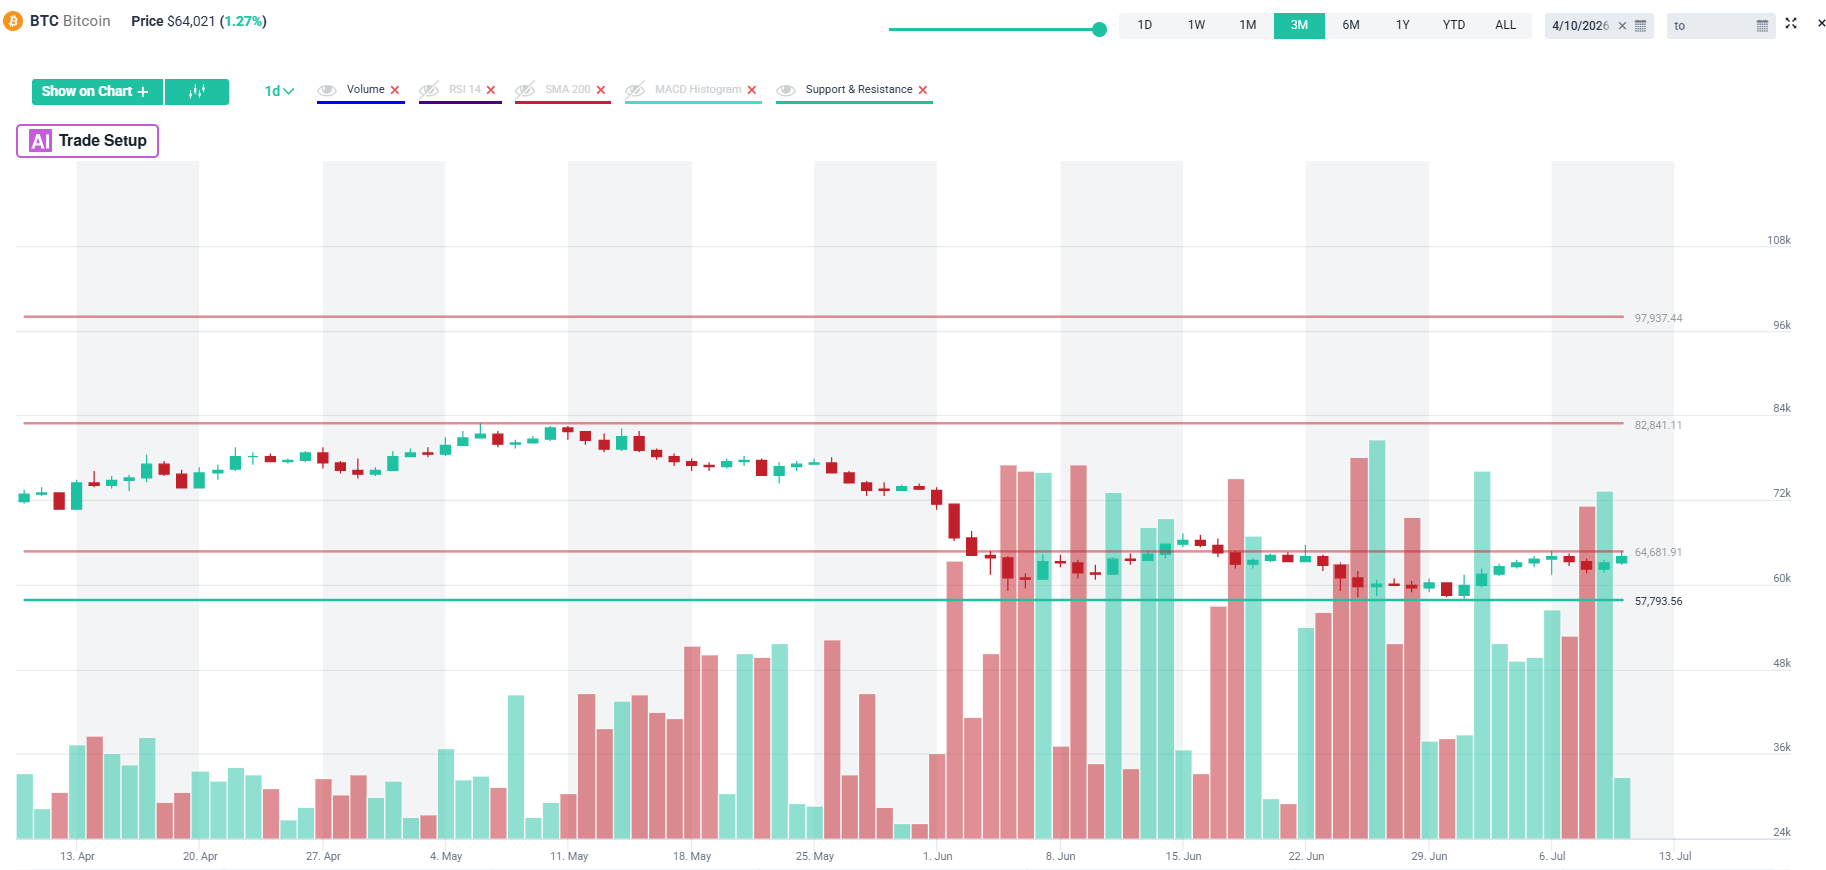
On the altFINS Bitcoin chart, BTC is trading around $63,300 today (July 10, 2026), so the Bitcoin example now reads: Immediate support at $61,900–$62,000, with a deeper psychological floor at $58,000–$60,000 (repeatedly defended since this year’s correction). Resistance is a tight cluster at $65,500–$65,800 (50-day EMA + daily Bollinger upper band), with the next breakout zone at $68,000–$70,000. Further out, the major overhead levels are the prior cycle highs near $109,400 (January 2025) and $126,200 (October 2025 all-time high).
In simple terms, support is where price tends to stop falling and bounce, and resistance is where it tends to stop rising and pull back. These levels matter because they help traders decide where to buy, sell, and set stop-losses, and they help traders anticipate breakouts or breakdowns. If BTC breaks above resistance it can trigger a new upward move, and if it falls below support it can lead to faster downside momentum.
Why Support and Resistance Are Critical in Crypto Trading
Crypto markets differ from traditional markets because they:
- Trade 24/7
- Have higher volatility
- Include thousands of tradable assets
- Are driven heavily by retail psychology
Because of this, crypto support levels and resistance levels act as liquidity zones where large buy and sell orders cluster. When price reaches these zones, one of two things happens: price rejects the level and bounces, or price breaks the level and continues. Both scenarios create trading opportunities.
How Crypto Support Levels Form
Crypto support forms when:
- Price repeatedly bounces from a zone
- Large buyers defend a level
- Volume spikes at price lows
- Psychological round numbers attract orders, for example $60,000 BTC
The more times price respects a support level, the stronger it becomes.
Example: If Bitcoin repeatedly bounces near $65,000, traders begin placing buy orders there, which reinforces the level.
How Crypto Resistance Levels Form
Resistance develops when:
- Price fails multiple times at a zone
- Sellers unload positions
- Early buyers take profits
- Overhead supply increases
Strong resistance zones often trigger sharp rejections, unless momentum breaks through.
Types of Support and Resistance in Crypto
Support and resistance can appear on any timeframe, from a 15-minute chart to a weekly chart. Multi-timeframe crypto support and resistance levels are significantly stronger than intraday levels alone, since they represent zones where buyers and sellers have reacted repeatedly across different trading horizons, not just a single session.
The Problem With Manual Support and Resistance Analysis
Most traders draw levels manually. This creates real problems:
- Subjective bias
- Time-consuming chart scanning
- Inconsistent level strength
- Impossible to scale across 2,000+ coins
Manual methods work for a handful of charts, but not for full market coverage.
Why Automation Matters in 2026
Crypto markets trade 24/7 across thousands of assets. Manually drawing levels is time-consuming and subjective. Automated detection removes bias, scales across 2,000+ coins, and integrates with alerts, which helps traders react faster to breakout and breakdown setups. Learn more about automated detection.
Automated Support and Resistance in Crypto: The altFINS Approach
To solve the scalability and bias problem, altFINS built Automated Support & Resistance Detection for crypto markets. Watch video:
How It Works
- Scans historical swing highs and lows
- Clusters price reactions
- Scores level strength
- Maps levels across multiple timeframes
- Integrates directly into screeners and alerts
What This Unlocks for Traders
- Filter coins approaching resistance
- Detect breakout candidates instantly
- Monitor pullbacks efficiently
- Receive real-time alerts
Instead of manually drawing lines, traders can analyze the entire crypto market in seconds.
Manual vs. Automated Crypto Support and Resistance
| Factor | Manual Analysis | Automated Detection (altFINS) |
|---|---|---|
| Bias | Subjective, trader-dependent | Objective, rules-based scoring |
| Speed | Minutes per chart | Entire market scanned in seconds |
| Coverage | A handful of coins at a time | 2,000+ cryptocurrencies |
| Timeframes | Usually one at a time | Mapped across 5 timeframes simultaneously |
| Alerts | None, requires constant monitoring | Real-time breakout and breakdown alerts |
How to Find Support and Resistance on altFINS
altFINS provides Automated Support & Resistance detection across 2,000+ cryptocurrencies and 5 timeframes, fully integrated into charts, screeners, and alerts. Instead of manually drawing lines, traders can instantly identify statistically significant support and resistance levels across the entire crypto market.
You can access automated Support & Resistance levels in five places:
- Crypto Screener → Charts Tab. View automatically plotted support and resistance levels directly on price charts. Open the Crypto Screener →
- Individual coin detail pages. See key structural levels alongside trend ratings, RSI, MACD, and volume indicators.
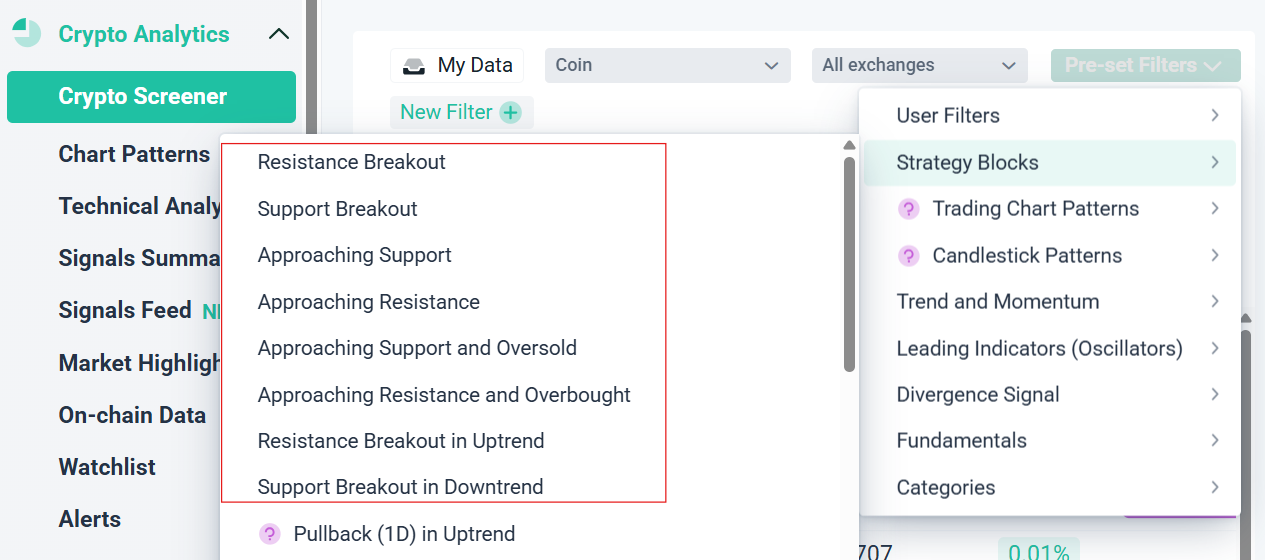
- Crypto Screener → Pre-set Filters → Strategy Blocks → Support & Resistance. Use ready-made scans designed specifically around structural price levels. Browse the screener →
- Signals Summary. Monitor breakout and breakdown activity across the market in real time. Open Signals Summary →
- Signals Feed. Track newly triggered support and resistance events as they happen. Open Signals Feed →
This allows traders to monitor structural price levels at scale, without manual chart scanning.
6 Preset Market Scans Based on Support and Resistance
To make support and resistance actionable, altFINS built six dedicated preset scans designed to surface high-probability setups instantly. These scans eliminate guesswork and dramatically reduce research time.
1. Resistance Breakout
What it finds: Coins breaking above a key resistance level.
Why it matters: A breakout above resistance often signals the start of a new upward trend, especially when confirmed by strong volume and momentum.
Best used with: Trend Rating plus volume expansion. View live scan results →
2. Support Breakout (Breakdown)
What it finds: Coins breaking below a key support level.
Why it matters: When support fails, selling pressure can accelerate quickly. This scan helps identify downside continuation risk or potential short setups.
Best used with: Bearish MACD crossover plus a weak trend rating. View live scan results →
3. Approaching Support
What it finds: Coins trading close to an identified support level.
Why it matters: Support zones often act as bounce areas. Traders monitor these levels for potential reversal entries with defined risk.
Best used with: Oversold RSI plus bullish divergence. View live scan results →
4. Approaching Resistance
What it finds: Coins trading near a key resistance level.
Why it matters: Resistance can act as a price ceiling. Traders watch for either breakout confirmation or pullback setups.
Best used with: Trend continuation plus increasing volume. View live scan results →
5. Approaching Support + Oversold
What it finds: Coins near structural support while momentum indicators, such as RSI, show oversold conditions.
Why it matters: This dual confirmation increases the probability of a technical bounce, since both price structure and momentum align.
Best used for: High-probability mean reversion setups. View live scan results →
6. Approaching Resistance + Overbought
What it finds: Coins near resistance while momentum indicators show overbought conditions.
Why it matters: This setup highlights potential exhaustion near key resistance levels, signaling an increased probability of a pullback or rejection.
Best used for: Fade trades or breakdown monitoring. View live scan results →
Combining Support and Resistance With Momentum
Support and resistance levels are most powerful when combined with trend and momentum indicators. For example:
- Resistance breakout plus a strong Trend Rating suggests a potential continuation move.
- Support hold plus bullish RSI divergence suggests a possible reversal.
- Breakdown below support plus a bearish MACD crossover confirms weakness.
By combining structural price levels with momentum signals, traders filter out low-quality setups and focus on higher-probability opportunities.
Why This Matters for Crypto Traders in 2026
Crypto markets move fast. Breakouts and breakdowns often happen within hours. Automated support and resistance allows traders to:
- Identify breakout candidates instantly
- Detect breakdown risks early
- Monitor pullback zones efficiently
- Set alerts before major volatility events
- Scale analysis across 2,000+ coins
Instead of manually scanning charts coin by coin, altFINS surfaces structural market opportunities in seconds.
Common Mistakes Traders Make
- Treating levels as exact lines instead of zones
- Ignoring higher timeframes
- Trading every touch without confirmation
- Ignoring volume and momentum
- Drawing too many levels
Keep Learning
To deepen your understanding of support and resistance in crypto trading, explore the altFINS Trading Course, where you will learn step-by-step technical analysis strategies, breakout trading setups, and risk management principles.
You can also explore the altFINS Blog and Knowledge Base articles on support and resistance.
Frequently Asked Questions About Support and Resistance
What is support in crypto trading?
Support is a price level or zone where buying pressure has historically been strong enough to stop the price from falling further. When price approaches support, it often slows down, stabilizes, or bounces upward.
What is resistance in crypto trading?
Resistance is a price level or zone where selling pressure has historically prevented the price from rising further. When price approaches resistance, it may stall, pull back, or reverse downward.
Do support and resistance levels work in crypto?
Yes. Crypto markets are heavily influenced by trader psychology and liquidity concentration, which causes prices to repeatedly react at key levels. Support and resistance help traders identify potential bounces, rejections, breakouts, and breakdowns.
What is a breakout in crypto?
A breakout occurs when price moves above a resistance level and holds, often with strong volume or momentum confirmation. Breakouts can signal the start or continuation of an upward trend.
What is a breakdown in crypto?
A breakdown happens when price falls below a support level and holds. This often signals increasing selling pressure and may lead to further downside movement.
Why are support and resistance important?
Support and resistance help traders identify entry and exit points, set stop-loss levels, define profit targets, and manage risk. They also provide insight into market structure and trend direction.
Questions About Support & Resistance on altFINS
How does altFINS detect support and resistance levels?
altFINS uses proprietary algorithms to identify statistically significant support and resistance zones by analyzing historical swing highs and lows, clustering repeated price reactions, and ranking level strength across multiple timeframes.
How many cryptocurrencies does altFINS cover?
Automated Support & Resistance detection is available across 2,000+ cryptocurrencies and multiple timeframes, allowing traders to scale their analysis beyond just a few charts.
Where can I find support and resistance levels on altFINS?
You can view automated levels directly on charts within the Crypto Screener, on individual coin pages, and through preset Strategy Blocks focused on support and resistance. These levels are also integrated into Signals Summary and Signals Feed.
Can I scan for breakout and breakdown setups on altFINS?
Yes. altFINS offers preset market scans such as Resistance Breakout, Support Breakdown, Approaching Support, and Approaching Resistance. These filters help traders instantly surface high-probability setups.
Can I set alerts for support and resistance events?
Yes. Traders can set alerts via the web platform, email, or mobile app to be notified when price approaches, tests, or breaks key support or resistance levels.
Why is automated support and resistance useful?
Automation removes subjectivity, saves time, and lets traders monitor structural levels across the entire crypto market. Instead of manually drawing lines, traders can rely on objective, data-driven detection integrated with trend and momentum indicators.
