Search Knowledge Base by Keyword
On-chain data in crypto What Are Crypto On-Chain Data?
On-chain data is the publicly accessible information about transactions that have taken place on a blockchain network. This data includes everything that makes up a blockchain, such as blocks, transaction histories, and addresses. By understanding crypto on-chain data, you can gain insights into how a blockchain works and how it is being used.
On-chain data is useful for a variety of purposes. For example, it can be used to track the flow of funds on a blockchain, understand which addresses are active, and see how much activity is taking place on a particular blockchain. Additionally, on-chain data can be used to assess the health of a blockchain network and identify trends over time.
When transactions are validated, the transaction data is permanently stored in the digital ledger and cannot be changed. As a result, the publicly accessible data is trustworthy and accurate, making it useful for creating dapps and other Web3 initiatives. Various forms of data, including wallet addresses, block timestamps, miner fees, transfer amounts, smart contract code, and much more, are typically accessible.
To sum up, on-chain crypto data is essentially the information about transactions, blocks, and smart contracts on a blockchain network that is made publicly available. These transactions are made possible through a network, thus there is an irrevocable record of every transaction.
Off-Chain Data vs. On-Chain Data
Comparing on-chain data to off-chain data is quite helpful in understanding on-chain data completely. Off-chain data is information that is not stored on a blockchain network, to put it simply. As a result, this more conventional data are stored in standard databases and servers.
On-Chain Data on altFINS
Crypto investors can now scan and analyze hundreds of projects based on their Revenues and Total Value Locked (TVL), as well as valuation ratios such as Market Cap to Revenue and Market Cap to TVL.
Revenue and TVL metrics can help crypto investors find projects with real products and value proposition that gain widescale traction and avoid crypto projects that are just “hot air” scams or failures.
You can find this content under the On-Chain data section.
The new on-chain analytics include:
1) Total Revenue
2) Market Cap to Total Revenue
3) Protocol Revenue
4) Market Cap to Protocol Revenue
5) Total Value Locked or TVL
6) Market Cap to TVL
This video will showcase the latest improvements to our platform, specifically the addition of On-Chain data.
altFINS offers a review of key On-chain data like Total Revenue, Protocol Revenue, Market Capitalization / Total Revenue ratio (Mcap/TR), Market Capitalization / Protocol Revenue Ratio (Mcap/PR) and Total Value Locked (TVL).
In altFINS crypto screener see the performance of key fundamental indicators over time: Revenue, Mcap / S, TVL:
Revenue tab shows the amount of revenue a crypto project makes. Total Revenue is a sum of a supply-side Revenue and Protocol Revenue. Supply-side revenue refers to transaction fees that are allotted to validators in case of Proof-of-Stake Protocol projects, while Protocol Revenue indicates the amount of Revenue that belongs to the Token Project. The tab includes also Annualized Revenue values as well as performance changes in the value for 7D and 30D periods.
Get valuable on-chain data on altFINS
On-chain data: Total Revenue
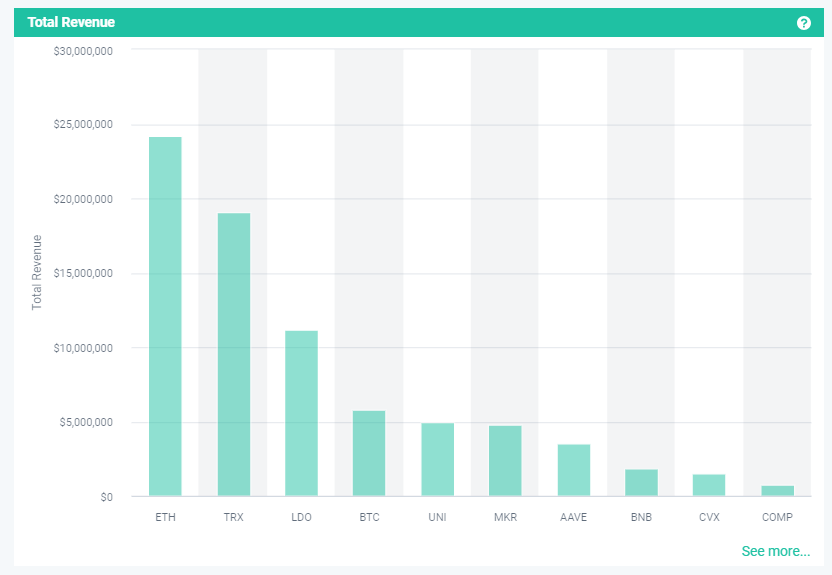
Total Revenue represents total fees paid to the protocol’s treasury and supply-side. It represents the total sum of user fees that the platform has received and includes total fees that go to the supply-side and to the protocol’s treasury. See current results in altFINS crypto screener here.
On-chain data: Protocol Revenue
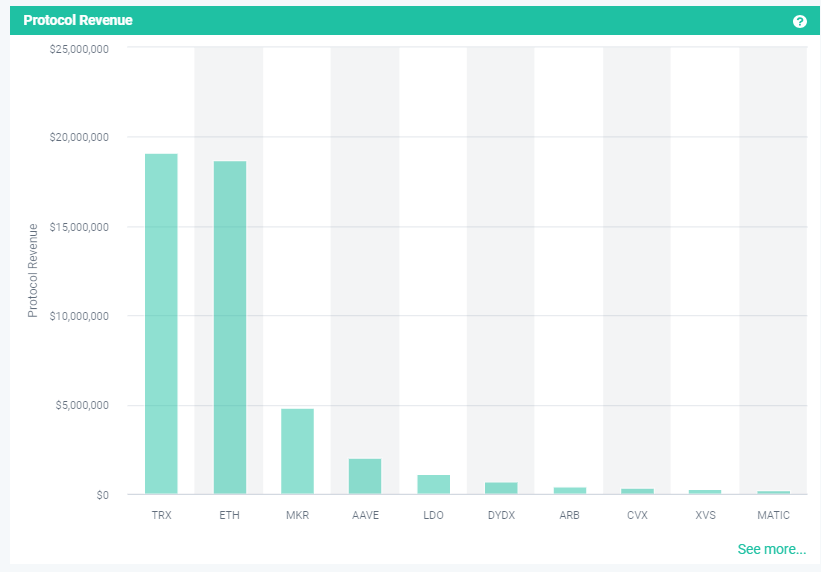
Share of fees that goes only to the protocol’s treasury or directly to its token holders through a burn mechanism, which is similar to a stock buyback because it decreases the amount of tokens in circulation. See current results in altFINS crypto screener here.
On-chain data: Market Cap / TR
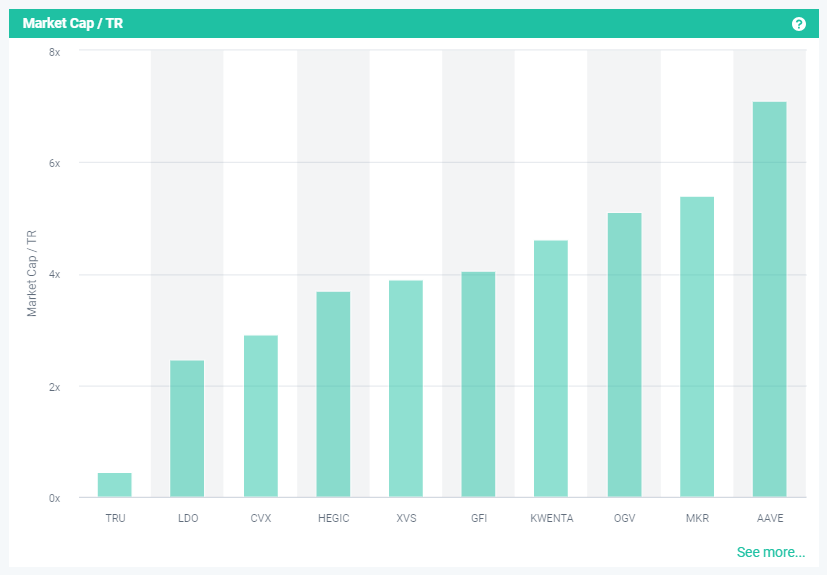
Mcap/TR, also known as Price-to-Revenue Ratio, is a financial indicator that takes into account a crypto project’s market capitalization as well as its total revenue for the previous 12 months. Because it shows undervaluation because the market capitalization does not reflect the strength of the company’s revenues, the lower the ratio, the more appealing the investment is. See current results in altFINS crypto screener here.
On-chain data: Mcap/PR
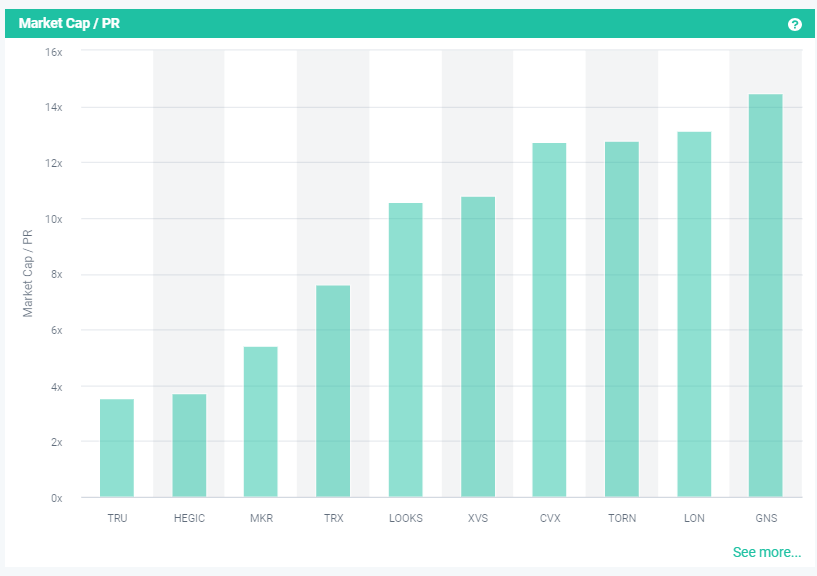
Mcap/PR, often known as Price-to-Revenue Ratio, is a financial indicator that takes into account both a crypto project’s market capitalization and its Protocol Revenue for the previous 12 months. Because it shows undervaluation because the market capitalization does not reflect the strength of the company’s revenues, the lower the ratio, the more appealing the investment is. See current results in altFINS crypto screener here.
On-chain data: Market Cap/TVL
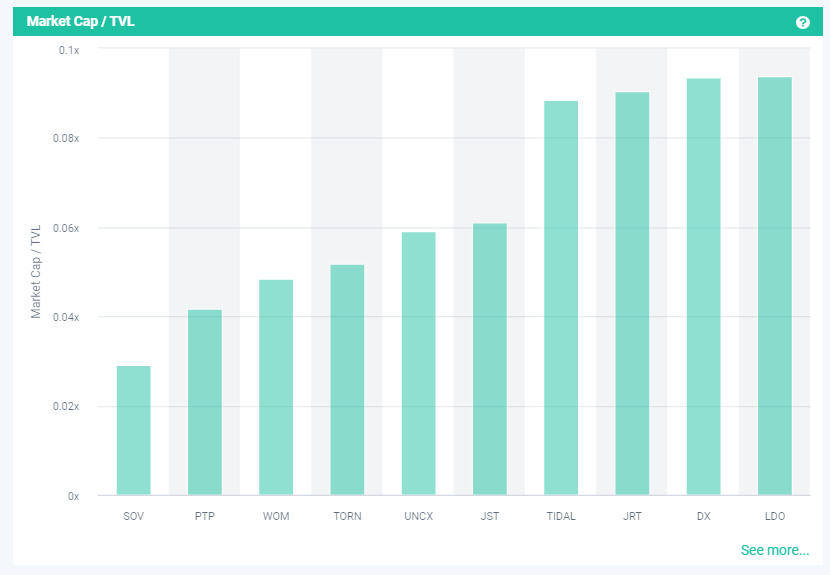
Market Cap/TVL is the project’s market capitalization divided by the total value locked. When the ratio is below 1.0, the crypto coin is undervalued, and when it is above 1.0, the project is now overvalued. See current results in altFINS crypto screener here.
On-chain data: Total Value Locked (TVL)
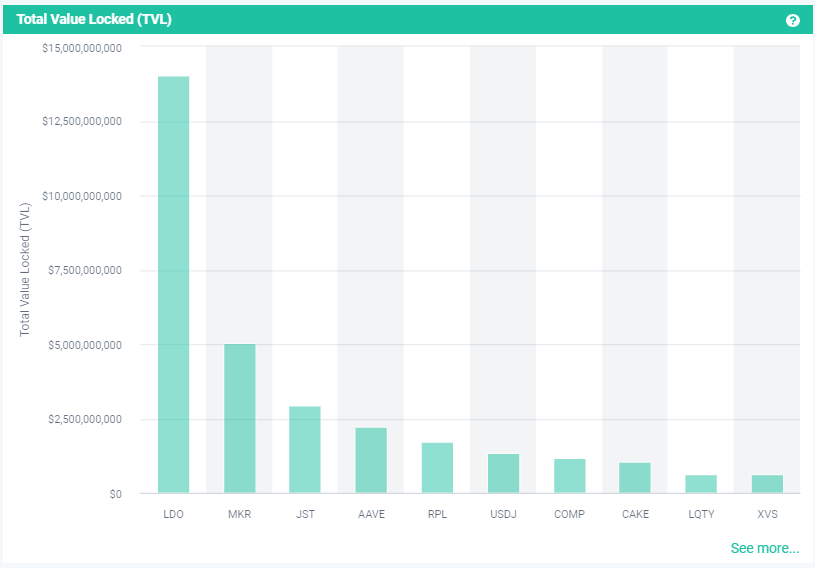
Total Value Locked (TVL): The amount of money invested in the smart contracts of the Protocol. Crypto investors can observe how much value people are prepared to lock up in a project’s smart contract and how well-rounded a crypto project is as a whole. People are more confident in the project as the TVL rises. See current results in altFINS crypto screener here.
Interactive graph to compare the competitors in the segment
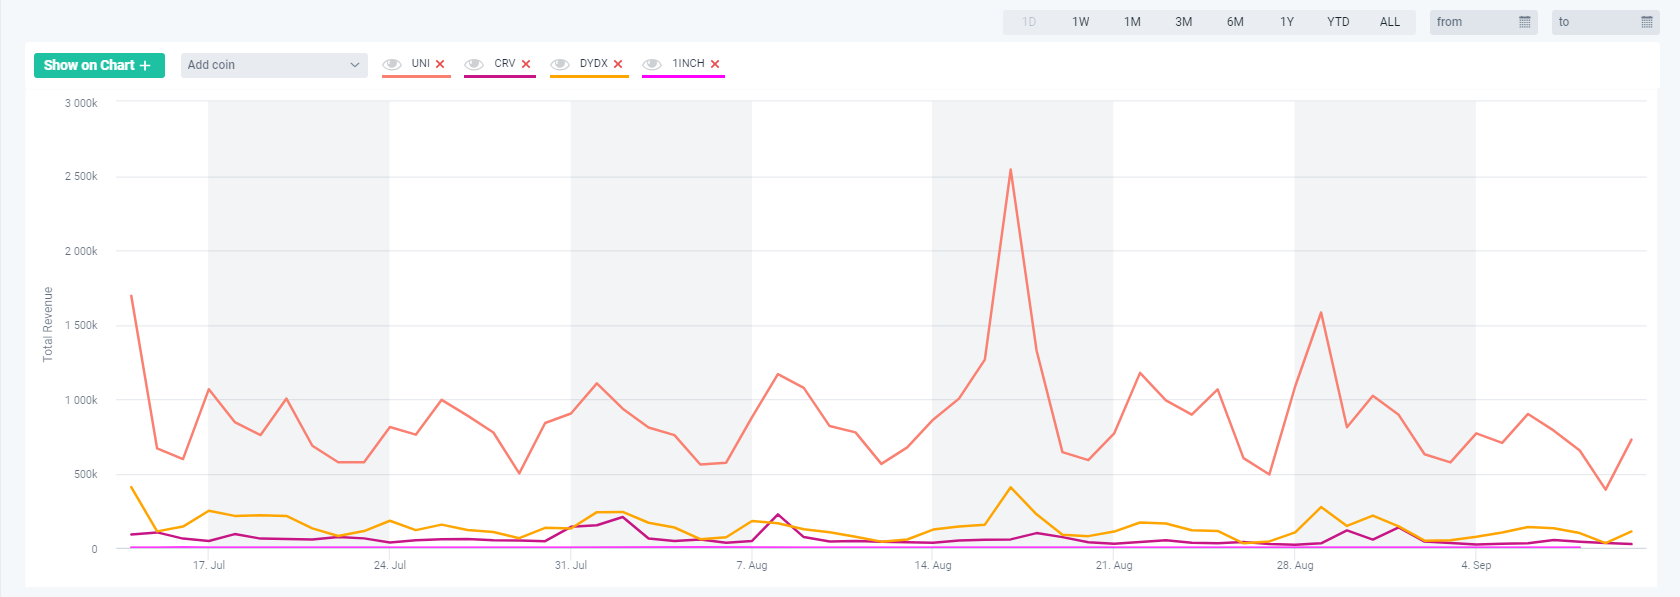
In this graph, you can also compare trends across multiple DeFi crypto projects. You can select which on-chain metric you want to use and select which projects to compare. For example, in the DEX sector, we can compare revenue across multiple DEX competitors: UNI, DYDX, OSMO, 1NCH and let’s add SUSHI. You can also hide them. You can also change the time horizon of the graph.
The tables below show Weekly gainers and Weekly losers
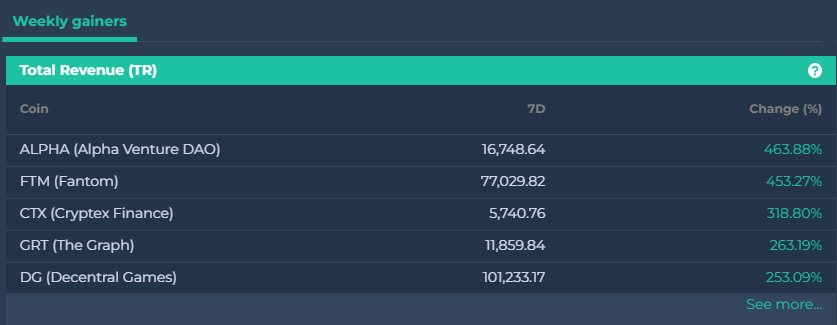
Weekly gainers – Total Revenue (TR)
Total Revenue (TR) a 7-day change in Total Revenue (TR), which is a sum of the Supply-side and Protocol Revenue. It is the total amount the platform collects from users in fees. Example of supply side revenues are fees generated by liquidity providers (LPs). Example of protocol revenues are commission fees paid by users for trading on DEX like Uniswap.
Today’s weekly gainers.
Weekly losers – Total Revenue (TR)
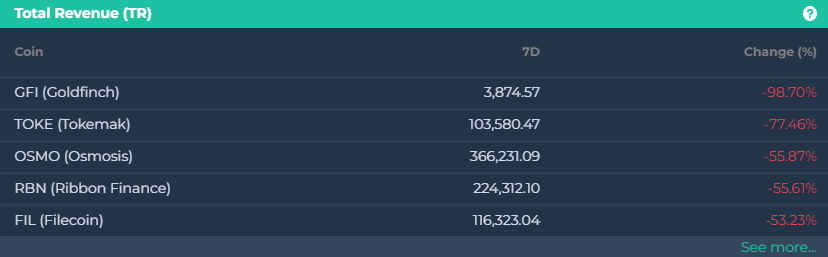
Today’s weekly losers.
Weekly gainers – Market Cap / TR
Mcap/TR: a seven-day shift in the Price-to-Revenue Ratio, a financial indicator that takes into account both a project’s market capitalization and its Total Revenue over the previous twelve months. Because it shows undervaluation because the market capitalization does not reflect the strength of the company’s revenues, the lower the ratio, the more appealing the investment is.
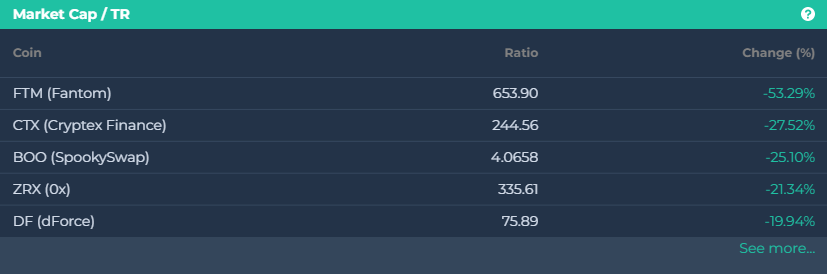
Today’s weekly gainers.
Weekly losers- Market Cap / TR
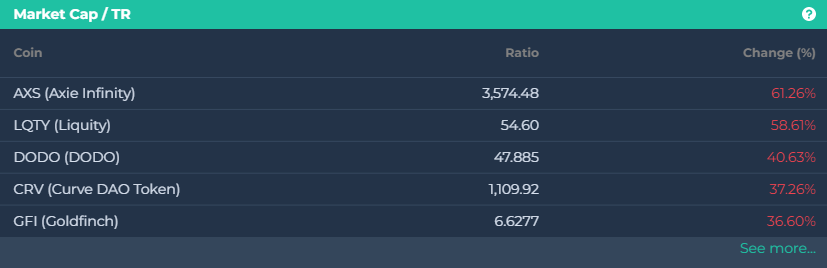
Today’s weekly losers.
Weekly gainers – Protocol Revenue
Protocol Revenue (PR) is a share of fees that solely goes to the protocol’s treasury or directly to its token holders through a burn mechanism, which is comparable to a stock buyback because it reduces the number of tokens in circulation. PR is changed every seven days.
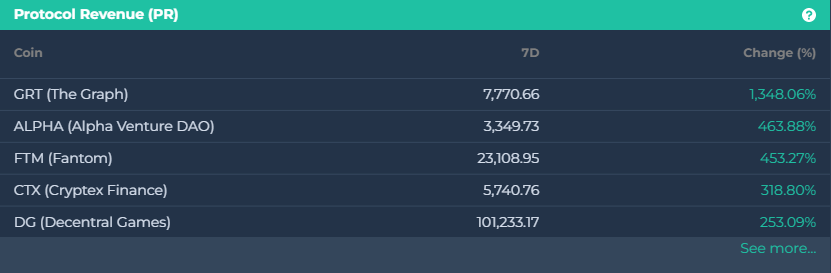
Today’s weekly gainers.
Weekly losers – Protocol Revenue
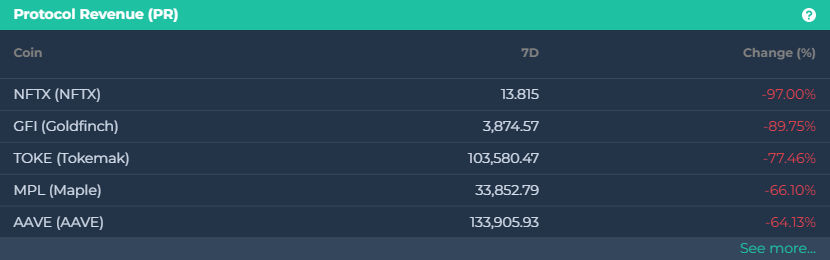
Today’s weekly losers
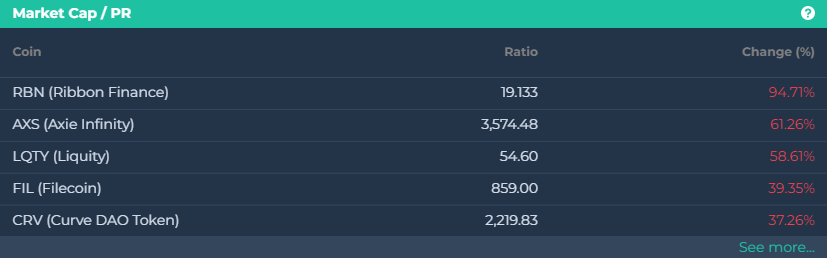
Weekly gainers – Market Cap / PR
Mcap/PR: a seven-day shift in the Price-to-Revenue Ratio, a financial indicator that takes into account both a project’s market capitalization and its Protocol Revenue over the previous twelve months. Because it shows undervaluation because the market capitalization does not reflect the strength of the company’s revenues, the lower the ratio, the more appealing the investment is.
Today’s weekly gainers.
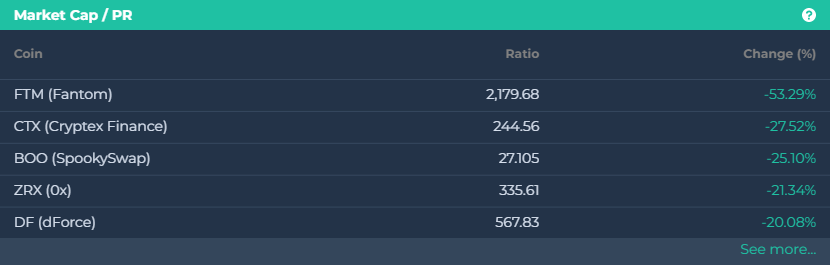
Weekly losers- Market Cap / PR
Today’s weekly losers.
Weekly gainers – Total Value Locked (TVL)
Total Value Locked (TVL): a 7-day change in Total Value Locked (TVL), which is a value of funds locked into the Protocol’s smart contracts. The higher the TVL, the more confidence people have in the project.

Today’s weekly gainers.
Weekly losers – Total Value Locked (TVL)
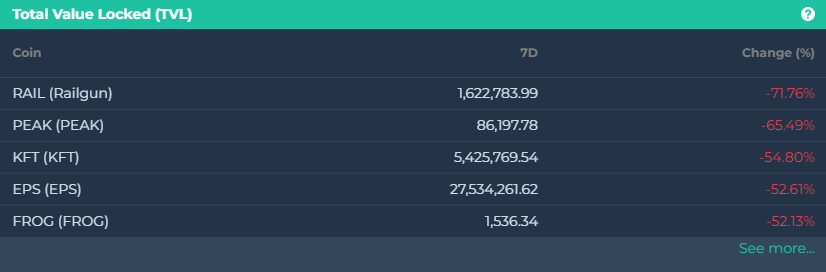
Today’s weekly losers.
