Search Knowledge Base by Keyword
How To Trade Ascending Triangles? | Crypto Chart Pattern
An ascending triangle is a bullish continuation pattern in crypto trading characterized by a flat or slightly ascending upper trendline acting as resistance and a rising lower trendline indicating increasing buyer strength, often leading to a breakout with a potential price target based on the triangle’s height.
Ascending Triangle Trade Setup
Ascending Triangle is a continuation pattern, meaning price typically breaks through the triangle resistance and resumes its prior Uptrend.
The reason an Ascending Triangle chart pattern forms is that every time price dips, buyers step in and buy the dip. And they do that steadily at smaller and smaller dips, which shows they are eager to own this asset! Finally, at some point, buyers absorb all the supply from sellers and push the price past the horizontal resistance.
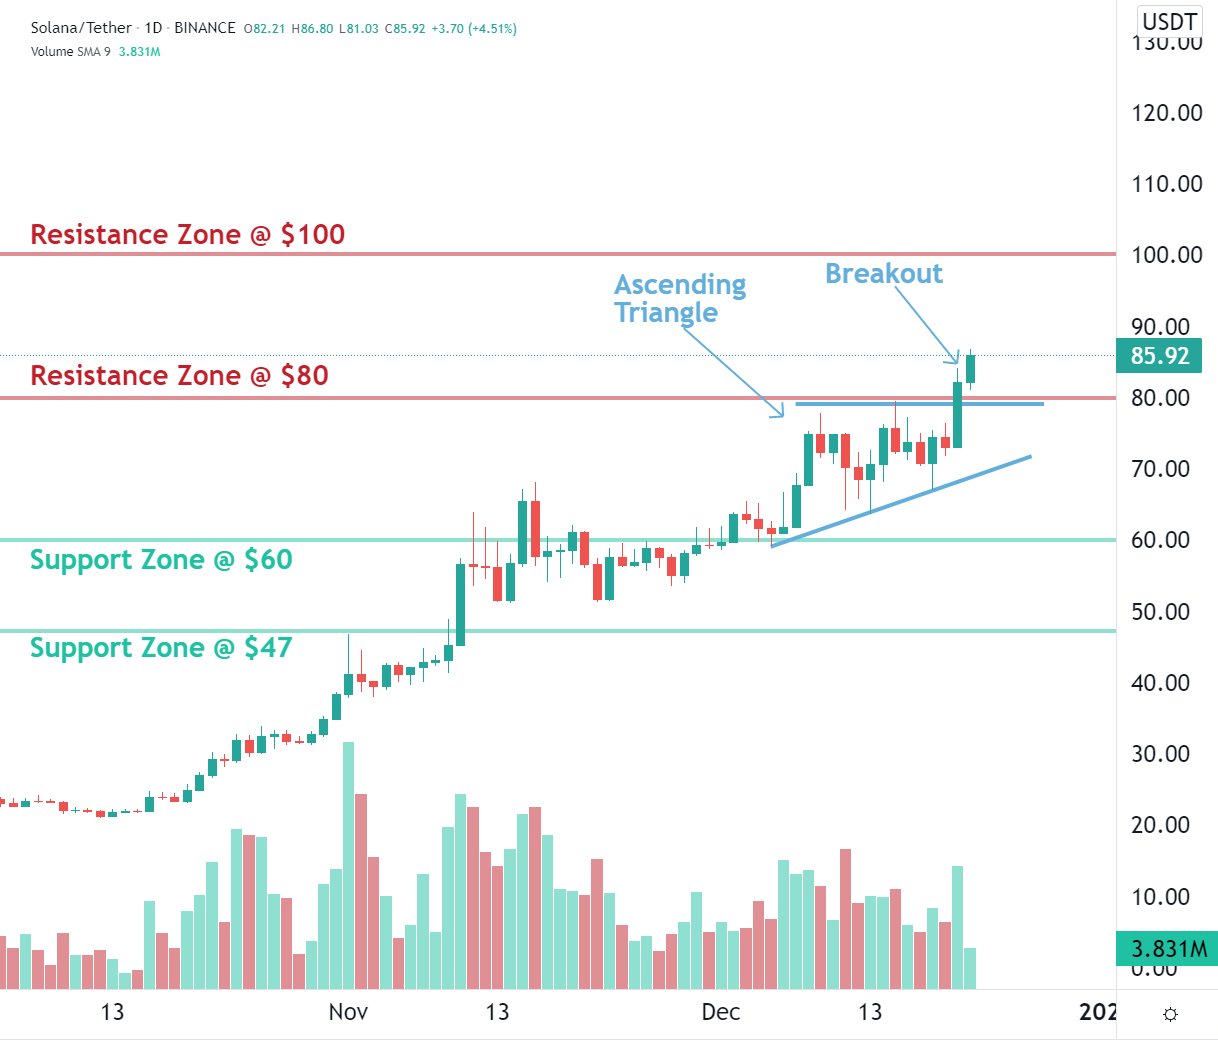
Solana (SOL) Analysis – Example of Ascending Triangle Breakout
Discover more technical analysis
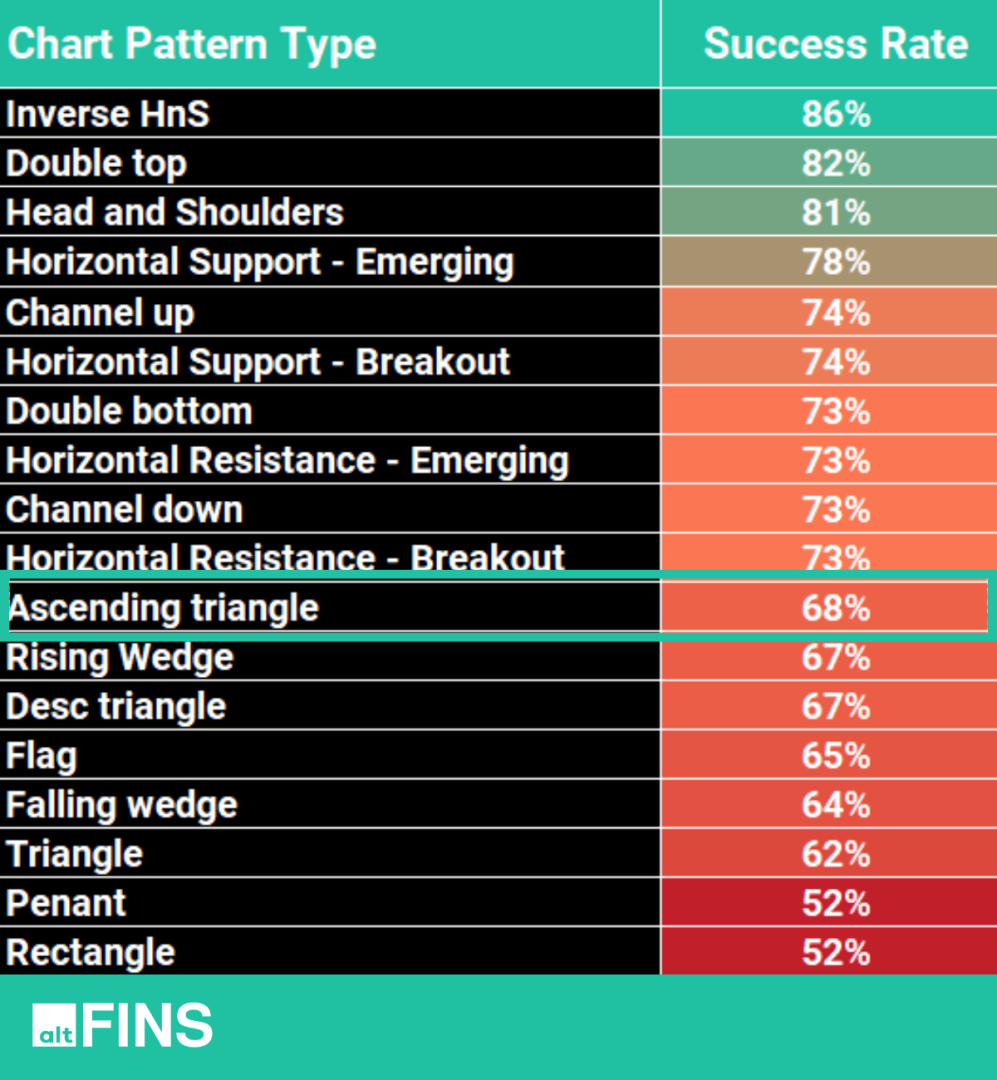
According to historical backtests conducted on the altFINS platform, the Ascending Triangle pattern exhibits an impressive 68%!
An ascending triangle is a bullish continuation pattern in technical analysis that is commonly seen in crypto trading charts. It forms when the price of a cryptocurrency consolidates between a horizontal resistance line and an ascending support line. This pattern suggests that buyers are gradually gaining momentum, pushing the price higher.

Characteristics of an Ascending Triangle:
Horizontal Resistance Line: This line connects the swing highs (peaks) of the price movement, indicating a level of resistance where sellers are trying to push the price down.
Ascending Support Line: This line connects the swing lows (troughs) of the price movement, indicating a level of support where buyers are stepping in to buy the cryptocurrency.
Converging Trendlines: As the price consolidates within the triangle, the two trendlines gradually converge, suggesting a breakout is imminent.
How to Trade Ascending Triangle Crypto Chart Patterns?
Trading strategies for ascending triangle crypto chart patterns involve identifying and capitalizing on potential breakouts. Here’s a step-by-step guide:
Identify the Ascending Triangle:
- Use technical analysis to identify the formation of an ascending triangle pattern on the crypto chart, featuring a flat or slightly ascending resistance line and a rising support line.
Confirm the Pattern:
- Confirm the pattern by observing decreasing trading volumes during the formation of the triangle and ensuring that the price touches the support and resistance lines at least twice to validate their significance.
Wait for Breakout Confirmation:
- Exercise patience and wait for a clear breakout above the upper trendline. A breakout is confirmed when the price closes above the resistance level, preferably with an increase in trading volume.
Set Entry Points:
- Plan entry points based on the breakout. Some traders enter immediately upon a confirmed breakout, while others prefer to wait for a pullback or a retest of the breakout level to ensure its validity.
Establish Stop-Loss Levels:
- Implement effective risk management by setting stop-loss orders below the ascending trendline or the breakout point. This helps protect against false breakouts and minimizes potential losses.
Determine Price Targets:
- Calculate potential price targets by measuring the height of the triangle at its widest point and adding that measurement to the breakout point. Alternatively, use a percentage of the triangle’s height for a more conservative target.
Monitor Volume During Breakout:
- Continue to monitor trading volume during and after the breakout. A sustained increase in volume provides additional confirmation of the strength of the upward move.
How To Identify Ascending Triangle Pattern on altFINS?
To identify cryptocurrencies with Ascending Triangle patterns, visit these altFINS sections:
-
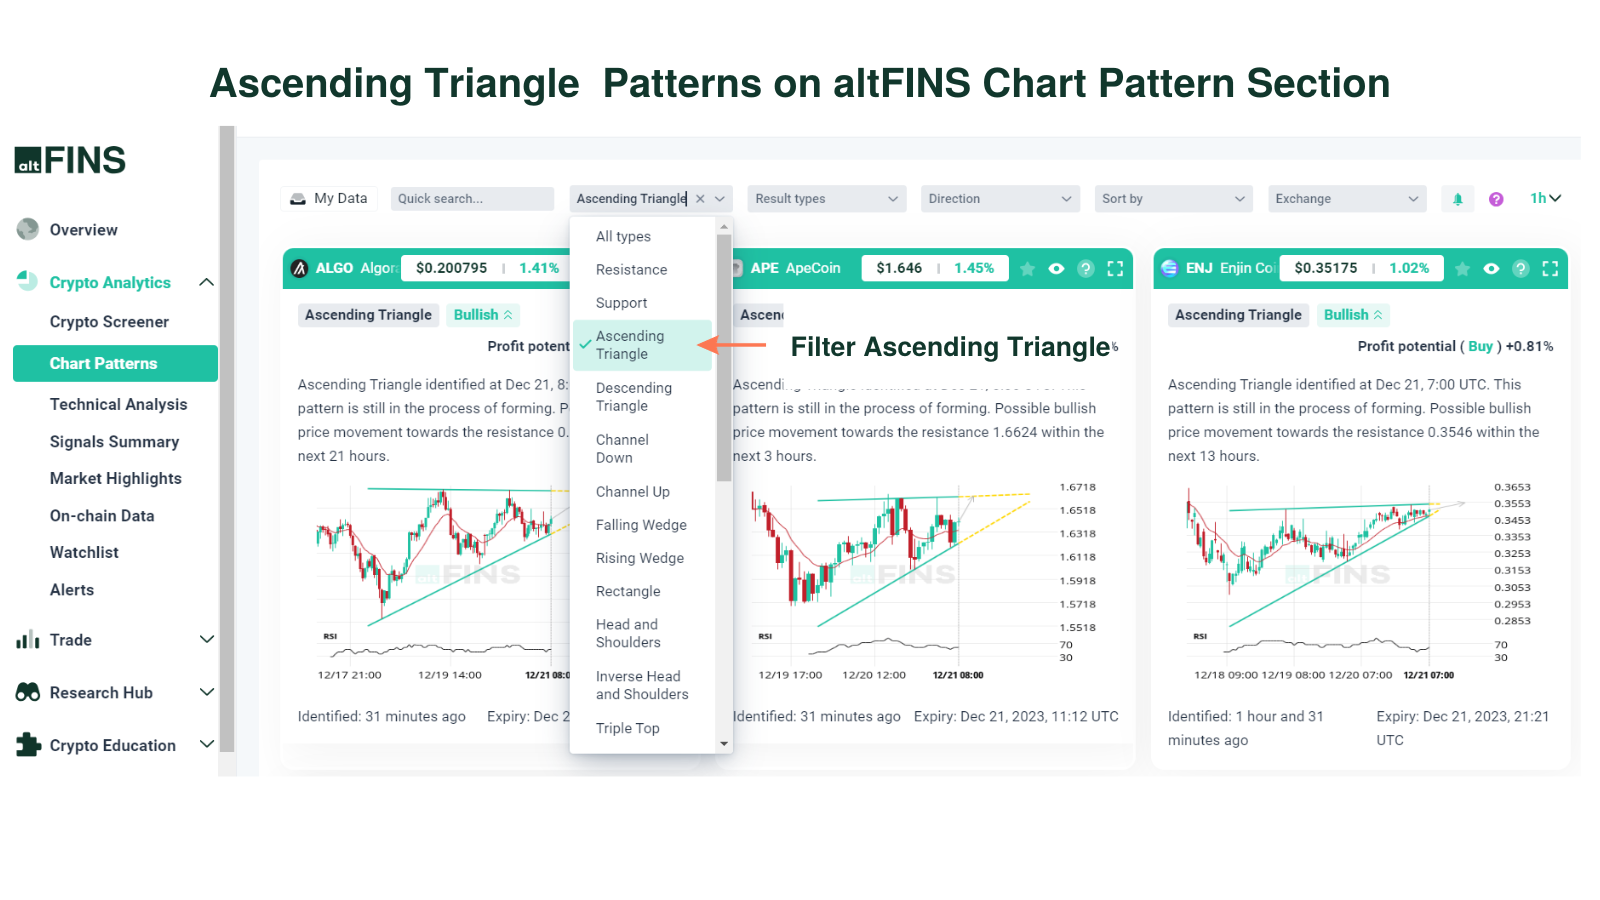
Chart Patterns section:
altFINS’ AI chart pattern recognition engine identifies 26 trading patterns across multiple time intervals (15 min, 1h, 4h, 1d), saving traders a ton of time.
You can filter chart patterns by type, profit potential, success rate, buy or sell direction, exchange, and more.
-
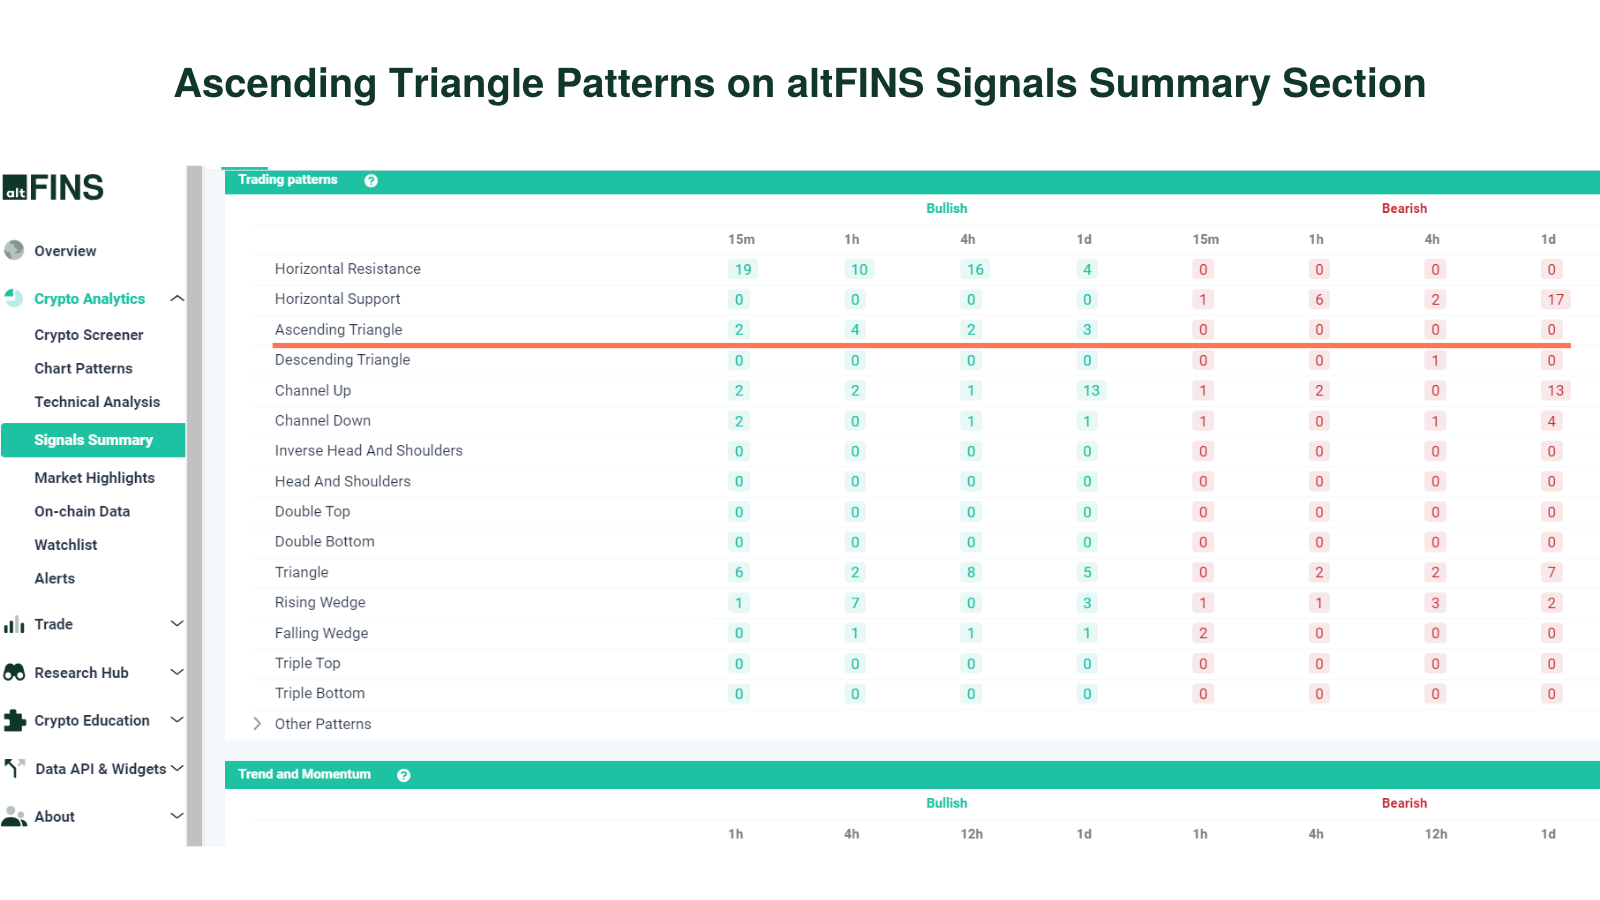
Signals Summary
Crypto signals represent a summary of pre-defined and custom filters for trading strategies. Signals Summary is a great starting point for discovering trading opportunities. Ascending triangle chart patterns can be found in the Trading Patterns category.
-
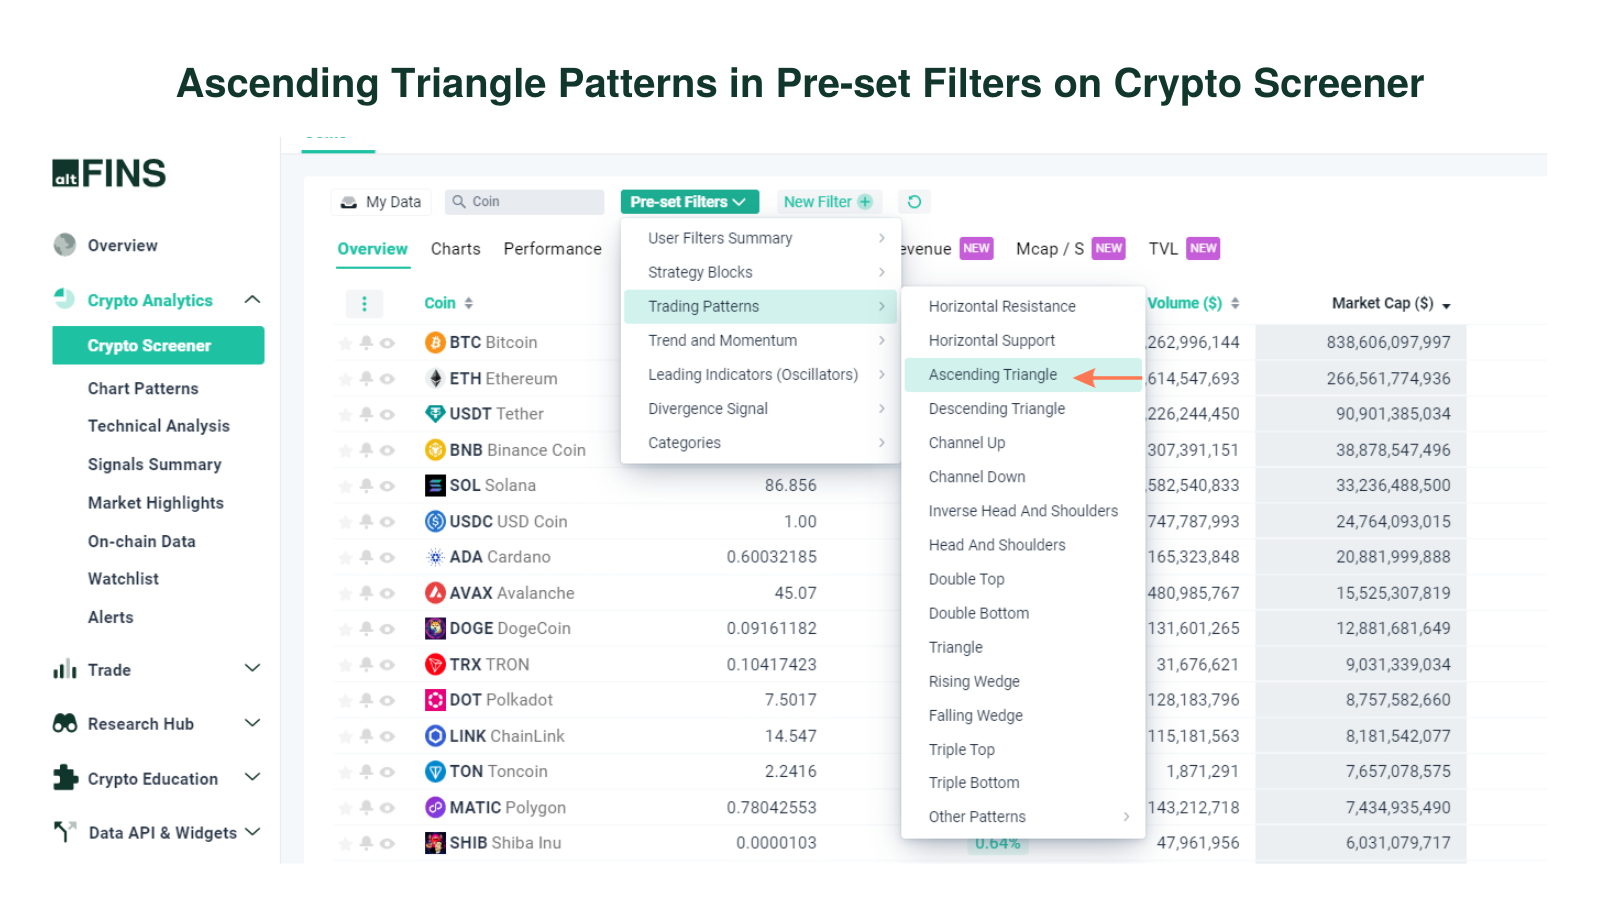
Crypto Screener – Pre-set filters
altFINS offers the best free crypto screener. It includes a wide range of pre- set filters to help find the best cryptocurrencies to invest in based on your specific trading strategy. Learn how to use crypto screener.
-
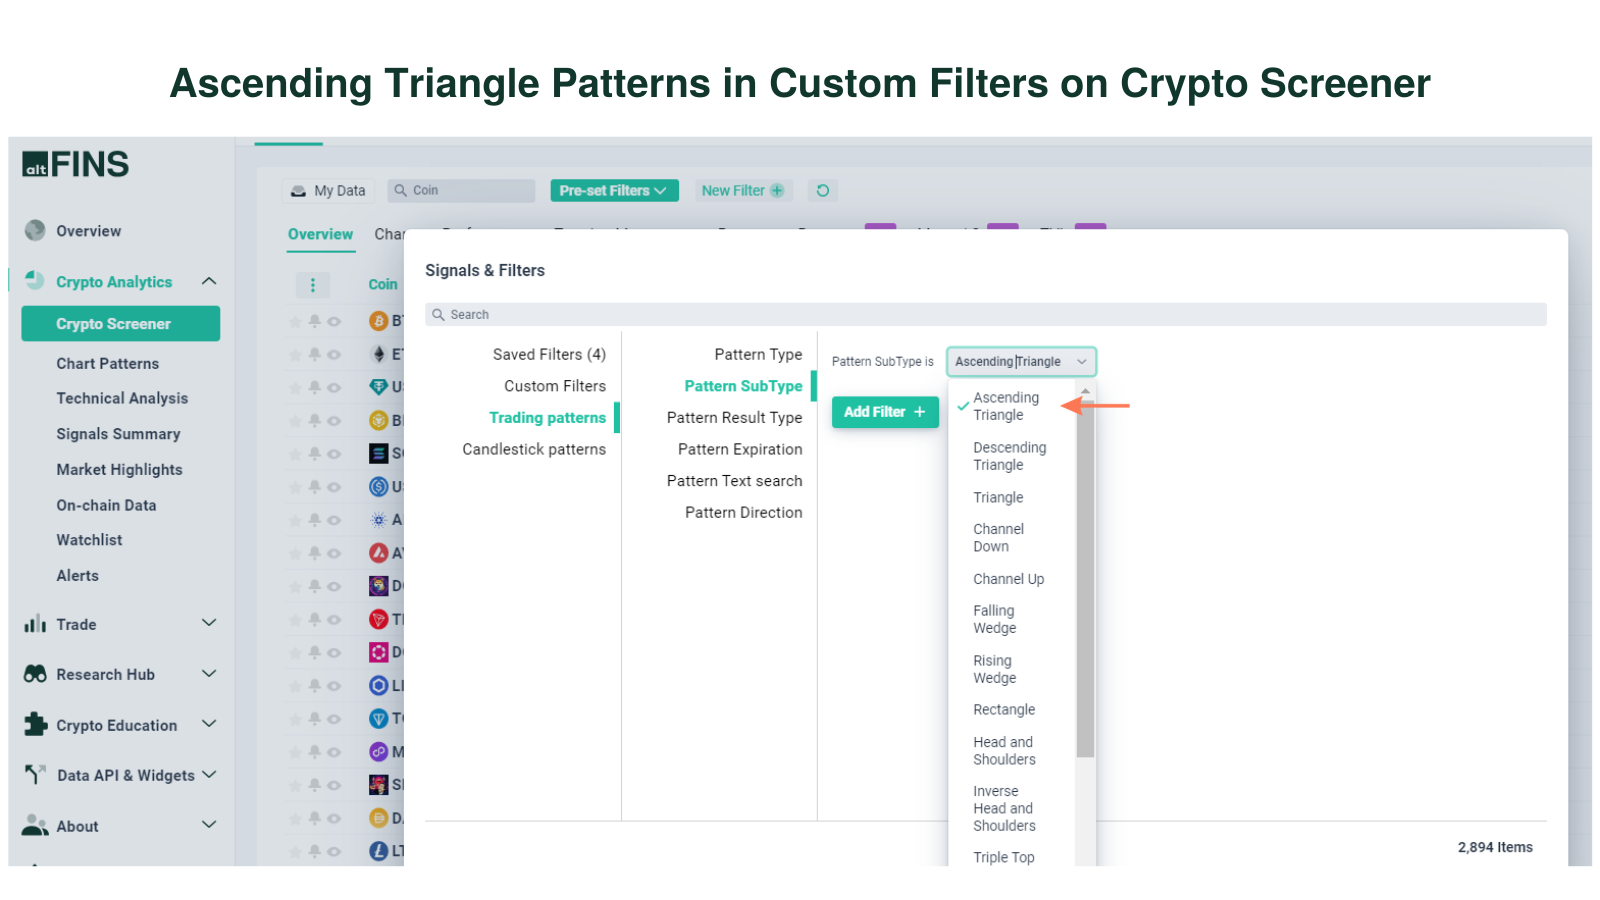
Crypto Screener – Custom filters
You can set up your own custom screens using combinations of technical indicators (SMA, EMA, RSI, MACD), variables like market cap, traded volume and price performance. You can also create price alerts for your scans.
-
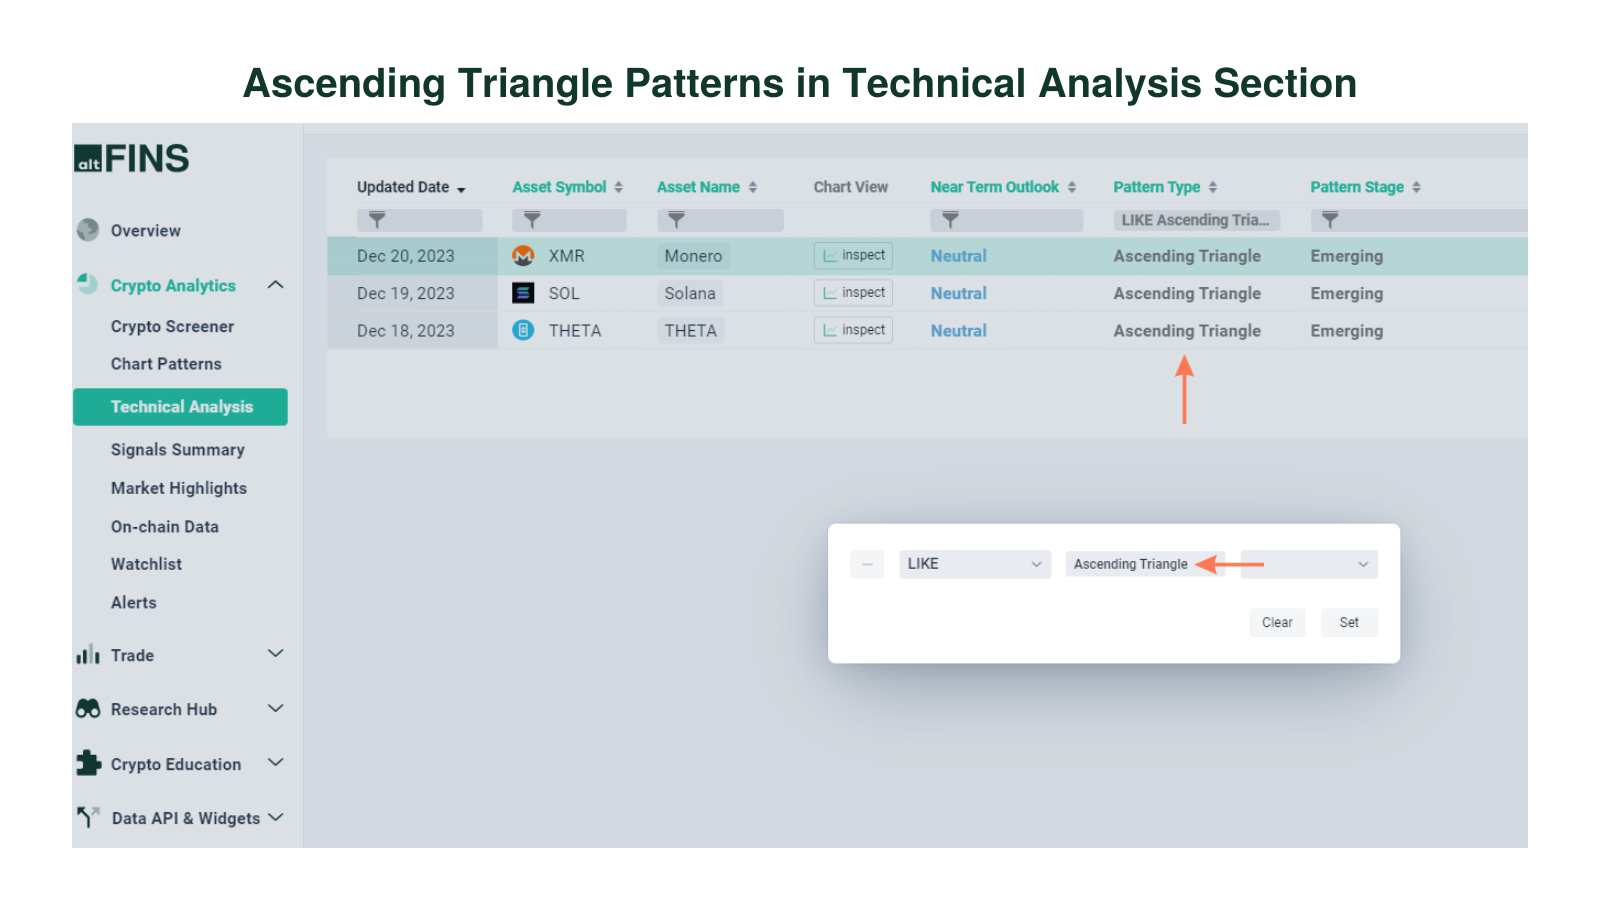
Technical Analysis
altFINS’ analysts conduct technical analysis of top 60 coins. The technical analysis is simple and consistent. It follows the key concepts of Technical Analysis (TA): 1) Trend 2) Momentum 3) Volume 4) Chart Patterns 5) Support and Resistance.
Go to Technical Analysis Section
More tips:
- Lean how to trade Chart Patterns?
- What are Crypto Chart Patterns?
- How to Trade Channel Down Pattern?
- How to Trade Channel Up Pattern?
- How to Set up Chart Pattern Alerts?
