Search Knowledge Base by Keyword
The Relative Volume (RVOL) Indicator
What is the Relative Volume (RVOL) Indicator?
The Relative Volume (RVOL) indicator is a powerful tool used by traders to compare the current trading volume of an asset with its average trading volume over a specified number of periods (typically 30). This comparison helps traders identify unusual trading activity, which can be an important signal for potential price movements. RVOL can be applied across various time intervals such as 15 minutes (15M), 1 hour (1H), 4 hours (4H), 12 hours (12H), or 1 day (1D).
- RVOL > 1.0: Indicates current trading volume is higher than the average volume over the last 30 periods.
- RVOL < 1.0: Indicates current trading volume is lower than the average volume over the last 30 periods.
For instance, if using a daily interval and the RVOL is 3.0, the current period’s volume is three times higher than the 30-day average. This represents a significant increase in trading activity.
Watch Tutorial Video – RVOL Indicator
Key Levels of RVOL
- RVOL > 2.0 or > 3.0: Indicates a substantial spike in trading volume, often signifying strong trader interest.
- RVOL < 1.0: Suggests a lack of volume, potentially indicating weak market participation or an impending trend reversal.
Interpreting RVOL
1. Confirming the Trend
RVOL helps traders confirm the strength and commitment behind a current price trend. When used alongside other technical indicators or market analysis, it provides valuable insights into trader behavior:
- High RVOL Values: Suggests strong market commitment to the current price move, likely signaling that the trend will continue.
- Low RVOL Values: Indicates weaker market commitment, which may precede a trend reversal or the emergence of a sideways trading range.
2. Identifying Reversals
RVOL can also highlight potential reversals. For example:
- A low RVOL during a pullback may simply indicate a temporary correction within an existing trend.
- A high RVOL accompanying a price drop may signal stronger selling pressure and a more committed shift toward a new downward trend.
3. RVOL Thresholds
- RVOL = 1.0: The current volume matches the average volume, considered neutral.
- RVOL > 1.0: Volume is above average, potentially supporting the current price direction.
- RVOL < 1.0: Volume is below average, signaling a possible lack of support for the current trend.
Many traders look for RVOL values above 2.0 before considering entry points, though this threshold may vary by individual trading strategies.
4. Caution with Extreme RVOL Values
While RVOL values above 2.0 are generally seen as supportive of a price move, extreme spikes (e.g., RVOL > 4.0) can sometimes indicate overextension, particularly if the asset is already in an overbought or oversold condition. Such scenarios may foreshadow a trend reversal rather than continuation.
Key Takeaways
- Relative Volume (RVOL) compares current trading volume to the average over the past 30 periods to assess the level of trader commitment to a price move.
- High RVOL generally supports trend continuation, while low RVOL may indicate potential reversals or consolidation.
- Use RVOL with Other Indicators: RVOL is best used in conjunction with other technical indicators and market analysis techniques, as it alone does not provide a complete picture of market conditions.
RVOL Indicator on altFINS
-
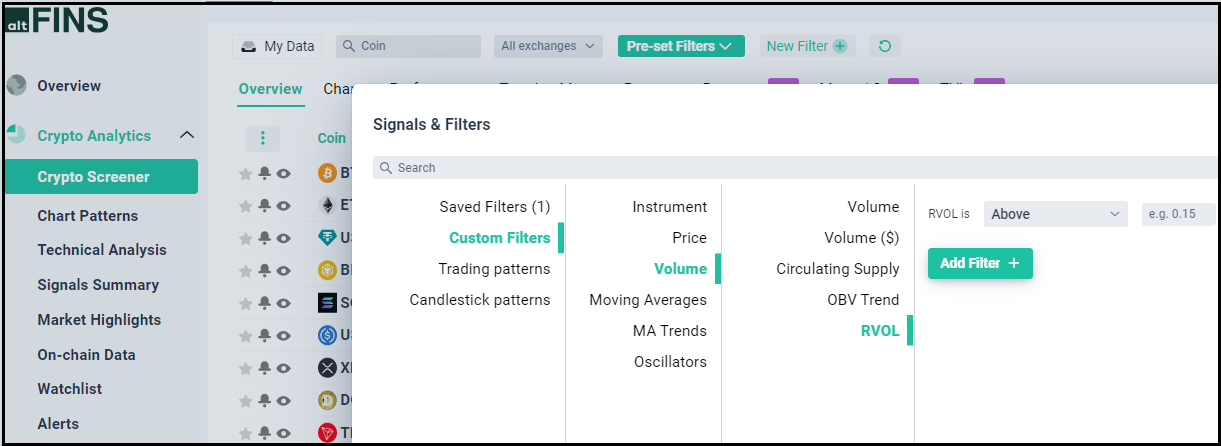
Create your own Filter with RVOL Indicator: Go to Crypto Screener- New Filter – Volume – RVOL
What is RVOL Spike in Uptrend Stretagy and how to find it on altFINS?
-
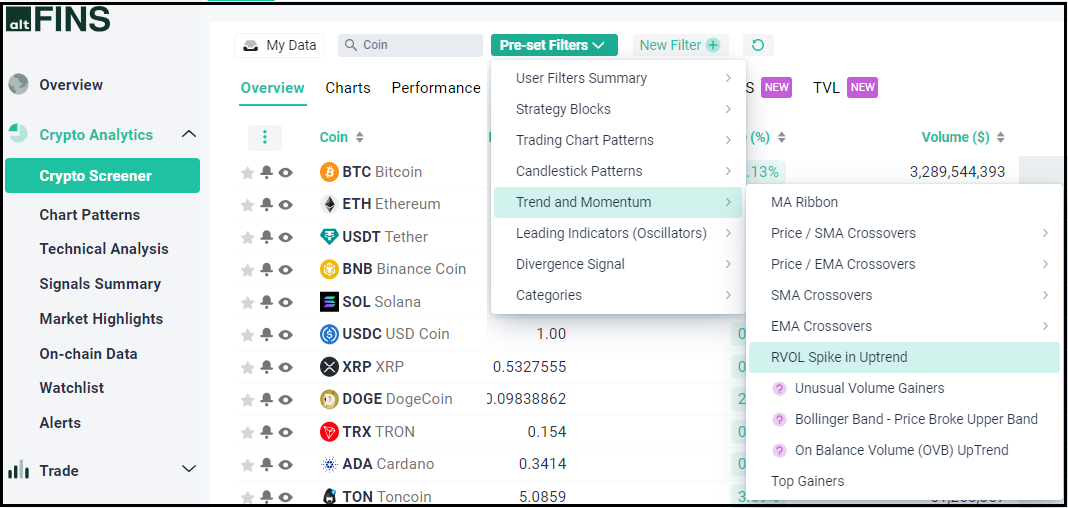
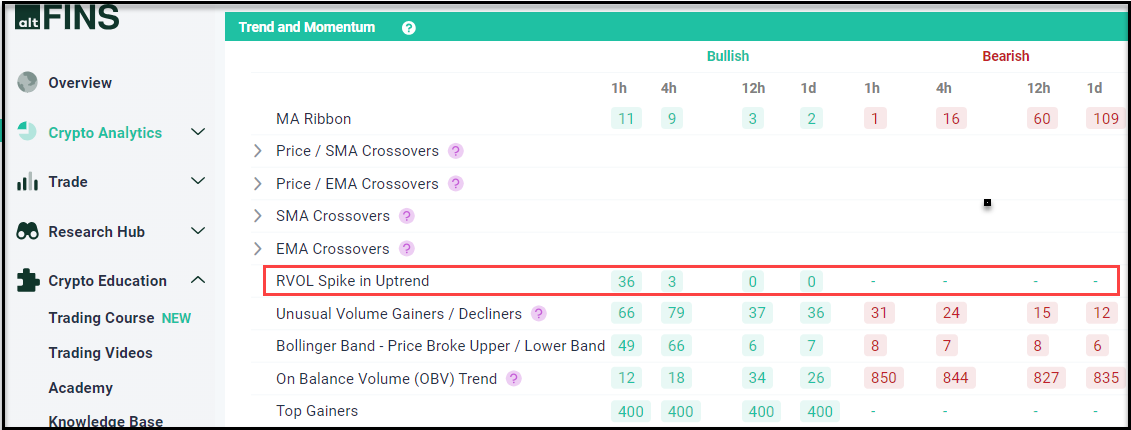
Go to Crypto Screener – Pre-set filters – Trend and Momentum – RVOL Spike in Uptrend
-
Go to Signals Summary – RVOL Spike in Uptrend
What is RVOL Spike in Uptrend Trading Strategy?
The RVOL Spike in Uptrend strategy is a trading approach that leverages the Relative Volume (RVOL) indicator to identify potential high-probability trade opportunities during a confirmed uptrend. This strategy focuses on detecting significant spikes in trading volume, indicated by an RVOL value greater than 2 or 3, which suggests heightened market interest and momentum.
Trading Rules for RVOL Spike in Uptrend Strategy
1. Trend Confirmation:
- Ensure the asset is in a confirmed uptrend, characterized by higher highs and higher lows.
- Use moving averages (e.g., 50-day and 200-day) or trend lines to validate the uptrend.
2. Identify RVOL Spike:
- Monitor the Relative Volume (RVOL) indicator; a spike above 2.0 or 3.0 suggests significant trading volume compared to the historical average.
- The RVOL spike should coincide with increased buying activity, indicating strong market interest.
3. Entry Criteria:
- Enter a long position when a bullish price action signal confirms the volume spike, such as: Breakout above a key resistance level.
- Bullish candlestick patterns (e.g., bullish engulfing, hammer, or morning star).
- Continuation patterns like flags or pennants.
- Ensure that the price action aligns with the volume spike to validate the trade setup.
4. Risk Management:
- Set a stop loss below the most recent swing low or a nearby support level to protect against potential downside risk.
- Use proper position sizing to manage risk, ensuring that the maximum loss on any trade does not exceed your acceptable risk threshold (e.g., 1-2% of your trading capital).
5. Exit Strategy:
- Set profit targets at the next resistance level, previous high, or based on Fibonacci extensions.
- Alternatively, use a trailing stop to lock in profits as the price moves in your favor.
- Exit the trade if bearish signals appear, such as a reversal candlestick pattern or if RVOL significantly declines, indicating diminishing momentum.
6. Additional Filters (Optional):
- Use complementary indicators like RSI or MACD to avoid overbought conditions or to confirm momentum.
- Avoid trades during major economic news releases that can create unpredictable volatility.
Conclusion
The Relative Volume (RVOL) indicator is a valuable tool for identifying significant shifts in market activity. By comparing current volume levels with historical averages, RVOL can provide insights into market commitment and help traders make more informed decisions. However, like all technical indicators, RVOL should be used as part of a broader analysis strategy rather than in isolation.
