Search Knowledge Base by Keyword
What is ATR Indicator and How to Find It on altFINS?
What is ATR (Average True Range)
ATR (Average True Range) is a technical indicator that measures how much an asset typically moves during a given time period. It was developed by J. Welles Wilder Jr. and is widely used by traders to evaluate asset volatility.
Unlike trend-following indicators like moving averages, ATR does not show price direction. It only measures how much prices move. A higher ATR means the asset is more volatile, while a lower ATR means the asset is more stable.
Why Use ATR in Crypto Trading
ATR is useful for a number of reasons:
- It helps traders identify assets with rising or falling volatility
- It allows you to set more effective stop-loss levels based on recent price behavior
- It can signal the start of a breakout or trend reversal when volatility spikes
- It helps filter out low-volatility assets when you’re looking for strong movers
How ATR is Calculated
ATR is based on the True Range (TR), which is the greatest of the following:
- Current High minus Current Low
- Absolute value of Current High minus Previous Close
- Absolute value of Current Low minus Previous Close
The ATR is then calculated as the average of these True Range values over a certain number of periods, typically 14.
Example:
If Bitcoin has a high of $51,000, a low of $49,000, and the previous close was $50,000, the TR would be 2,000. If similar values are seen for 14 days, then the 14-day ATR would be about $2,000.
Example Use Case
Suppose the 14-day ATR for Ethereum is $80. If today’s price range (high minus low) is $320, then Ethereum’s current range is 4 times the ATR. That means it’s experiencing much higher volatility than usual, which might indicate a strong move is underway.
Traders could use this information to:
- Enter short-term trades during a breakout
- Set wider stop-loss levels to avoid being stopped out prematurely
- Focus on assets that are actually moving, rather than trading sideways
How to Use ATR for Setting Stop Loss (SL) Levels
If ATR for ETH if $80 and a trader takes a long position, then he may chose to place an SL level at least $80 below his entry price. That’s because $80 price movement is very normal (ATR) for ETH. If the traders places an SL level lower than $80, he’s very likely to get stopped out just during a normal daily price fluctuation.
How to Find the ATR Filter on altFINS
The altFINS platform includes a built-in ATR filter called “ATR: Current Range” that allows you to screen for assets showing above-average volatility.
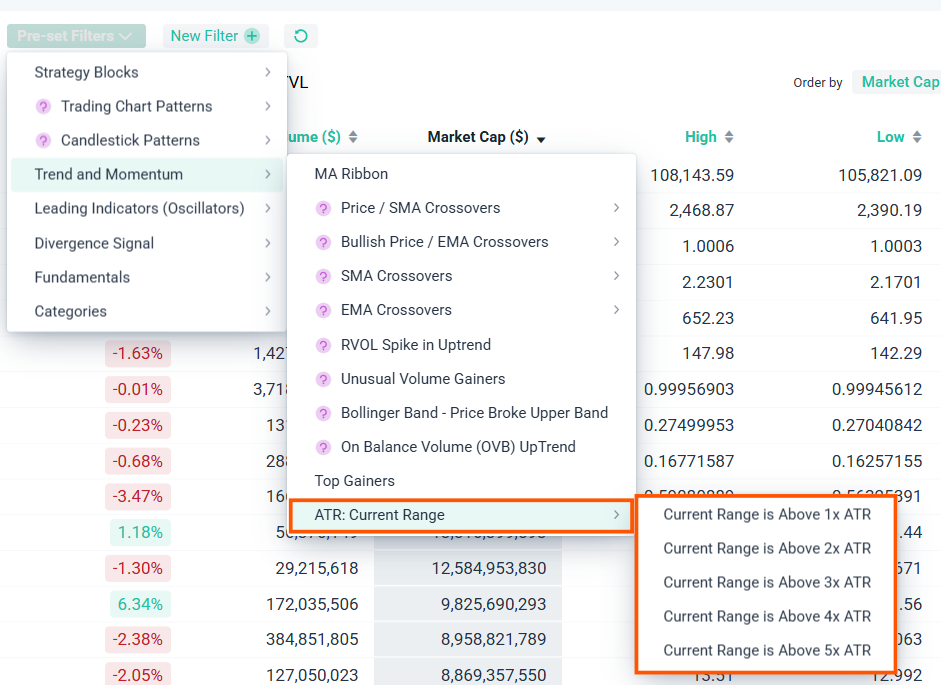
To use it:
- Go to the Screener on altFINS
- Click on the “Pre-set Filters” dropdown
- Select “Trend and Momentum”
- Choose “ATR: Current Range”
Pick a filter option, such as:
- Current Range is Above 1x ATR
- Current Range is Above 2x ATR
- Current Range is Above 3x ATR
- Current Range is Above 4x ATR
- Up to 5x ATR
This filter shows you which assets are experiencing more movement today compared to their historical average. The higher the multiple, the more unusual the volatility.
Practical Tips
- Use the ATR filter in combination with volume filters or trend indicators to confirm signals
- Look for assets with high ATR multiples and volume spikes as potential breakout candidates
- Use ATR to help size your position and set stop-loss levels more effectively
Who Should Use ATR in Trading?
This filter is ideal for:
- Day traders and swing traders looking for high-momentum opportunities
- Volatility-based strategy traders
- Traders who want to set stop-losses dynamically based on market conditions
- Beginners who want a simple way to gauge market activity without complex chart patterns
Mistakes to Avoid When Using ATR:
- Using ATR as a trend indicator (it only measures volatility, not direction)
- Setting static stop-losses regardless of ATR (you might get stopped out too early)
- Ignoring volume and context—high ATR doesn’t always mean a good trade setup
- Comparing ATR values across different coins without context (use percentages or multiples)
Summary
ATR is a valuable indicator for measuring volatility in crypto markets. It doesn’t predict direction but tells you how much movement is happening. The “ATR: Current Range” filter on altFINS helps you quickly find assets that are showing unusual volatility, often a sign of breakouts or important market shifts.
Try it today on the altFINS Screener to discover new trading opportunities based on real-time volatility data.
