Search Knowledge Base by Keyword
Crypto Trading Strategies
What Are The Best Crypto Trading Strategies?
There are no single “best” crypto trading strategies that work in all market conditions and for all traders. Successful crypto trading requires a combination of knowledge, experience, and a sound approach that suits your individual preferences and needs. Here are a few widely used and time-tested crypto trading strategies:
- Value investing: This strategy involves searching for undervalued altcoins that have the potential to deliver long-term returns.
- Momentum trading: This strategy involves buying coins that are rising in price and selling those that are falling.
- Swing trading: This strategy involves holding positions for a few days to several weeks, taking advantage of intermediate-term price movements
- Trend trading: This strategy involves identifying and following market trends in an attempt to profit from price movements. The idea behind trend trading is that prices tend to persist in one direction for an extended period of time, providing opportunities for traders to buy low and sell high, or sell high and buy low, depending on the direction of the trend.
- Day trading: This strategy involves buying and selling securities within the same day, taking advantage of short-term price movements
- Technical analysis: This strategy involves using charts and other technical indicators to identify trends and make trading decisions.
It’s important to remember that no trading strategy is foolproof, and success also depends on factors such as risk management, discipline, and the ability to adapt to changing market conditions. Before implementing any crypto trading strategy, it’s crucial to thoroughly understand the risks involved and have a solid understanding of the markets you are trading in.
What Is Technical Analysis In Crypto Trading?
Source: altFINS
Technical analysis is a method of evaluating cryptocurrencies by analyzing statistics generated by market activity, such as past prices and volume. Technical analysts believe that trends in the market and in individual cryptocurrencies can be predicted by studying charts and other technical indicators, such as moving averages and oscillators.
The basic premise of technical analysis is that market trends tend to repeat themselves. By analyzing past market data, technical analysts look for patterns and use that information to make trading decisions. They use technical indicators like support and resistance levels, trend lines, and chart patterns to find possible trade setups. You can find more than 50 technical analyses, daily updated by the altFINS team, here.
Technical analysis is widely used in cryptocurrency market, and can be applied to various time frames, from short-term intraday charts to long-term monthly charts.
It’s important to note that while technical analysis can be a valuable tool for traders, it is not a perfect science and should not be relied upon exclusively. Technical analysis is best used in conjunction with other forms of analysis, such as fundamental analysis, to provide a more comprehensive view of the market. Additionally, market conditions can change rapidly, so traders need to be prepared to adapt their strategies as needed.
What Are The Best Technical Indicators?
There are many technical indicators that crypto traders use to make informed trading decisions, and the best indicator(s) for a trader depends on their individual trading style and goals. Here are a few popular indicators that are widely used by traders:
- Moving Averages: A moving average helps to smooth out price action and identify trends by averaging out price data over a set period of time.
- Bollinger Bands: Bollinger Bands are volatility indicators that consist of a moving average and two standard deviation lines that are plotted above and below it.
- Relative Strength Index (RSI): The RSI is a momentum oscillator that measures the strength of a cryptocurrency’s price action by comparing gains to losses over a specified period of time.
- Stochastic Oscillator: The Stochastic Oscillator is a momentum indicator that compares the closing price of a security to its price range over a specified number of periods.
- MACD (Moving Average Convergence Divergence): The MACD is a trend-following momentum indicator that uses the difference between two moving averages to identify trends and potential trend reversals.
Signal summary on altFINS represents the most used technical indicators.
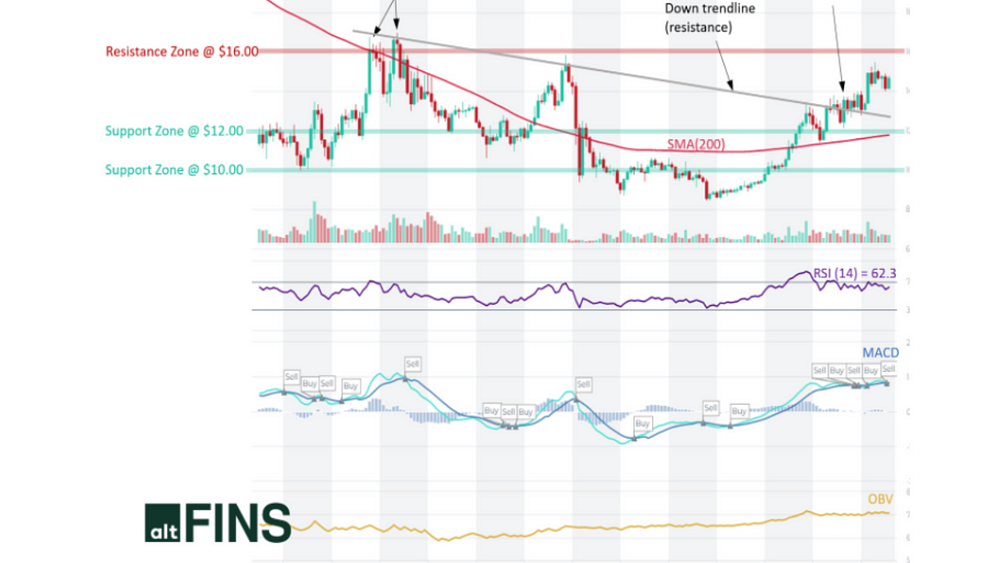
What Is Support and Resistance In Crypto Trading?
Support and resistance are key concepts in technical analysis that are widely used in cryptocurrency trading.
Support refers to a price level at which demand for an asset is strong enough to prevent the price from falling further. Traders look to enter long positions near support levels, with the expectation that the price will bounce back up.
Resistance, on the other hand, is a price level at which supply of an asset is strong enough to prevent the price from rising further. Traders look to enter short positions near resistance levels, with the expectation that the price will fall back down.
Support and resistance levels are often identified using charts and technical analysis tools such as trend lines, moving averages, and previous highs and lows. These levels can change over time as market conditions evolve, so traders need to continually monitor the markets and adjust their trading strategies as needed.
It’s important to keep in mind that while support and resistance levels can provide valuable information for traders, they are not foolproof. Price breaks through support and resistance levels are common, and traders need to have a solid risk management plan in place to mitigate the potential losses that can result from these price breaks.
What Are Chart Patterns In Crypto Trading?
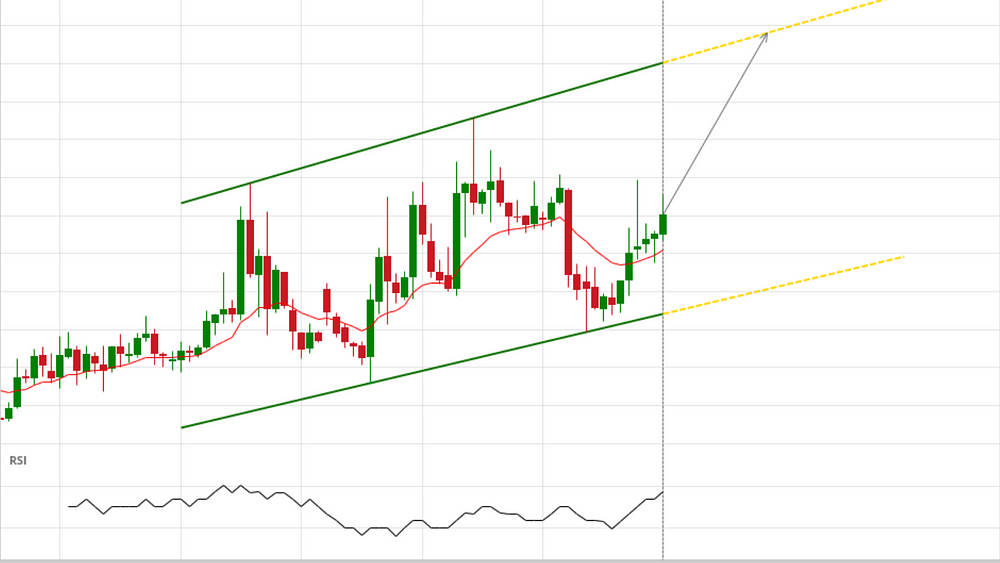
Crypto chart patterns are specific price formations that occur on cryptocurrency charts, and they can provide valuable information for traders in making buy or sell decisions. Some common chart patterns that traders look for in the cryptocurrency markets include:
- Head and Shoulders: The head and shoulders pattern is a reversal pattern that signals a potential trend reversal from bullish to bearish, or vice versa.
- Flag and Pennant: The flag and pennant pattern is a continuation pattern that signals a temporary pause in price action, followed by a continuation of the trend.
- Triangle: The triangle pattern can be either a continuation or reversal pattern, depending on the direction of the trend leading up to the formation of the triangle.
- Double Bottom and Top: The double bottom and top pattern is a reversal pattern that signals a potential trend reversal from bearish to bullish, or vice versa.
- Channel Up and Down: A channel up or down is a chart pattern that is formed when price action moves between two parallel trend lines that are acting as support and resistance levels. The channel up pattern is a bullish pattern that forms when prices are in an uptrend and the channel down pattern is a bearish pattern that forms when prices are in a downtrend.
Chart patterns are not a guarantee of future price movements and can be subject to false signals. Traders should use chart patterns along with other types of technical and fundamental analysis and good risk management to make smart trading decisions. Additionally, it’s important for traders to be aware of the potential for market volatility and to be prepared for sudden price movements.
Do you want to learn crypto trading? Join altFINS crypto trading course!