Search Knowledge Base by Keyword
How to trade EMA 12 / 50 crossovers?
TL;DR – EMA / SMA Crossovers in Crypto Trading
EMAs & SMAs help identify price trends and support/resistance.
EMA crossover strategy: when a short-term EMA (e.g. 12) crosses a long-term EMA (e.g. 50).
- Bullish: short EMA crosses above long EMA
- Bearish: short EMA crosses below long EMA
EMA reacts faster than SMA because it weights recent prices more → earlier signals, less lag.
Choosing EMA/SMA periods
- Short-term MAs (5–26): early entries, higher upside, more false signals
- Long-term MAs (30–200): later entries, lower upside, higher win rate
EMA 12/50 Strategy
- Buy: EMA 12 crosses above EMA 50 and price is above EMA 12
- Sell: EMA 12 crosses below EMA 50
Works best in trending markets, not sideways ranges (risk of whipsaws).
How to improve results
- Combine EMA crossovers with RSI, MACD, OBV, etc.
- Trade lower timeframes (1h–4h) only in the direction of the higher timeframe trend.
- Use 200-day EMA to confirm long-term trend direction.
altFINS
Scans 2,000+ altcoins for bullish & bearish EMA/SMA crossovers across timeframes.
Lets you combine multiple EMA crosses and set alerts for signals.
Best practice for beginners
Buy dips in uptrends, sell pullbacks in downtrends.
EMA crossovers work on all timeframes, but avoid <1h due to noise.
What Is EMA Crossover?
Updated January 2025: Exponential Moving Averages (MA) help identify 1) price trends and 2) potential support and resistance levels.
EMA (or SMA) crossovers in trading is a foundational strategy for trend trading
EMA crossover in trading occurs when a short-term EMA (e.g. 12 day) crosses the long-term EMA (e.g. 50 day), either above (bullish, uptrend) or below (bearish, downtrend).
You can read about differences between Simple Moving Average (SMA) and Exponential Moving Average (EMA), but in short, EMA puts greater weight on the most recent prices, and thus has less lag than SMAs. Hence, EMA reacts quicker to price changes and provides an earlier trend signal than SMAs.
There are many moving average crossover trading possibilities (EMA 12/26, EMA 26/50, SMA 5/10, SMA 10/30, etc.).
Which EMA or SMA should you use in trading?
It depends on how early or late you wanna be, and how many false signals you’re willing to work with.
1. Using short term moving averages (5, 10, 12, 20, 26 periods) will result in detecting a trend early, with high profit potential, but with many false signals (i.e. lower winning rates).
2. Using longer term moving averages (30, 50, 100, 200 periods) will result in detecting a trend later, when it’s more established, but perhaps with less upside potential left since you’re jumping on the trend a bit later. However, you should get fewer false signals, hence a higher win rate.
You can improve your success rates (reduce false signals) by combining moving average crossovers (EMA or SMA) with other indicators like MACD (momentum), RSI, and OBV, among others.
altFINS allows you to compare EMAs. For instance, you can find coins where 5-day EMA has crossed the 10-day EMA. You can also combine multiple EMA crosses (5/10, 5/20, 5/30, or 5/10, 10/20, 20/30, etc.) to strengthen the signal power of your screen.
To quickly and easily find cryptocurrencies news with EMA or SMA crossovers, bullish or bearish (across 4 time intervals), check our Signal Summary page. altFINS constantly scans over 1,800 altcoins to identify signals:
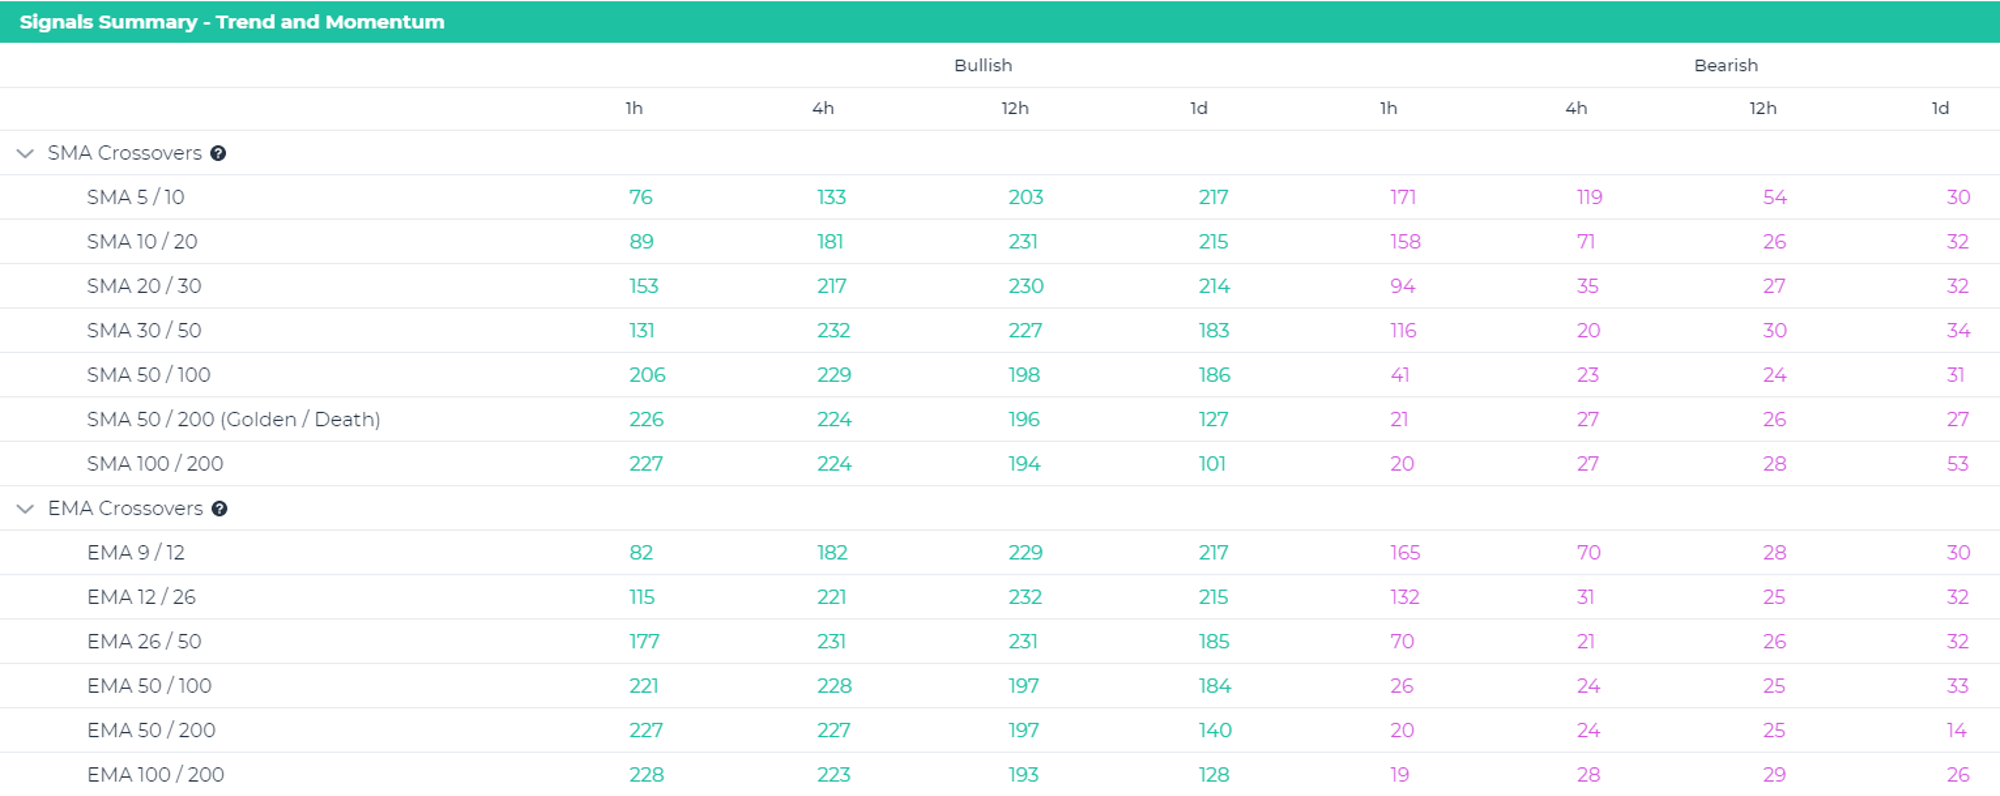
We also recommend setting up Alerts for specific EMA or SMA crossovers. See how here.
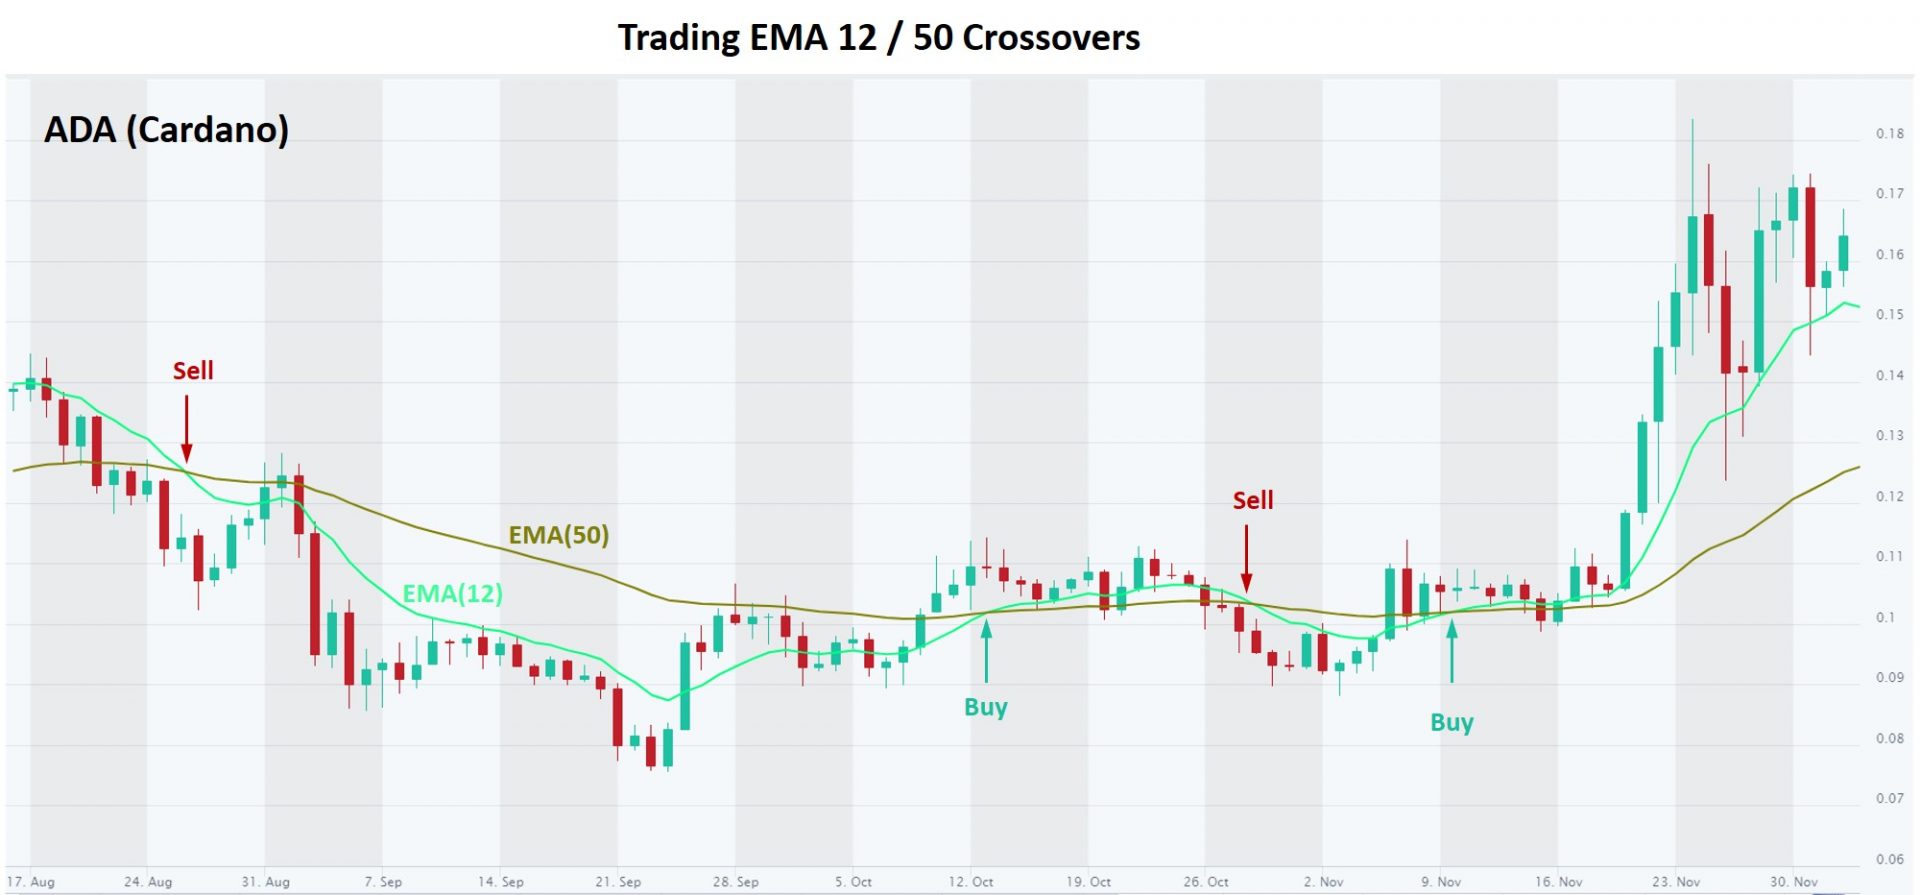
EMA 12 / 50 is a simple trend following strategy using moving average crossovers.
This strategy uses the 12 day and 50 day Exponential moving average (EMA).
Trading rules:
- Buy when EMA 12 crosses above EMA 50 and Price is above EMA 12.
- Sell when EMA 12 crosses below EMA 50.
You can set up a custom screen in altFINS to catch these opportunities by using these criteria.
Learn how to trade Fresh Bullish Crossover in the following video:
Fresh Bearish Crossover (EMA 12/50)
This is a simple yet powerful trend trading strategy. Find a trend and ride it for big gains. Moving averages are used to spot trends. Bearish Exponential Moving Average (EMA) crossover occurs when a short-term EMA (e.g. 12 day) crosses below long-term EMA (e.g. 50 day).
This screen finds coins where EMA 12 recently (last 2 days) crossed below EMA 50 and Price is below EMA 12.
Trading rules:
- (Short) Sell when EMA 12 crosses below EMA 50 and Price is below EMA 12
- Buy when EMA 12 crosses above EMA 50 or Price crosses above EMA 12
- Place a Stop Loss order (or Alert) above the prior high
Below is a video tutorial on how to create this custom screen.
The great part about this approach is that it gives clear trade entry and exit crypto signals. Often, timing trade exit (at a loss or profit) is the toughest part. Here it’s clear: when EMA 12 crosses below EMA 50, or price dips below EMA 50.
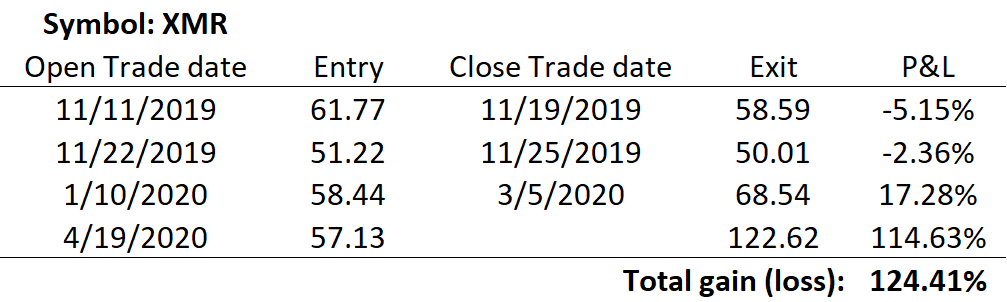
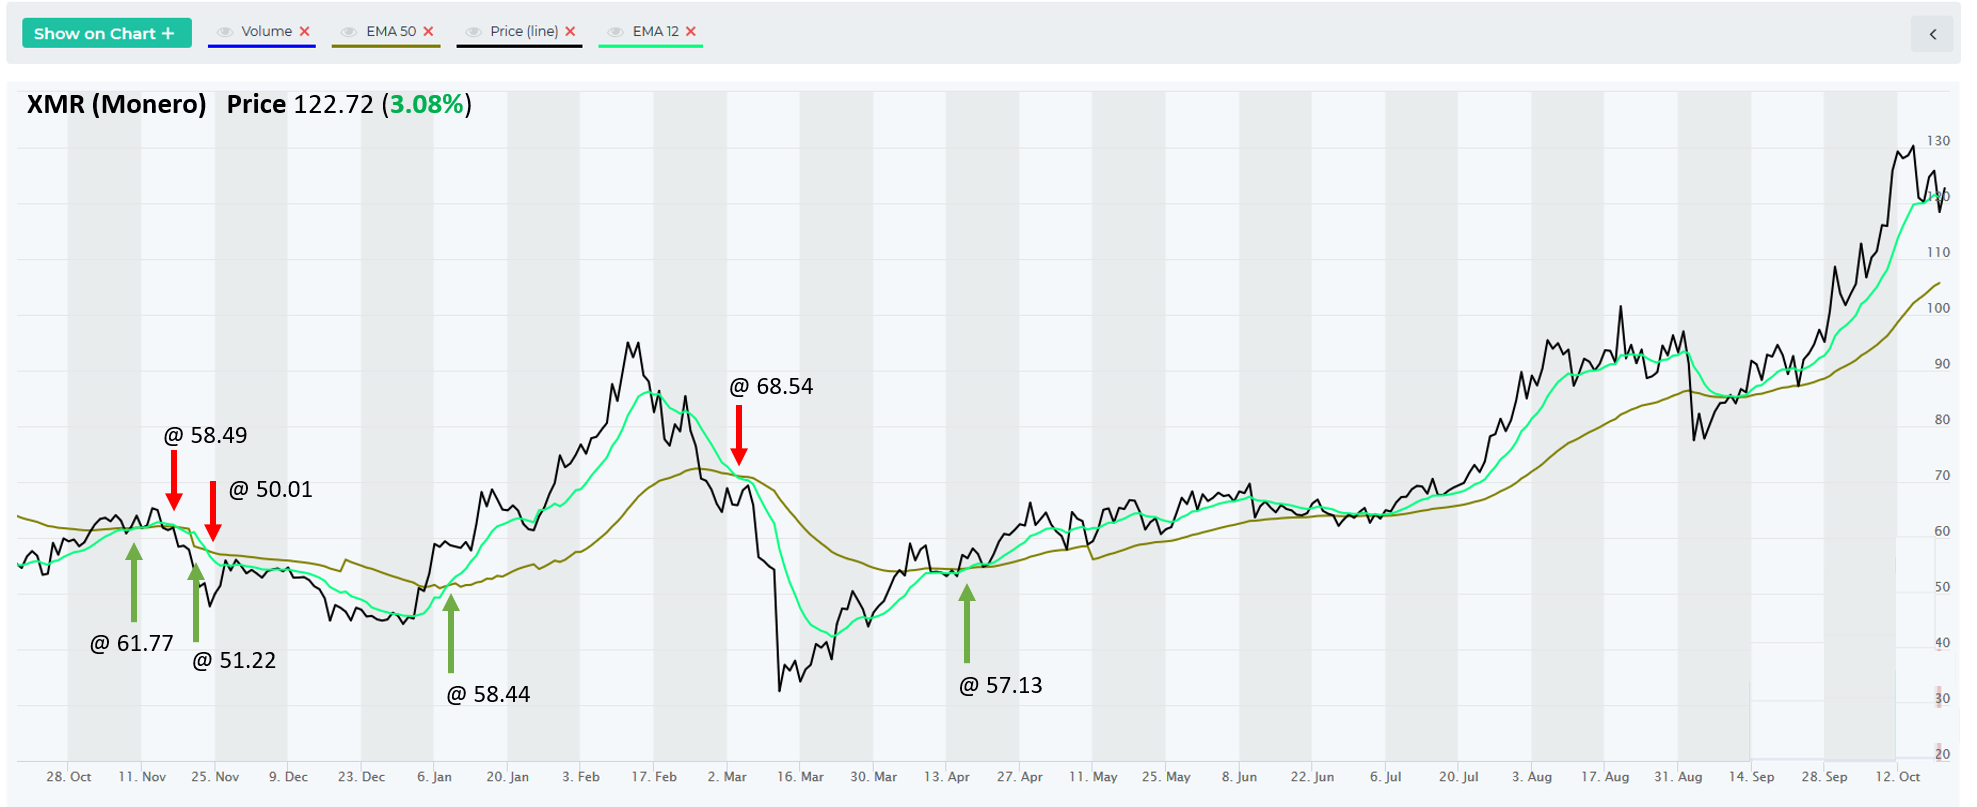
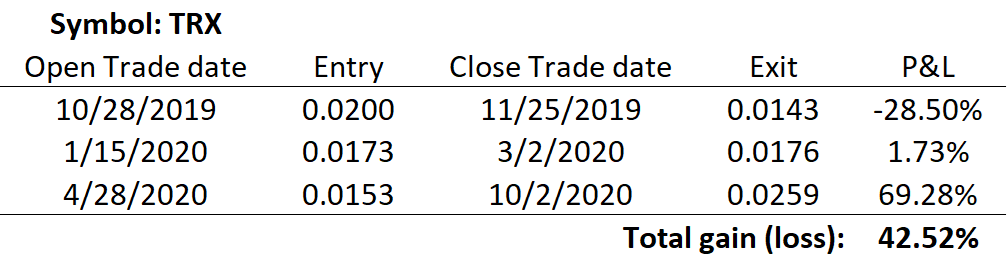
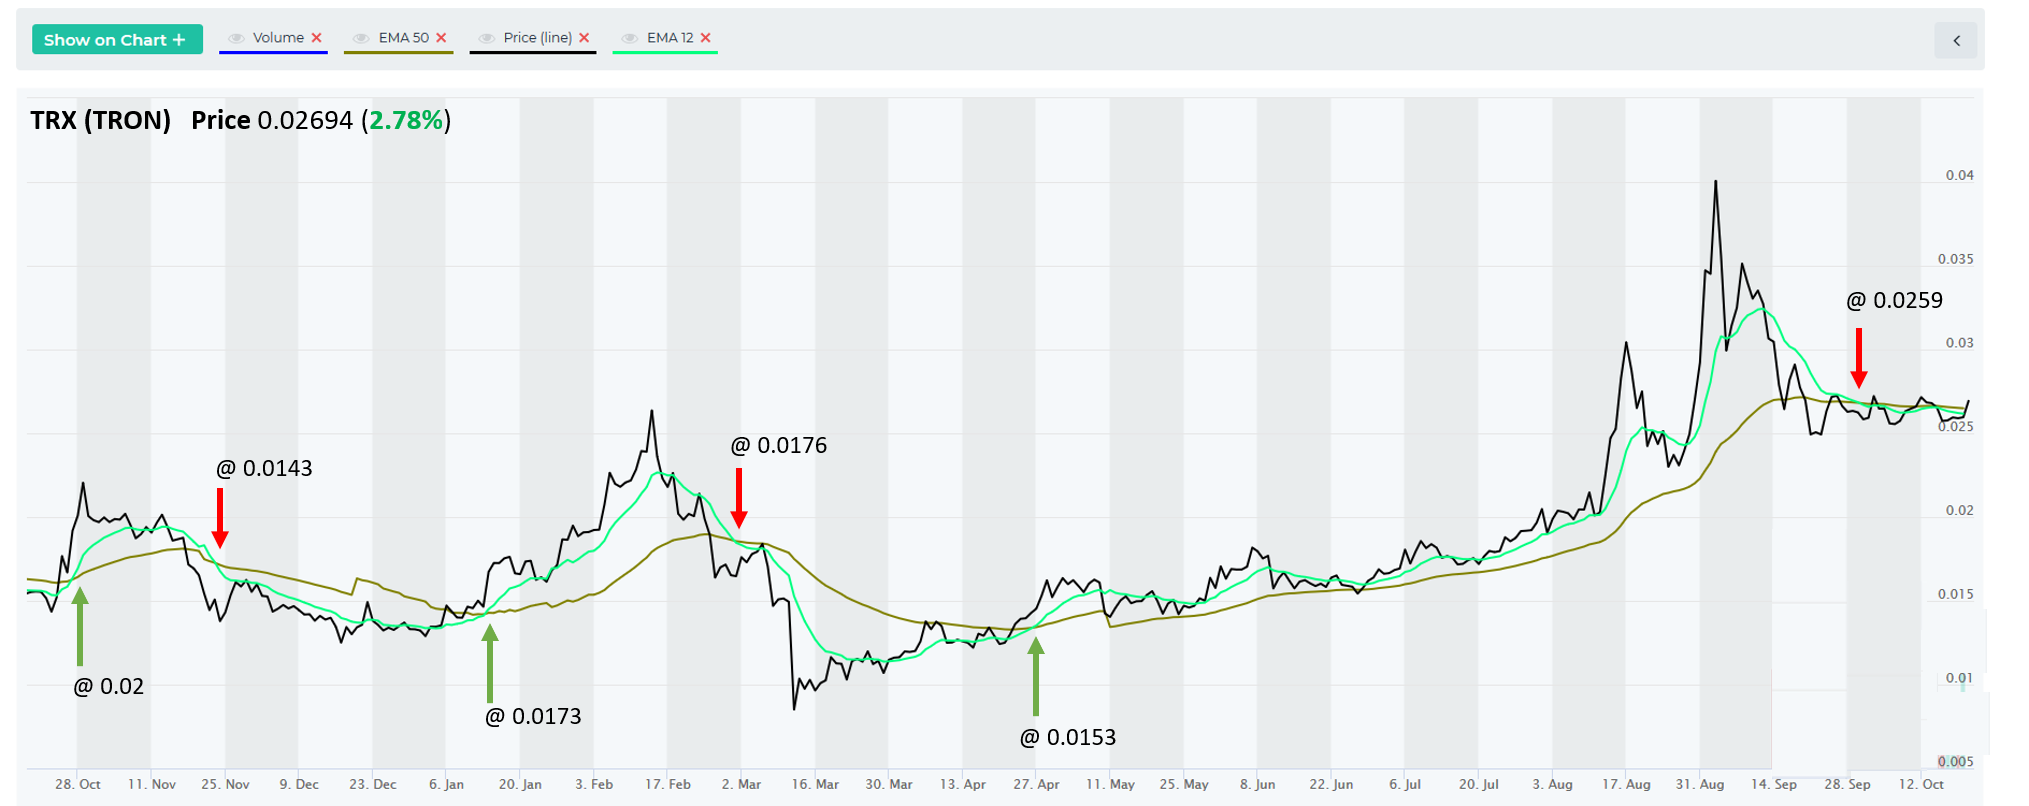
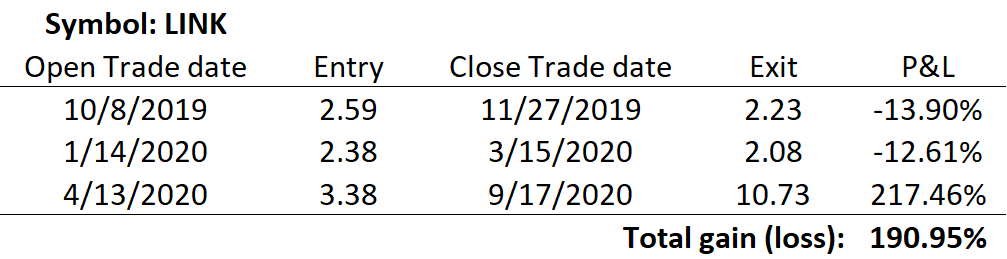
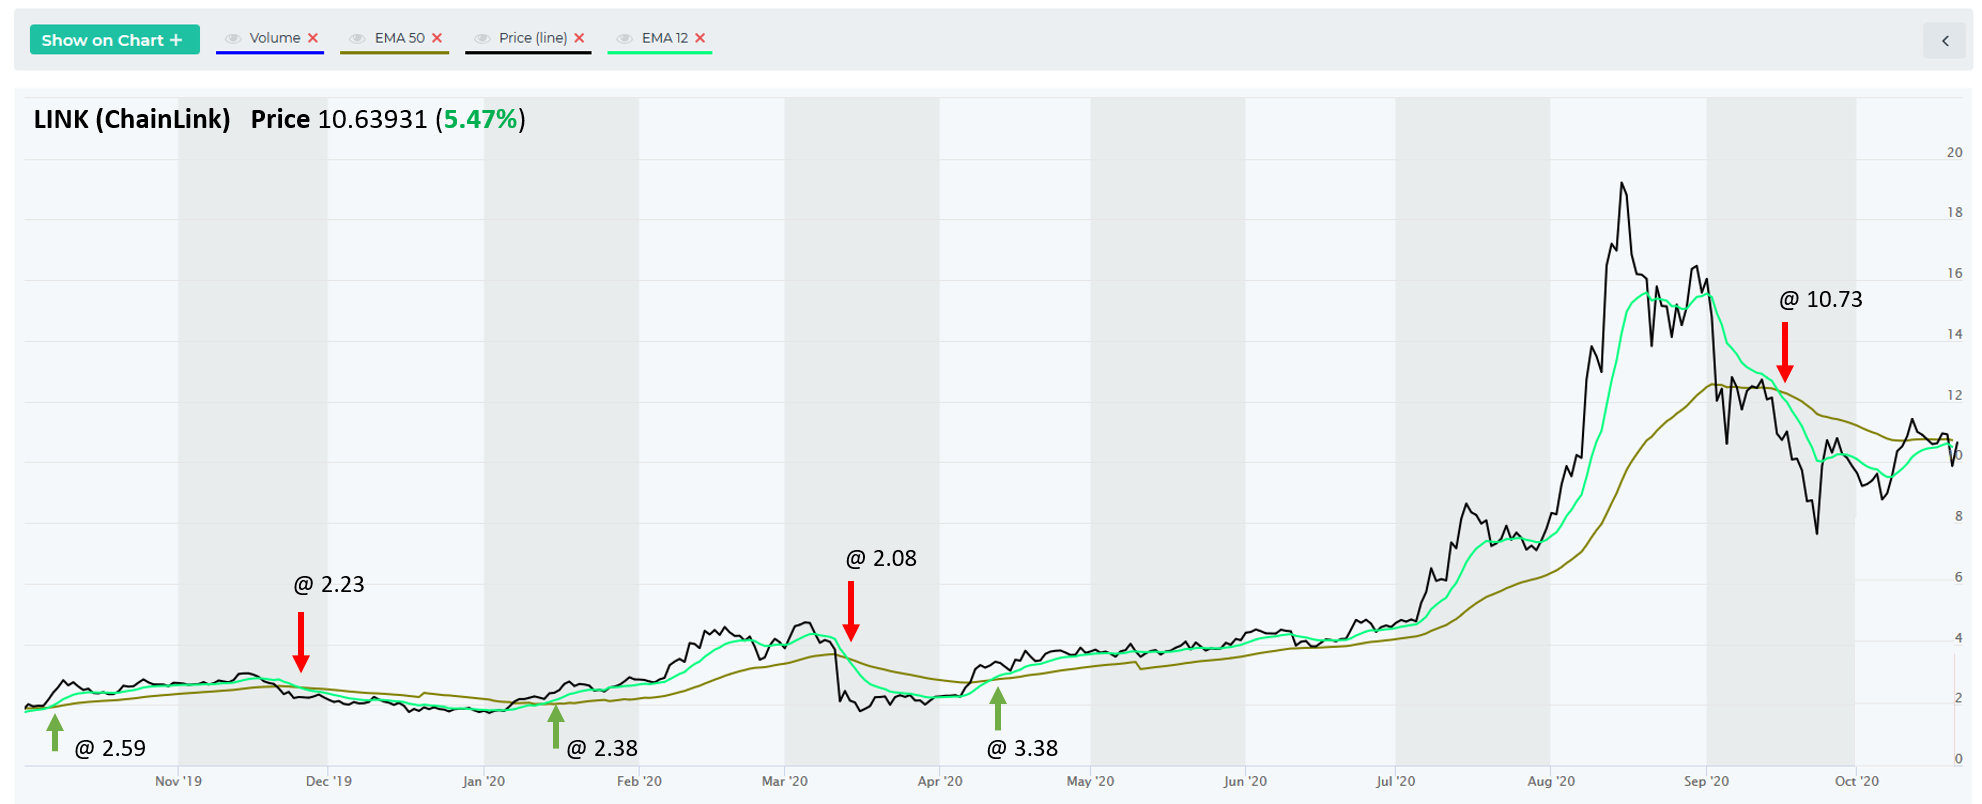
Let’s look at some past examples:
(note that our performance calculations use closing price one day after crossover day, to be conservative)
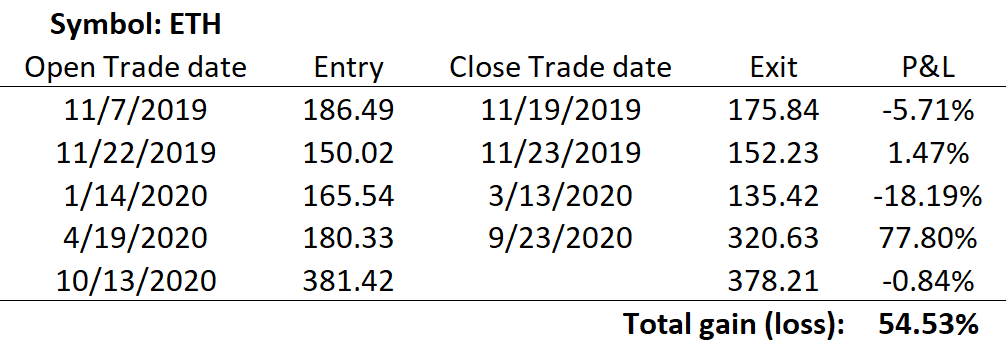
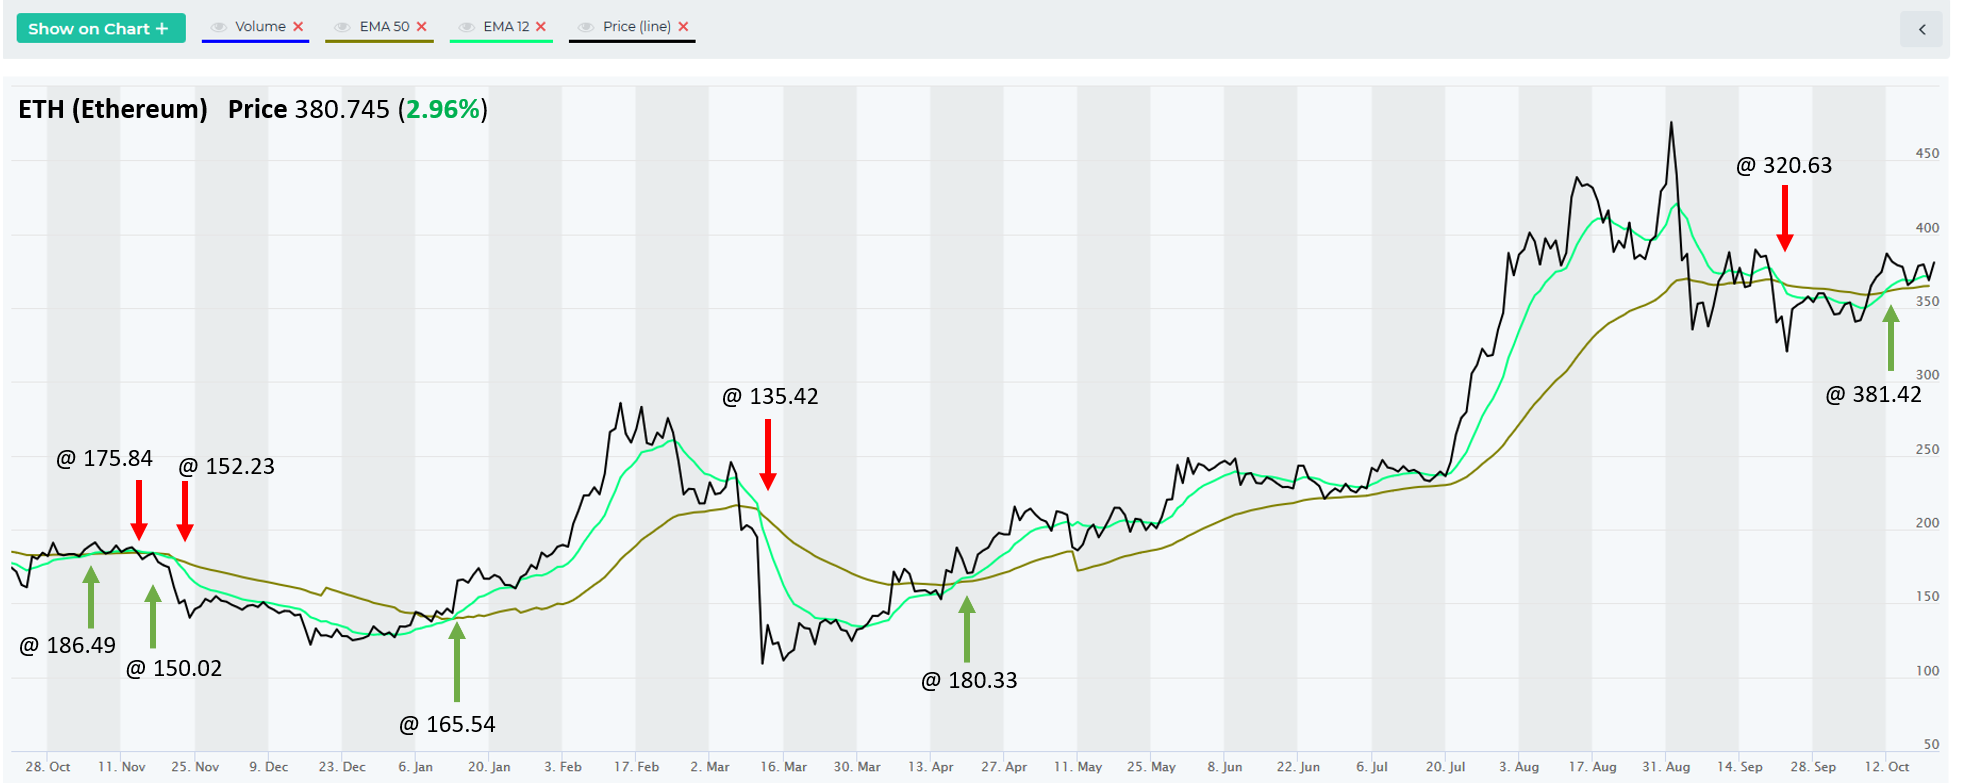
This EMA crossover strategy, like many others using indicators, has a weakness – it may lead to whipsawing. That is, it may signal Buy only to signal Sell soon afterwards. This happens in times of sideways consolidation. EMA crossovers work best in trending markets.
If you’re in an overall sideways market, you may want to drop down to a timeframe or two to do shorter term EMA crossovers (4h or 1h).
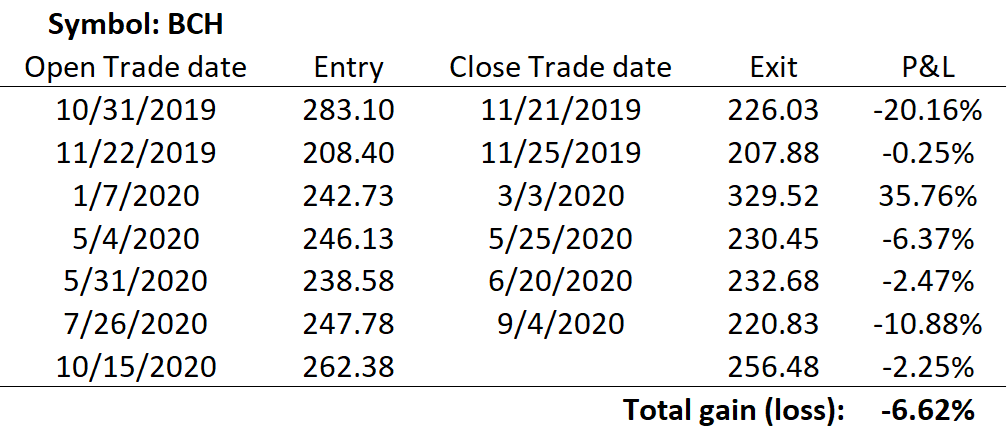
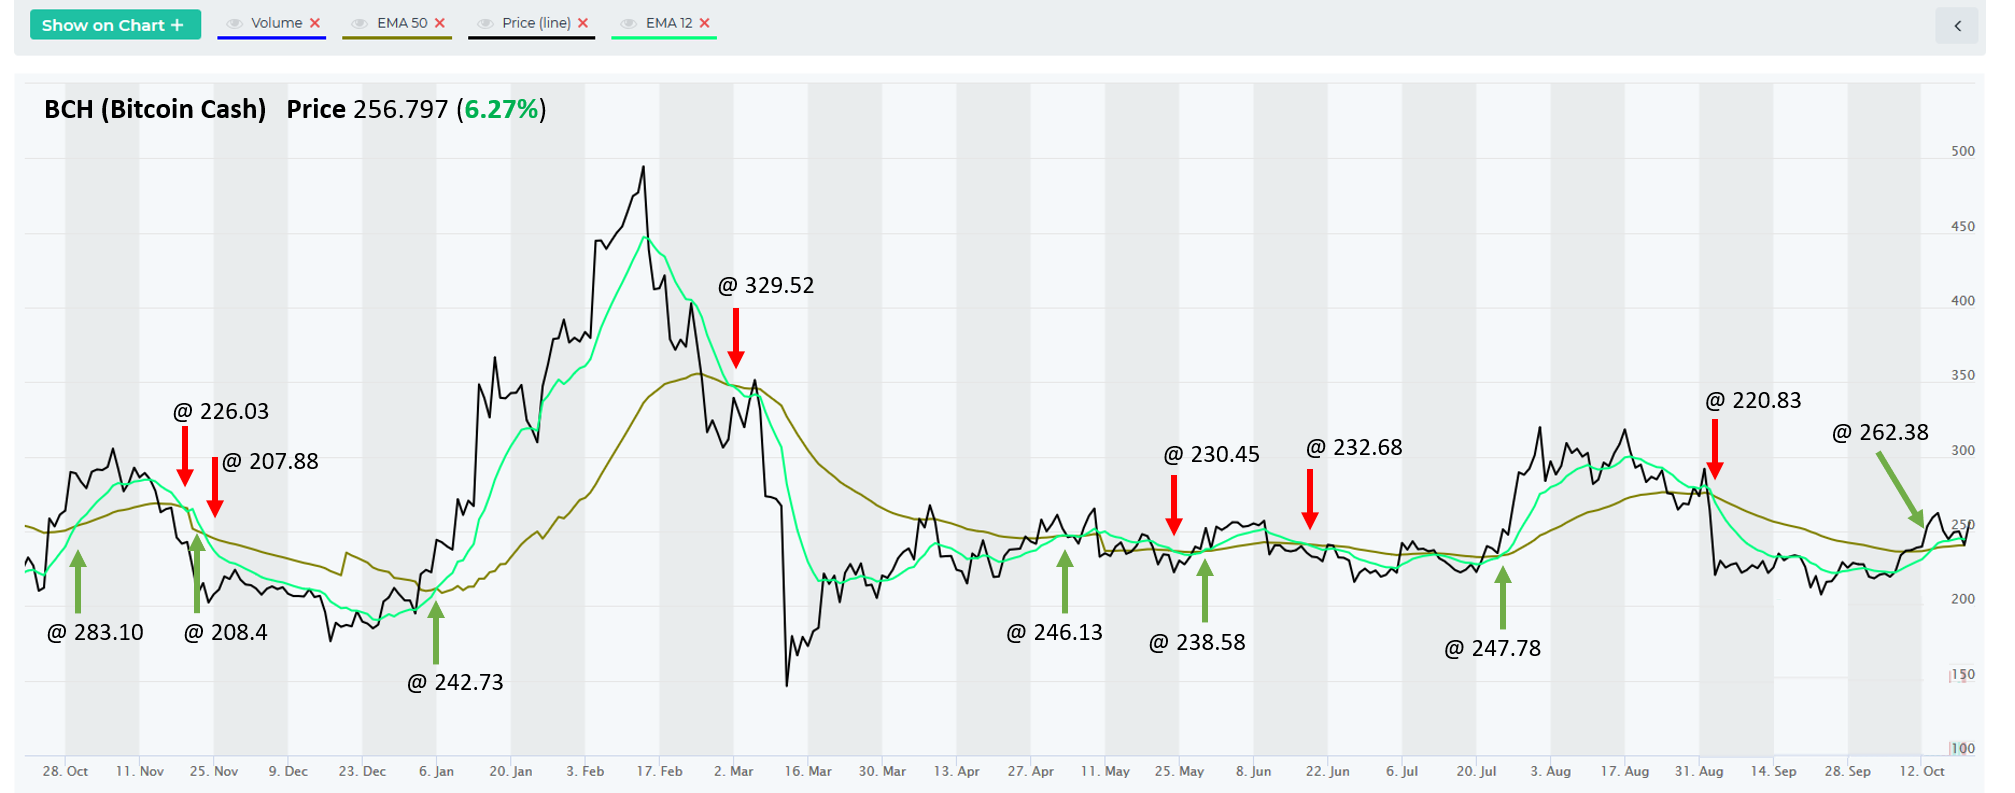
BCH is an example of where this strategy would get whipsawed in a sideways trading range, without catching a substantial uptrend.
EMA crossovers strategy work on any timeframe (15 min, 1h, 4h, 12h, 1d). You can use lower time frames for shorter trades and higher timeframes for longer. Lower timeframe is more subject to noise and false signals, so it’s not recommended under 1h.
Also, ideally, only take LTF (lower time frame) trades in the direction of the HTF (higher time frame)
Also, the long term positioning of EMAs helps avoiding whipsaw trades (whether 14/50 EMA are above or below the 200 EMA on the daily chart). 200 day EMA is a good indicator of a long term trend.
For newbies, you can put the odds in your favor by only taking buys in an uptrend (aka “Buy the dips”) or sells in a long term downtrend (aka “Sell the pullbacks”).
EMA Crossovers explained
Exponential Moving Average (MA) cross-overs are powerful signals for assessing price trends.
EMA cross occurs when a short-term EMA crosses the long-term EMA, either above (bullish, uptrend) or below (bearish, downtrend). altFINS allows you to compare EMAs. For instance, you can find coins where 5-day EMA has crossed the 10-day EMA. You can also indicate by how much (%) is the 5-day EMA above or below the 10-day EMA. You can also combine multiple EMA crosses (5/10, 5/20, 5/30, or 5/10, 10/20, 20/30, etc.) to strengthen the signal power of your screen.
