Search Knowledge Base by Keyword
How To Find And Trade Crypto Pullbacks In Uptrend (Buying Dips)?
Update January 2025: This is a crypto trend following strategy
Crypto pullbacks can often provide opportunities to jump on an established trend. It’s difficult to catch a crypto trend in early phases and conservative traders prefer to jump in midstream, once a trend is established. Even in a crypto UpTrend, prices never go straight up, day after day. There are times when price consolidates, pulls back, and then resumes an UpTrend. These corrections are opportunities to join a crypto trend. And this applies to crypto DownTrends as well, for those who like to Short Sell.
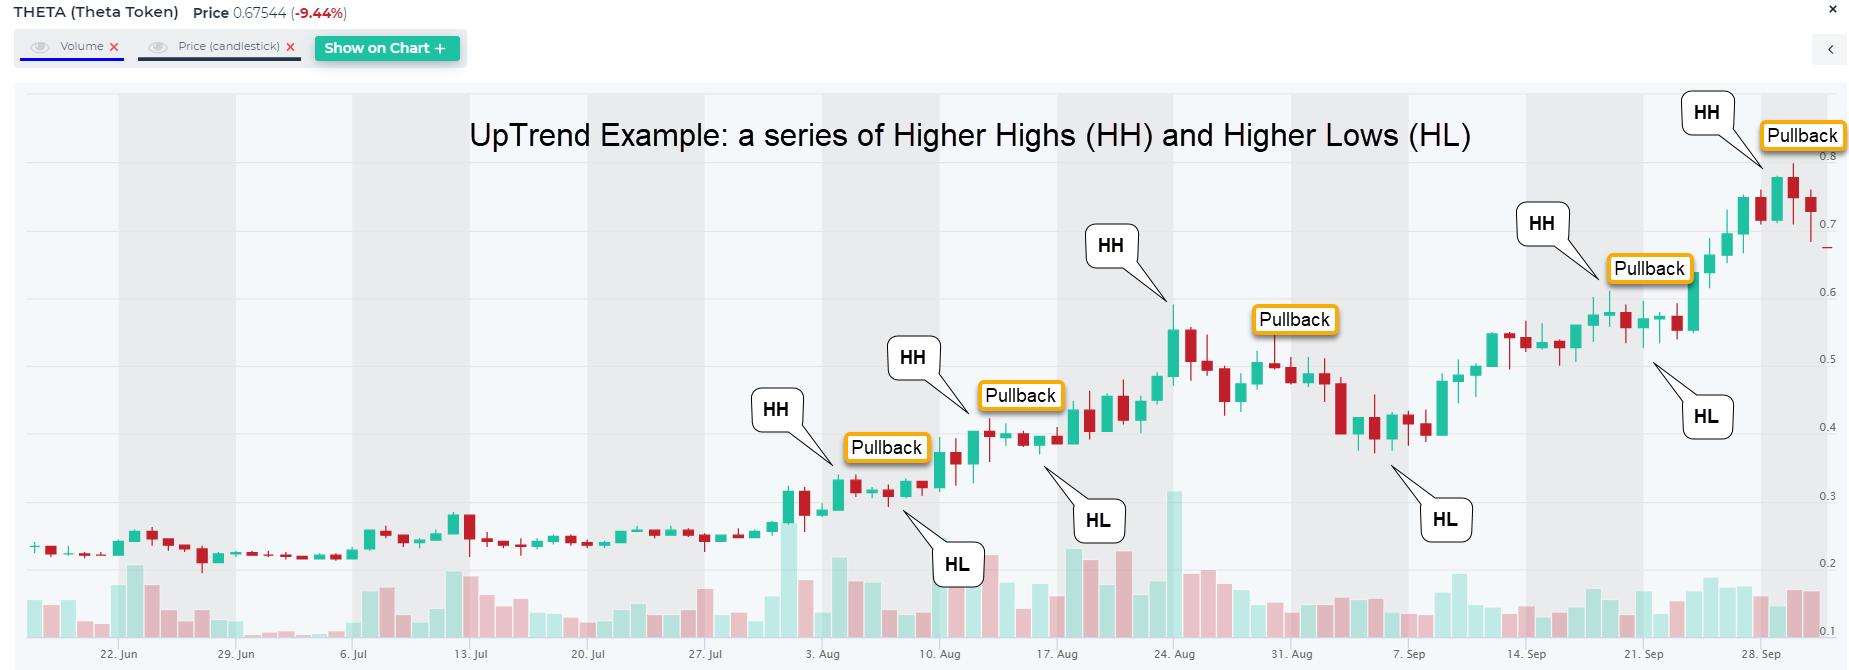
An UpTrend’s definition is when the price forms Higher Highs (HH) and Higher Lows (HL). DownTrend is the opposite – Lower Highs (LH) and Lower Lows (LL). After running this screen, traders should visually confirm the HH and HL for an UpTrend or LH and LL for a Downtrend, as indicated in the example with THETA.
You can also modify this screen, make it your own, and save it.
Also, check out our blog.
What is a Pullback in Crypto Trading?
A pullback refers to a temporary decline in price during an ongoing upward trend. In crypto markets, a pullback can last anywhere from a few hours to several days, depending on market volatility and external factors like news or regulatory announcements. However, this minor drop in price is often viewed as a buying opportunity for traders, especially those who missed entering during the initial trend reversal.
Pullbacks allow traders to purchase an asset at a discounted price before the market resumes its bullish trajectory. The key is to identify whether the pullback is a minor correction or the start of a full-blown reversal. Using technical indicators can help clarify this distinction.
The trading rules of this trading strategy are:
-
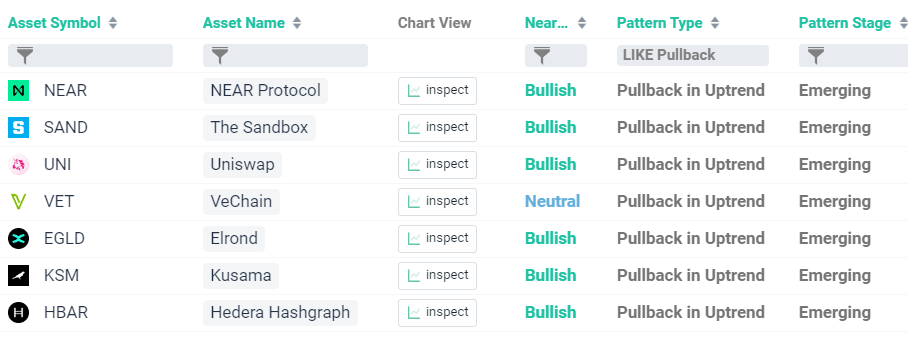
Find coins in an uptrend that pulled back in the last 7 days (1W)
-
Visually check charts to identify nearest support level
-
Buy near support level
AAVE (AAVE) – Bullish, Pullback in Uptrend
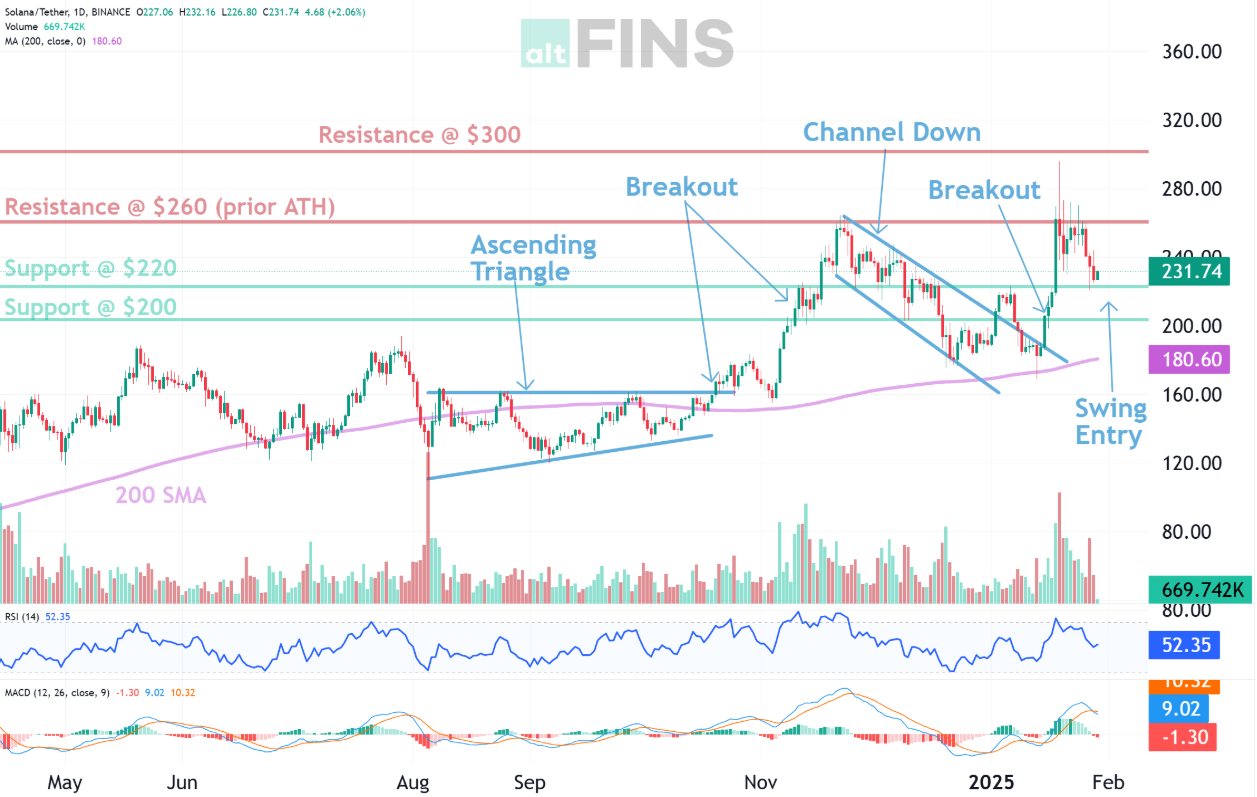
Trade Setup: Price broke out of a Channel Down pattern and above $200 key level. We would be buyers on pullbacks to $200 – $220 support zone, with +30% potential upside back to $260 (PT1) or even $300 (PT2).
Why Do Pullbacks Happen in Uptrends?
Even in strong uptrends, prices never move in a straight line. Pullbacks occur due to several factors:
- Profit Taking: After a significant price surge, early investors or short-term traders may begin to take profits, causing a temporary dip in price.
- Market Sentiment: Crypto markets are driven by emotional factors. Fear and greed can cause exaggerated price movements, leading to brief corrections before the overall trend resumes.
- Overbought Conditions: After a prolonged upward move, prices might reach overbought levels on technical indicators like the Relative Strength Index (RSI). When this happens, some traders expect a correction, causing a pullback.
- External Events: News, regulations, or announcements from influential figures can trigger temporary corrections even during a strong uptrend.
altFINS helps you identify coins with Pullback in uptrends in few seconds…
You can find such trading opportunities in three sections:
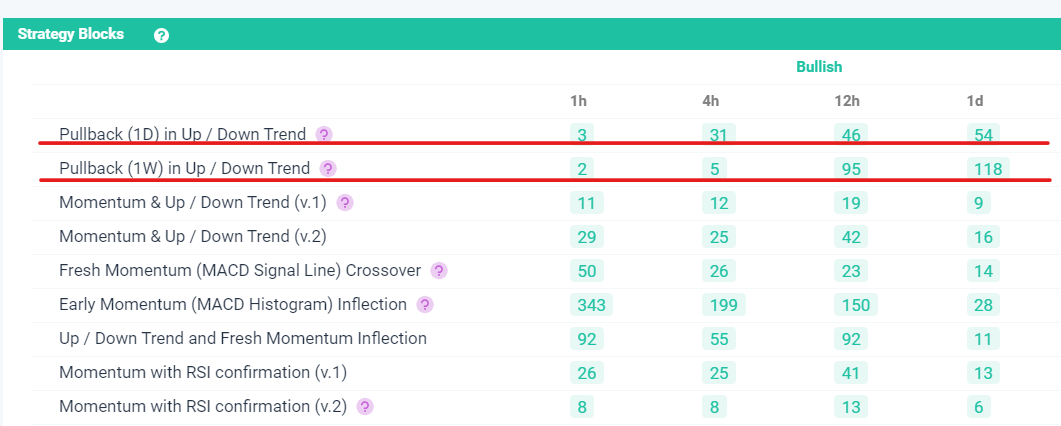
1. Screener > Pre-set Filter > select Pullback (1W) in Uptrend
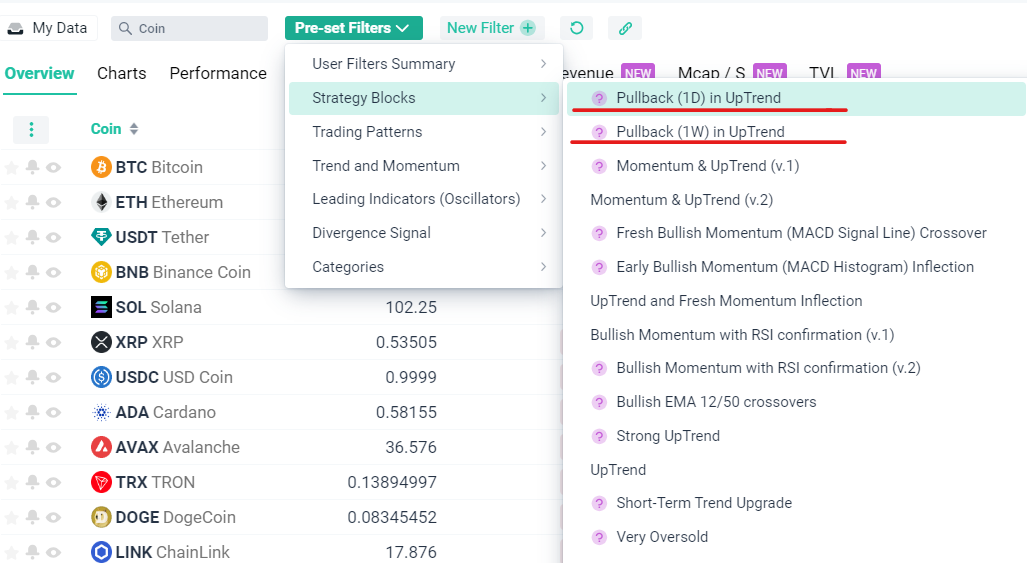
2. Signal Summary
3. Technical analysis
4. Crypto Market Highlights
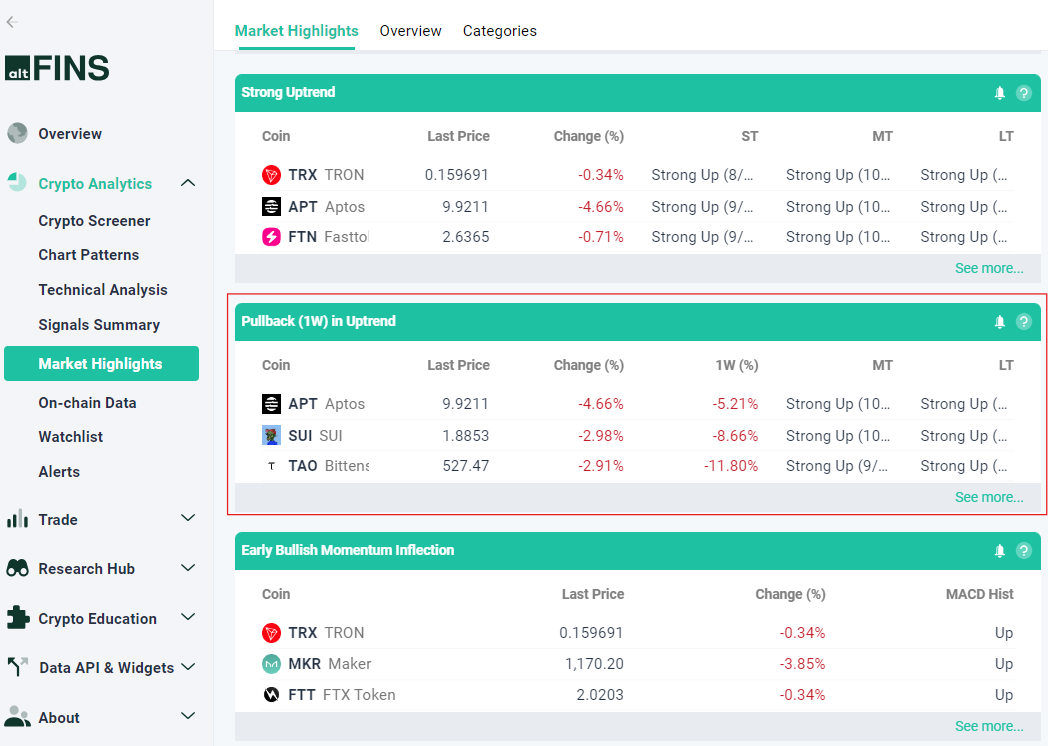
A “pullback in uptrend” is a technical analysis term used in crypto trading to describe a price movement where a coin experiences a temporary reversal in price, before continuing its upward trend.
In this strategy, traders look for opportunities to enter the market at a lower price during the pullback, with the expectation that the asset will continue its overall upward trend and eventually reach higher prices.
The basic idea behind this strategy is that market participants tend to overreact to short-term fluctuations in price, causing temporary dips or pullbacks in an otherwise bullish market.
As a result, traders who can identify these pullbacks can buy the asset at a lower price, with the expectation that it will continue its upward trajectory.
To implement this strategy, traders typically use technical indicators such as moving averages or trendlines to identify key support levels and potential entry points.
Once they have identified these levels, they can set buy orders at a lower price, with a stop loss set at a level that will limit their losses if the market turns against them.
Sreen definition (for bullish):
- Short Term Trend is Strong Up
- Medium Term Trend is Strong Up
- Long Term Trend is Strong Up
- Oscillator Rating is Neutral (don’t want overbought situations)
- Bullish MACD crossover (MACD is above 100% of MACD Signal Line) – this further confirms our Uptrend signal
- Volume ($) is above 200,000 (need decent liquidity)
- Price Change (%) is below 0% (i.e. price has pulled back in the last 24 hours)
Identifying the Best Time to Buy the Dip During a Pullback
The core of a successful pullback strategy is timing. Entering too early can result in further losses if the pullback turns into a larger correction. Entering too late may mean missing out on the upside potential. Here are some steps to identify the best entry point during a pullback:
Look for Support Levels
- Support levels are price zones where the asset has historically struggled to fall below. These levels act as a floor where the price may stabilize before resuming the uptrend. Identifying key support levels on a chart can give you an idea of where to set your buy orders.
- Example: If the price of Ethereum has consistently bounced from the $2,000 level during an uptrend, this would be considered a strong support zone.
Use Moving Averages to Find Dynamic Support
- Moving averages (MA) act as dynamic support levels during an uptrend. A commonly used indicator is the 50-day moving average (50 MA). When the price pulls back and touches or approaches this level, it can signal a good buying opportunity.
- Example: If Ethereum’s price pulls back and finds support at the 50 MA, this could be a sign to enter a long trade, anticipating that the price will bounce off this levels.
Watch for RSI Reversals
- A helpful way to confirm the end of a pullback is by monitoring the Relative Strength Index (RSI). During a pullback, the RSI often moves out of overbought territory (above 70) and may enter neutral or oversold territory (below 30). When the RSI reverses and moves back up, this can confirm that the uptrend is ready to resume. Learn more about RSI in this article.
Best Indicators for Trading Pullbacks in Crypto Uptrends
Using a combination of technical indicators is crucial when trying to time pullback entries effectively. Below are some of the most reliable tools for identifying potential pullbacks:
Moving Averages (MA)
- Moving averages smooth out price data and help identify the direction of the trend. The 50-period MA is particularly useful for identifying short-term pullbacks, while the 200-period MA can be used to confirm long-term trends.
- How to use: If the price retraces to or near the 50 MA during an uptrend, it often presents a buying opportunity. Additionally, the 200 MA can act as a longer-term support level in stronger trends.
Fibonacci Retracement Levels
- The Fibonacci retracement tool helps traders identify potential reversal levels based on natural market dynamics. Key retracement levels include 38.2%, 50%, and 61.8%, and these levels often act as support zones during pullbacks.
- How to use: If Bitcoin is in an uptrend and pulls back to the 38.2% retracement level, it might signal a good entry point to buy, especially if this level aligns with a previously established support zone.
MACD (Moving Average Convergence Divergence)
- The MACD indicator is a popular momentum indicator that helps confirm trend strength and direction. A bullish MACD crossover (when the MACD line crosses above the signal line) during a pullback can provide additional confidence that the uptrend is ready to resume.
- How to use: When the price pulls back to a key support level, and you see a bullish MACD crossover, it signals a good buying opportunity in line with the ongoing uptrend.
