Search Knowledge Base by Keyword
How to trade cryptocurrencies?
Are you trading or considering trading cryptocurrencies (altcoins)? Then this article is a must read. It will give you six concrete trading strategies and tips to follow, as well as direct you to resources for altcoin analysis and finding trading ideas.
This article covers the following topics:
- What do I need to invest or trade cryptocurrencies?
- What are the differences between centralized and decentralized exchanges?
- What are the differences between investing and trading cryptocurrencies?
- What crypto trading strategy should I use?
What do I need to invest or trade cryptocurrencies?
You need access to an exchange to trade crypto, and a way to deposit your fiat money (USD, EUR) to buy crypto. You also need a tool to scan the crypto market for trading ideas and strategies.
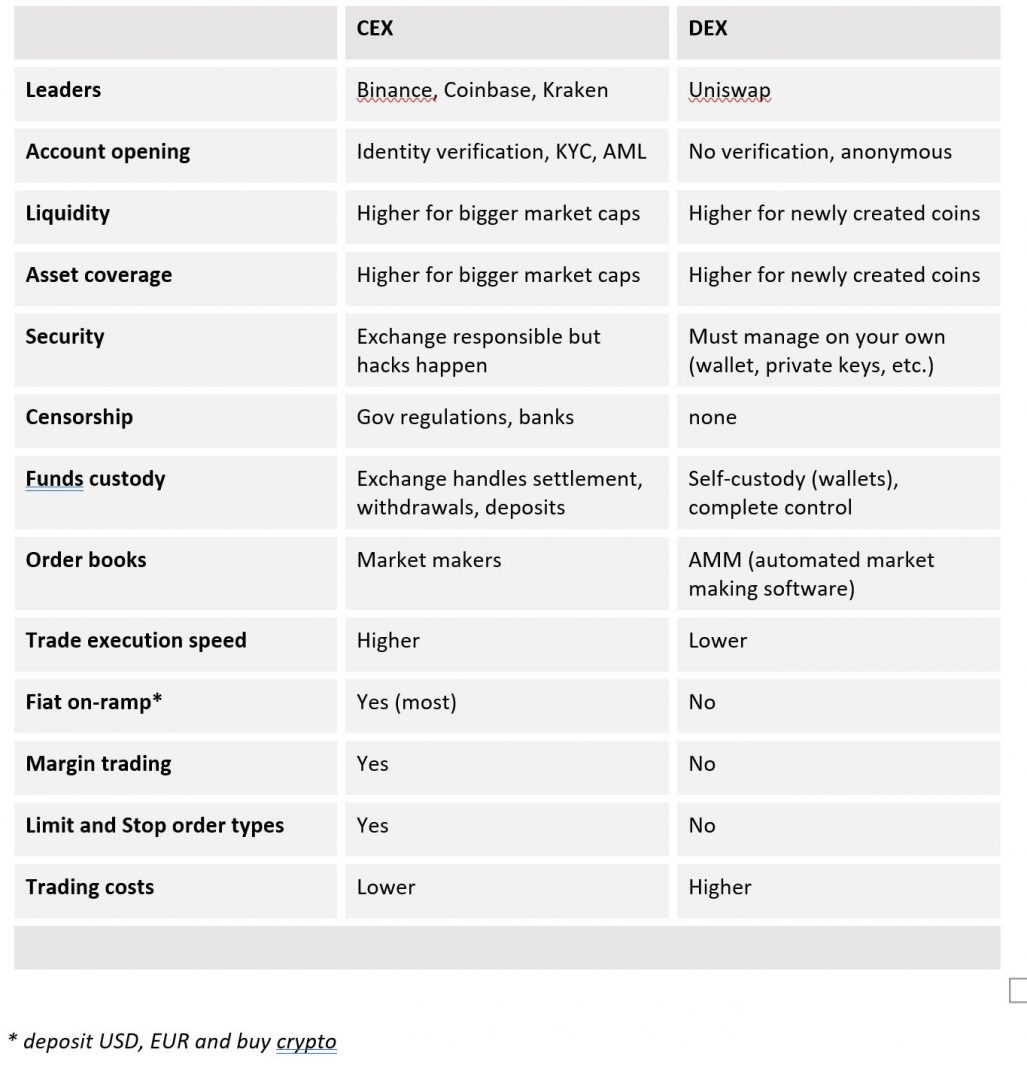
There are two types of exchanges: CEX (Centralized Exchanges) like Binance, Coinbase, Kraken, and DEX (Decentralized Exchanges) such as Uniswap.
Traders usually start with CEX and add DEX when they start looking for new altcoins listings. But if you’re looking to systematically trade altcoins, you need solid liquidity, low fees, and fast trade execution, which means CEX is still the way to go.
CEX still have several times greater volumes than DEX, although the latter is rapidly gaining ground.
CEX are often regulated entities and as such, require proper user registration, identity verification, even KYC and AML. The benefit is that traders have access to customer support and recourse when dealing with issues. CEX typically allow users to deposit fiat and convert into crypto, although some are just crypto to crypto exchanges (not fiat on-ramp).
DEX are basically peer-to-peer (P2P) platforms and work directly with users’ crypto wallets like MyEtherWallet or MetaMask. There is no registration, it’s completely anonymous. Hence, the benefits. But users don’t have access to any customer support and have to safeguard their own wallet keys.
The big advantage for DEX is that they list new crypto projects earlier than CEX. So if you’re looking for potentially giant gains on newly created blockchain projects (DeFi, NFTs), DEX is the way to go.
CEX versus DEX comparison
Additional resources:
What are the differences between investing and trading cryptocurrencies?
Investing typically refers to longer term holding of cryptocurrencies (aka HODLing) while trading implies more frequent buying and selling of altcoins.
Investing is often based on fundamental research and analysis of crypto projects including their use case, tokenomics, product roadmap, competition, founders, mining network, level of decentralization, token supply, on-chain data, etc.
Cryptocurrency trading is driven by various strategies including news driven, sentiment driven, technical analysis, arbitrage, etc.
Additional resources:
- How to find new altcoin listings
- Coin descriptions
- Crypto coin screener
- News sources: altFINS, Messari, Coindesk, DeFi Pulse, IntoTheBlock
What cryptocurrency trading strategies should I use?
There’s a myriad of strategies to trade cryptocurrencies but here are six basic trading strategies for traders with any level of experience:
Strategy #1: Trading moving average crossovers. This is a simple and powerful trend trading strategy. Find a trend and ride it for big gains. Moving averages are used to spot trends. (see details below)
Strategy #2: Pullback in Uptrend. This is another trend following strategy. Pullbacks can often provide opportunities to jump on an established trend.
Strategy #3: Momentum & Uptrend. Another trend following strategy, that looks for altcoins in a long-term uptrend and a recent bullish momentum upswing.
Strategy #4: Range trading. Range-bound trading is a swing trading strategy that seeks to identify and capitalize on altcoins trading in price channels.
Strategy #5: Trading key levels. Trading around Support and Resistance levels is a foundational strategy that can be integrated into many others.
Strategy #6: Chart pattern trading. altFINS is the only crypto platform that automatically identifies 16 common chart patterns that you can easily leverage for trading. It even indicates expected price path and target.
These six trading strategies are ready for use on altFINS platform, which is a unique screening and analysis tool for active traders looking for trading ideas. altFINS is the only crypto platform that automatically recognizes chart patterns and makes price movement predictions.
Strategy #1: Trading using moving average crossovers (show such coins now)
Beginner traders should stick to trend trading strategies. Trend is your friend, goes the old adage. That means, find an uptrend, and ride it for potentially big gains.
How do you find a trend? Using moving averages.
Moving averages are used to spot trends. Simply put, if a moving average is upward sloping, the trend is up, and vice versa. altFINS calculates Simple Moving Averages (SMA) and Exponential Moving Averages (EMA).
You can read about differences between Simple Moving Average (SMA) and Exponential Moving Average (EMA), but in short, EMA puts greater weight on the most recent prices, and thus has less lag than SMAs. Hence, EMA reacts quicker to price changes and provides an earlier trend signal than SMAs.
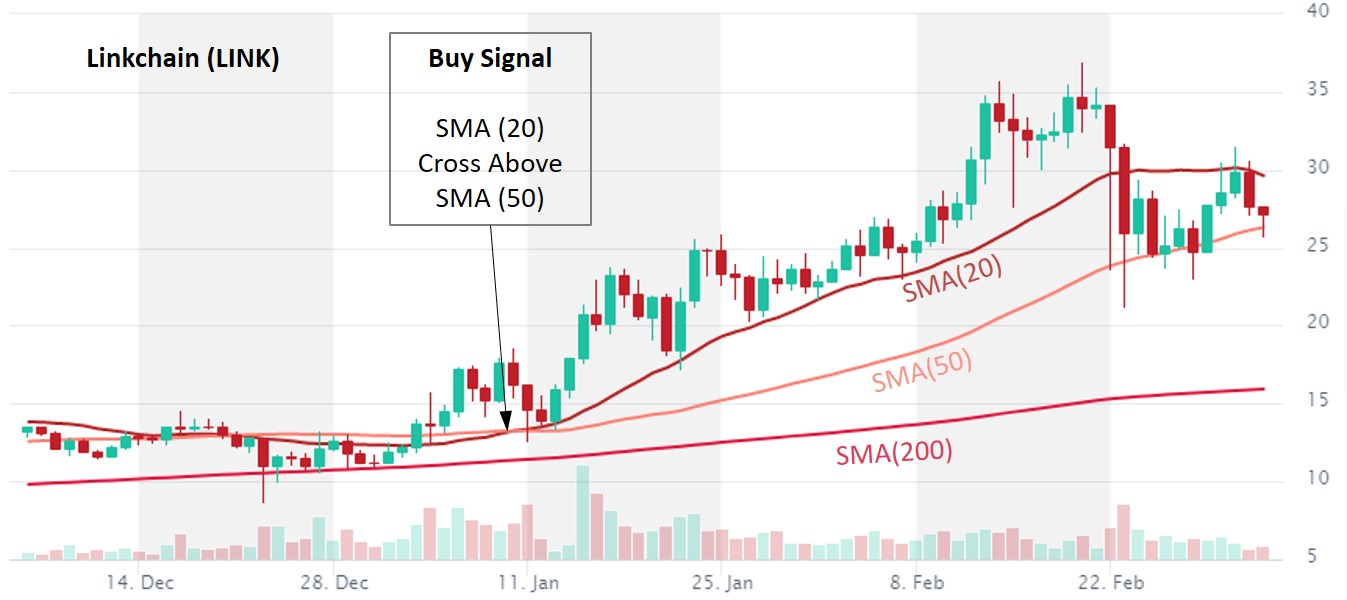
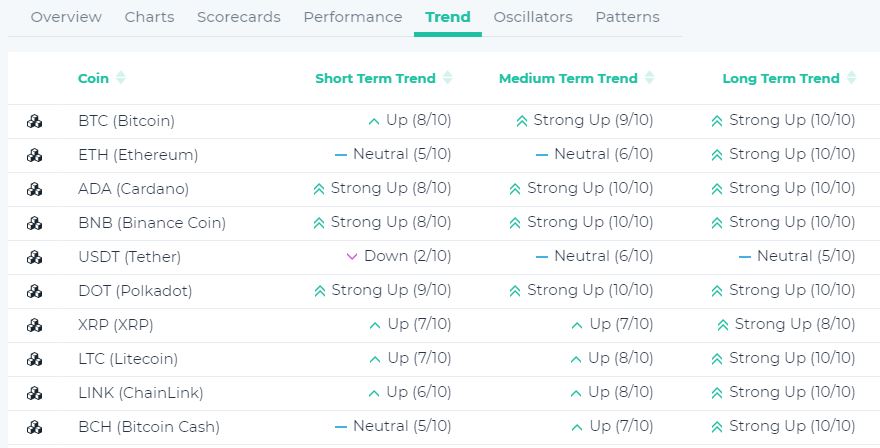
Note Linkchain chart below. Price appears in an uptrend on Long-Term (SMA 200) and Medium-Term (SMA 50), but Short-Term appears to be flatlining (SMA 20 slope).
For more examples of moving average crossover trading strategies, check here.
Trading rules:
- Buy when shorter SMA (or EMA) crosses above longer SMA (or EMA). In the Linkchain chart, Buy signal was generated when SMA (20) crossed above SMA (50).
- Sell when shorter SMA (or EMA) crosses below longer SMA (or EMA).
There are many moving average crossover trading possibilities (EMA 12/26, EMA 26/50, SMA 5/10, SMA 10/30, etc.). Which EMA or SMA should you trade? Read here.
You can improve your success rates (reduce false signals) by combining moving average crossovers with other indicators like MACD (momentum), RSI, and OBV, among others.
altFINS allows you to compare SMAs or EMAs. For instance, you can find coins where 5-day EMA has crossed the 10-day EMA. You can also combine multiple EMA crosses (5/10, 5/20, 5/30, or 5/10, 10/20, 20/30, etc.) to strengthen the signal power of your screen.
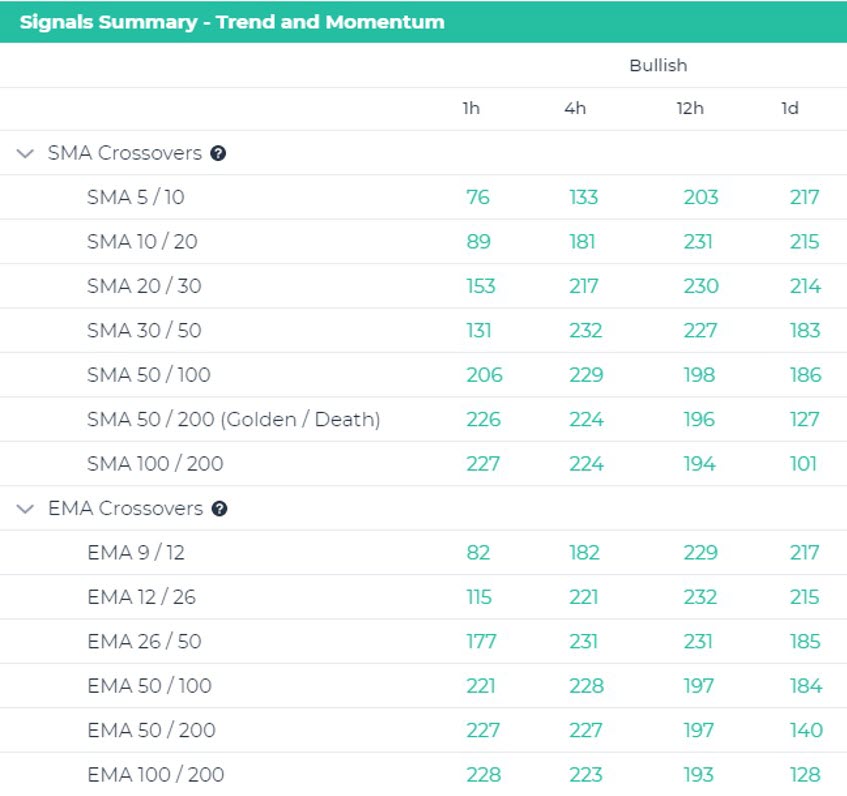
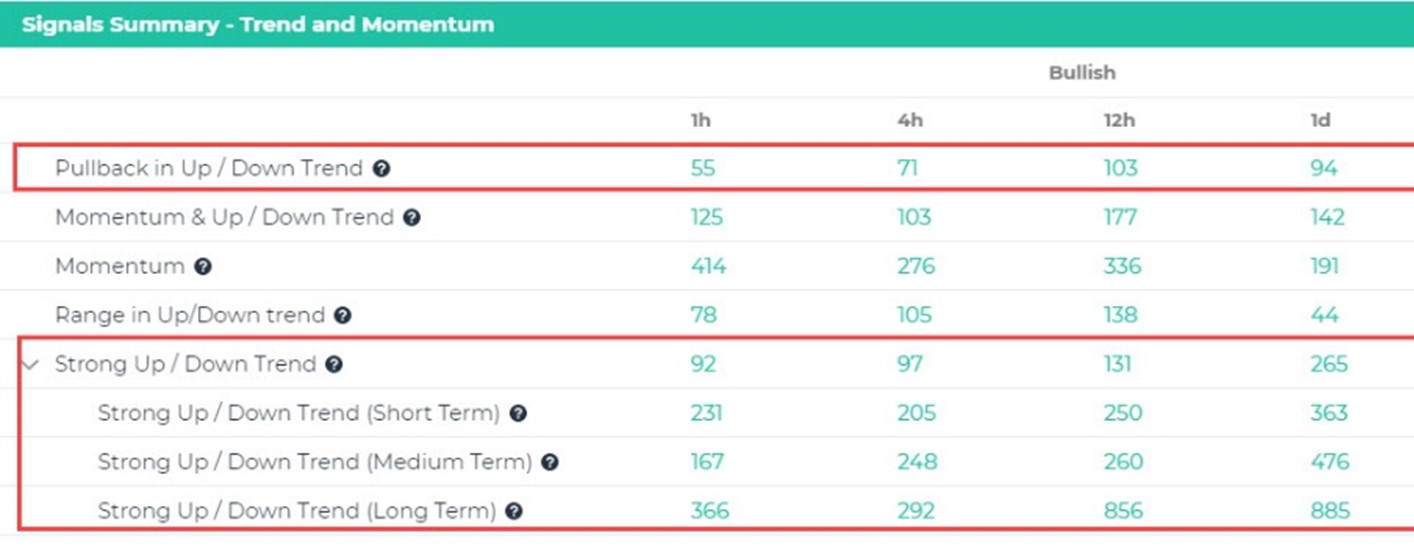
To quickly and easily find cryptocurrencies with EMA or SMA crossovers, bullish or bearish (across 4 time intervals), check our Signal Summary page. altFINS constantly scans over 1,500 altcoins to identify signals:
Additional resources
How to buy altcoins during a Pullback in Uptrend video
Strategy #2: Pullback in uptrend (show such coins now)
This is another simple but powerful trend trading strategy. Pullbacks can often provide opportunities to jump on an established trend.
It’s difficult to catch a trend in early phases and conservative traders prefer to jump in midstream, once a trend is established.
Even in an Uptrend, prices never go straight up, day after day. There are times when price consolidates, pulls back, and then resumes an Uptrend. These corrections are opportunities to join a trend. And this applies to Downtrends as well, for those who like to Short Sell.
Ideally, during a pullback, price touches and bounces off a support level. This is potentially a good entry point. Some traders prefer to wait for price to surpass prior high, as an indication that Uptrend will continue.
Trading rules:
- Find altcoins in an Uptrend but have had a 5%+ pullback (a correction, consolidation)
- Identify a Support Zone. This is often prior Resistance Zone or prior high point.
- Selling volume dries up during the pullback.
- Buy if the price is near or touches a Support Zone.
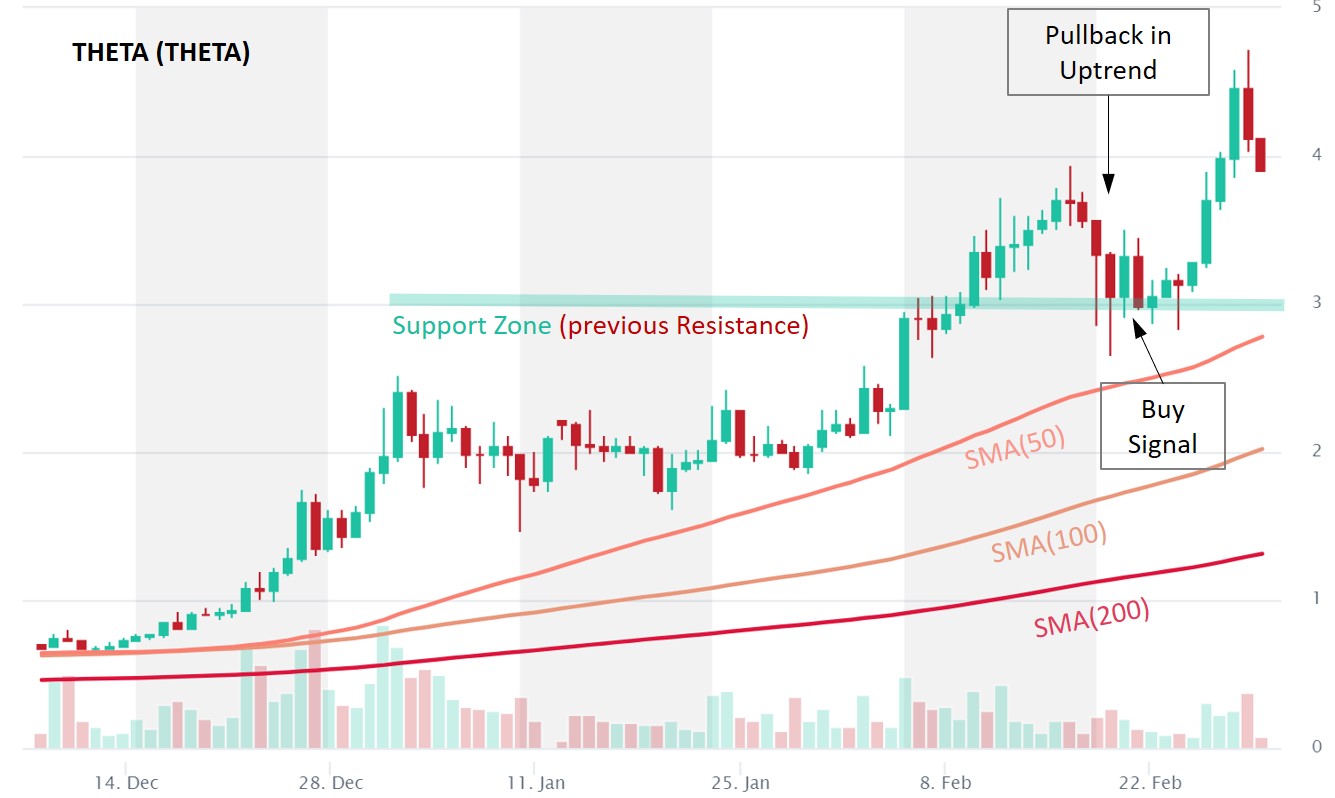
In the THETA example below, notice that price is in an Uptrend across Short-, Medium- and Long-Term (50-day, 100-day and 200-day moving averages sloping up) and there was a pullback that touch Support Zone (~$3.00), which was previously a Resistance Zone. That’s an opportunity to hop on the Uptrend.
This strategy is part of altFINS’ Signal Summary page, where altFINS identifies altcoins with a pullback in Uptrend, across four time intervals (1h, 4h, 12h, 1d):
To identify an uptrend, you can either check the slope of moving averages, visually check a chart for price making Higher Highs and Higher Lows, or you can use altFINS’ platform to screen for altcoins in an Uptrend
WATCH A VIDEO explaining this strategy with real example (WAVES).
altFINS continuously scans the market and evaluates price trends for thousands of cryptocurrencies:
Strategy #3: Momentum & uptrend (show such coins now)
This trading strategy looks for altcoins in an uptrend and identifies opportunistic entry and exit points using momentum indicators (MACD, RSI).
Moving Average Convergence/Divergence oscillator (MACD) is a simple and effective momentum indicator. It’s probably the most widely used crypto trading indicator.
MACD is used in various trading strategies but the simplest one is using MACD Signal Line crossover.
Trading rules:
- Find altcoins in an Uptrend
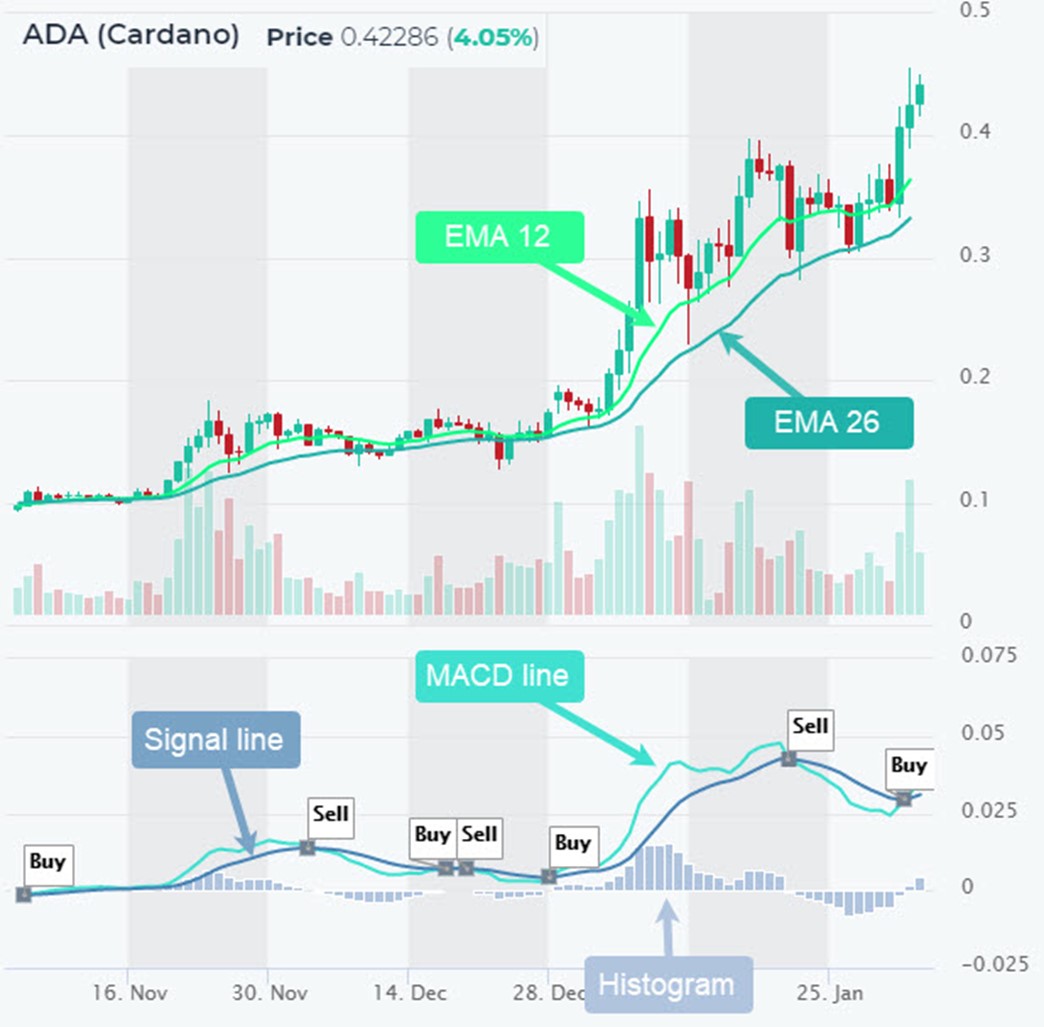
- Buy when MACD line crossed above MACD Signal Line
- Sell when MACD line crossed below MACD Signal Line
In the Cardano (ADA) chart below, not that altFINS automatically places a “Buy” and “Sell” signal when a MACD Signal Line crossover takes place. To find coins in an Uptrend and a bullish MACD crossover, go to altFINS’ Signal Summary page (coin scan labeled “Momentum in Uptrend”).
A slightly more aggressive (risky) strategy but with potentially bigger upside is to find peaks/troughs in MACD Histogram, as described here.
Additional resources:
How to trade MACD indicator video
Strategy #4: Trading ranges (show such coins now)
Trend following traders hope to catch a major up(down)trend, and ride it for days, weeks, maybe even months. But markets are in a trend only about 30% of the time! The rest of the time, markets are trendless.
Sounds boring? Think again. Just find trading ranges and have fun swing trading!
Range-bound trading is a trading strategy that seeks to identify and capitalize on coins trading in price channels. After finding major support and resistance levels and connecting them with horizontal trendlines (zones), traders can buy when the price approaches support and sell when it reaches resistance.
Technical indicators, such as the relative strength index (RSI), stochastic oscillator, and the commodity channel index (CCI), can be used to confirm overbought and oversold conditions when price oscillates within a trading range.
Trading rules:
- Find coins in an Uptrend on Long-term basis, but sideways (Neutral) trend on Medium- or Short-term basis.
- Identify Support and Resistance Zones
- Buy Support, Sell Resistance
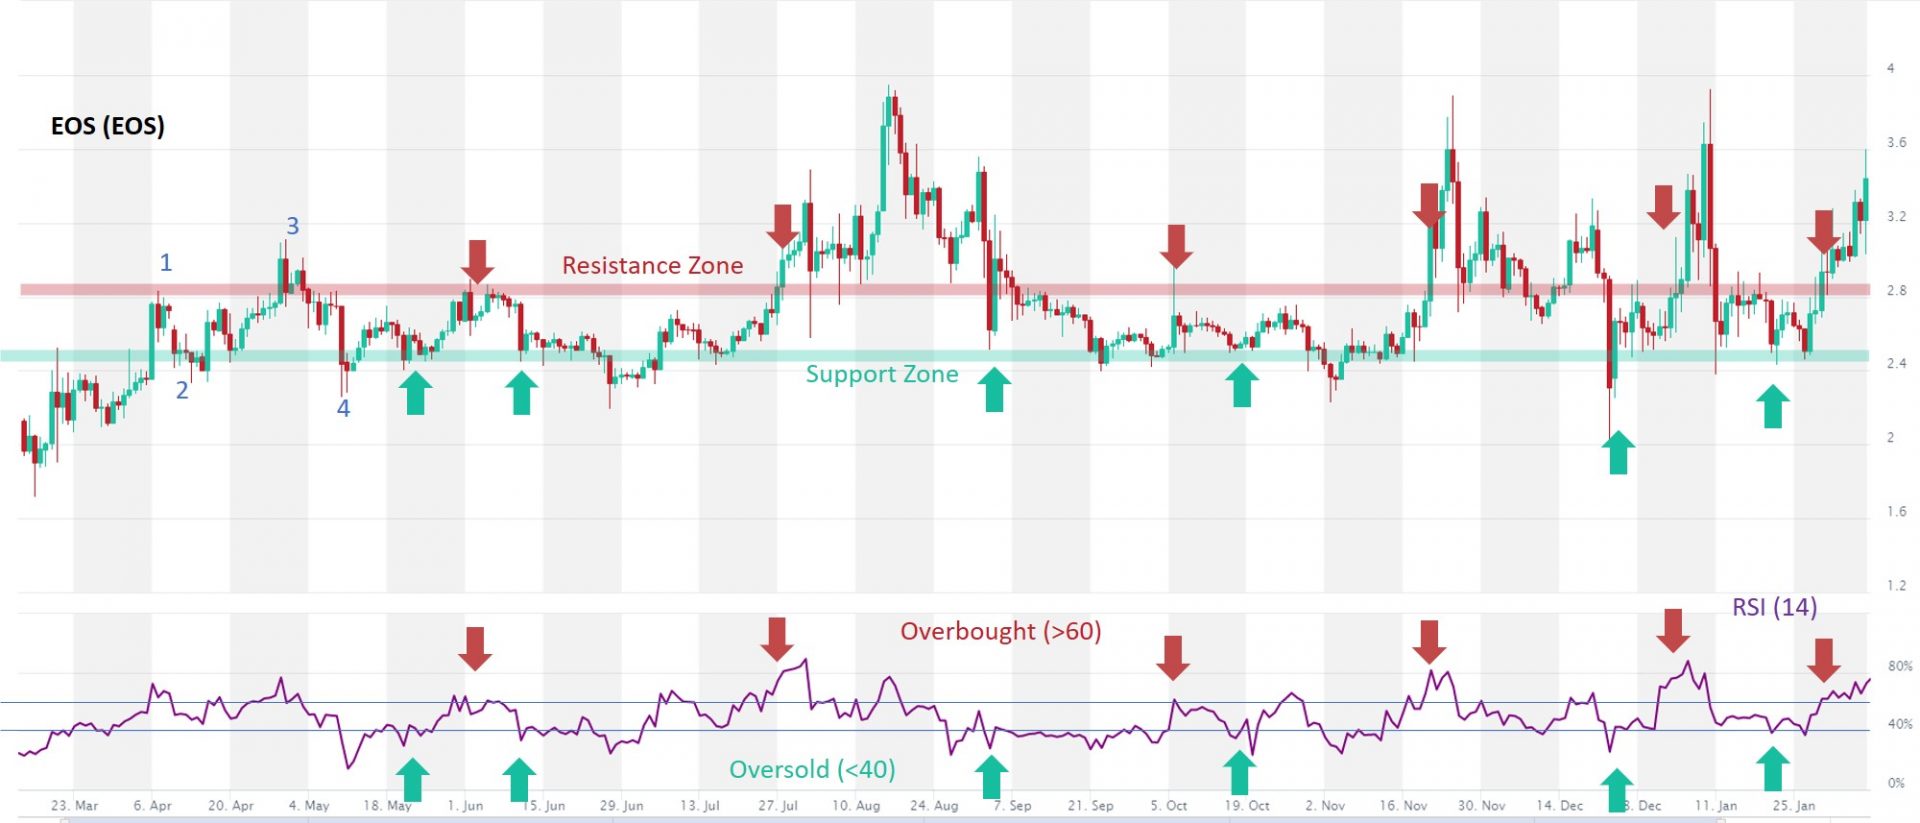
- More advanced version: Buy Support when RSI is Oversold (<40) and Sell Resistance when RSI is Overbought (>60)
In the EOS charts below, after establishing a Support (2, 4) and Resistance (1, 3) zones, a trader would patiently wait for price oscillating between these two zones, buying at Support and selling at Resistance. More advanced traders could combine it with an RSI indicator.
It is also recommended to trade with the trend. If EOS is in Long-Term uptrend, then trader would take sell at Resistance but not go Short. That way if EOS price breaks out of the sideways channel, the trader is positioned correctly.
Additional resources:
How to trade a range – read this blog and video
Strategy #5: Trading key levels (show such coins now)
In trading, much like in life, KISS works the best. Like with a 70%+ win rate. Trading around key levels is one of those KISS (Keep It Simple Stupid) opportunities that occur often. And they’re ideal for beginner traders.
Key levels (horizontal support and resistance) are pillars of technical analysis because these are areas where a lot of trading action happens!
Now, you could look at thousands of charts across multiple time intervals to identify support and resistance levels, or you can use altFINS’ automated chart pattern recognition to save a ton of time.
Let’s take a look at some of examples of trade setups, which have achieved over 70% success rate in backtests.
There are two ways to trade key levels:
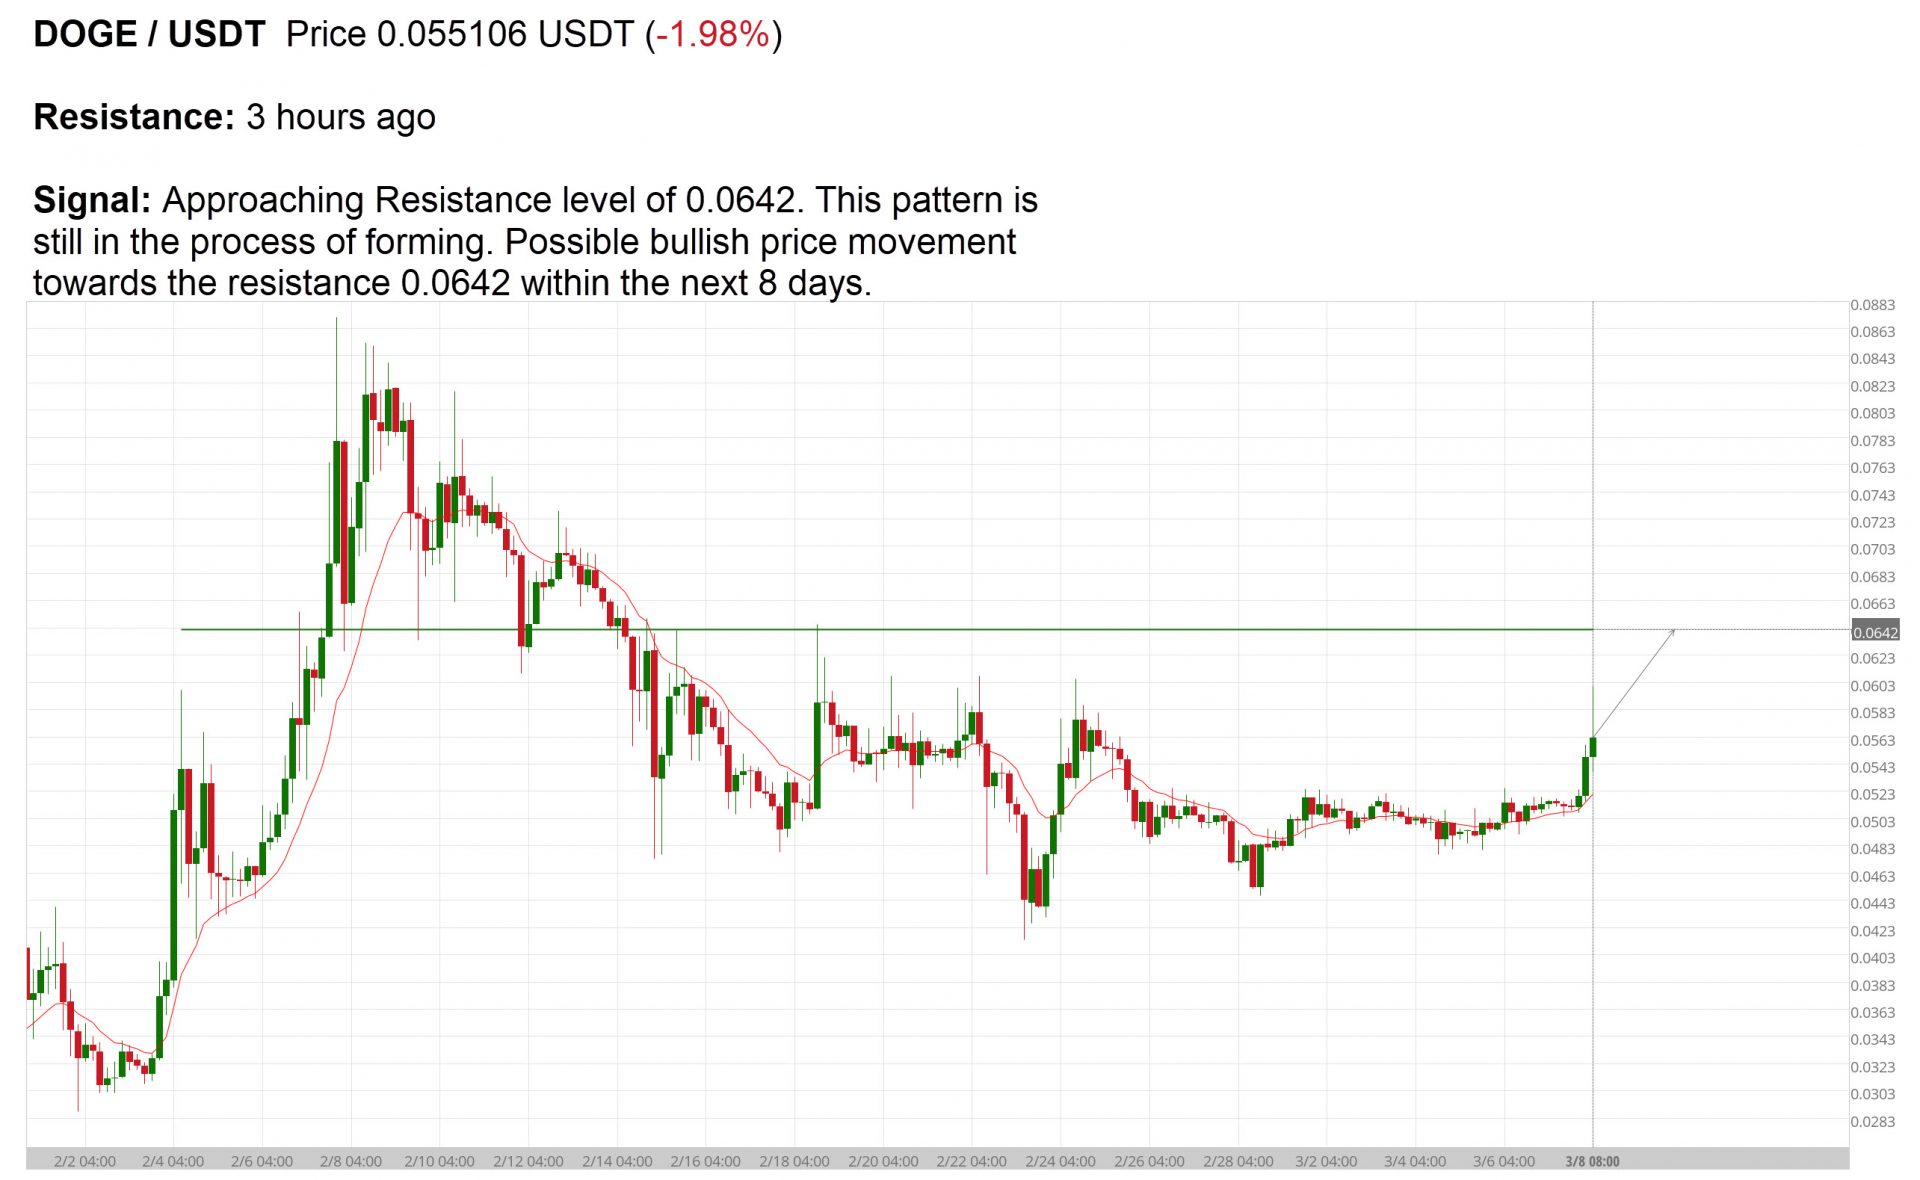
(1) Key level approach. Prices tend to retest support and resistance levels, until broken. Thus, traders can Sell when approaching Support and Buy when a coin price is approaching Resistance, as in the example below.
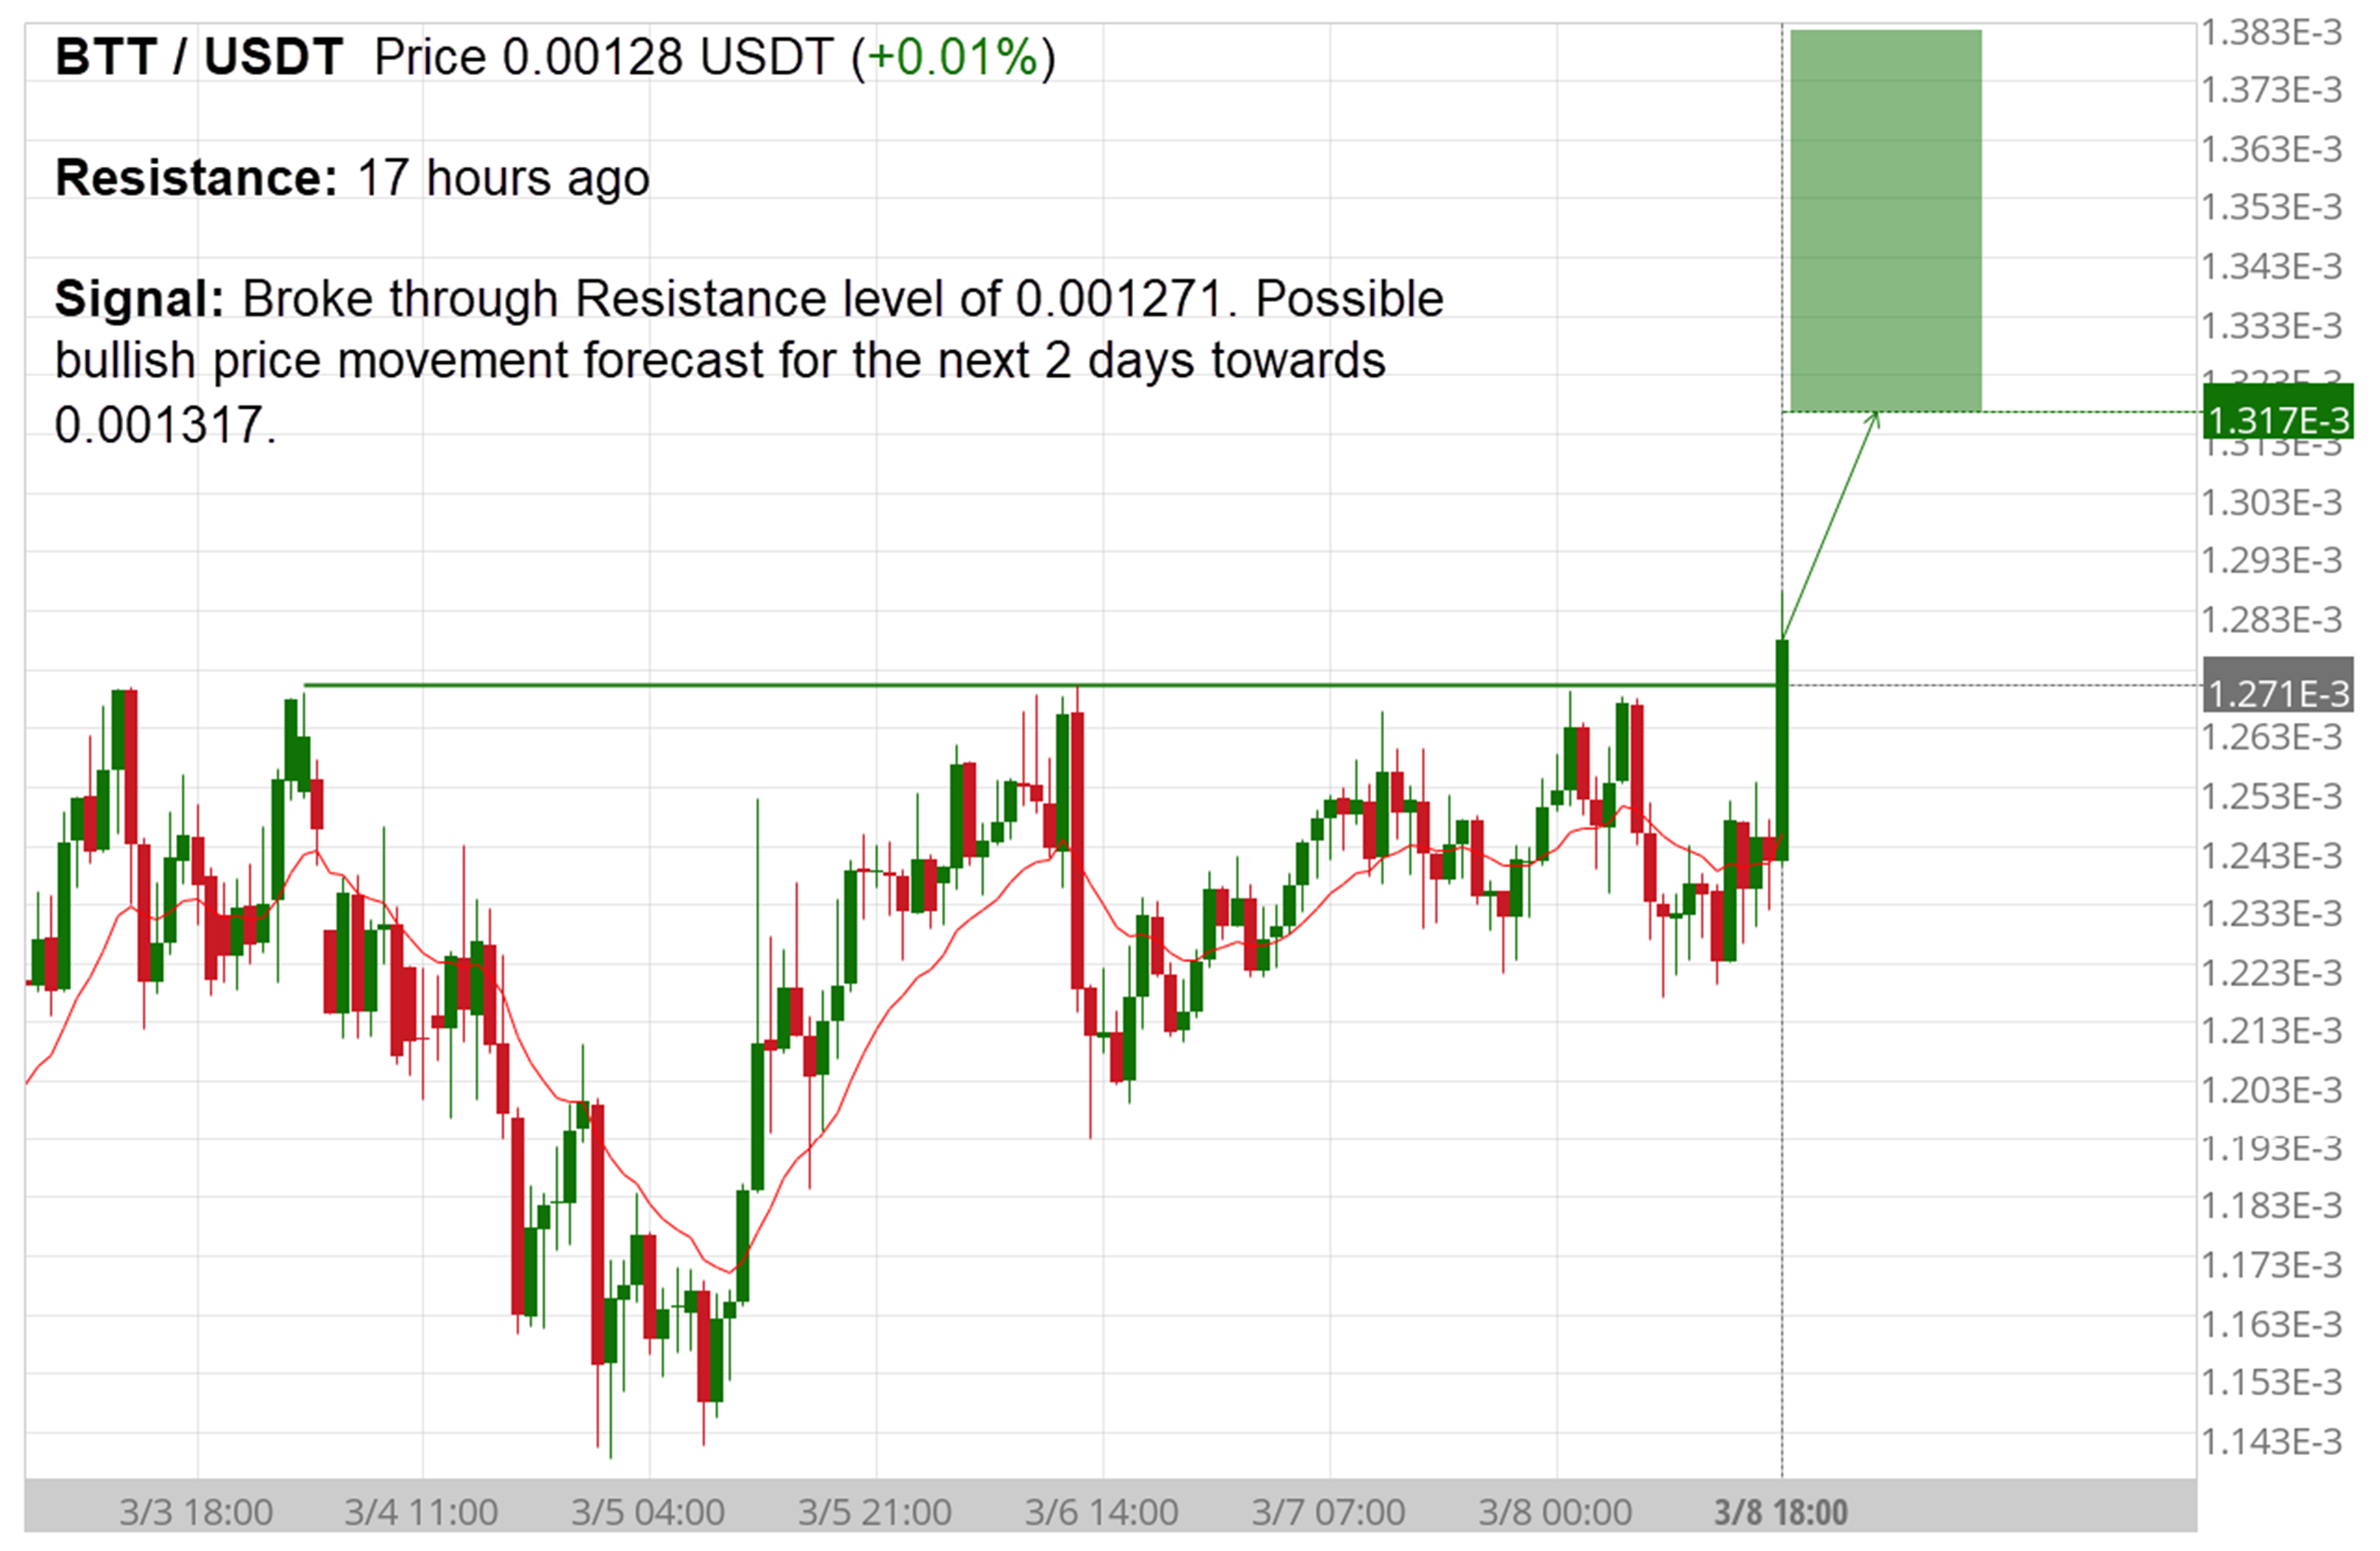
(2) Trading resistance breakout.
If the price breaks through a key level, it tends to continue in its path for a while. Thus, traders would Buy breakouts through Resistance level (example below), and Sell breakouts through Support levels.
Which breakouts should be acted upon? Should a trader wait for a second opportunity (retracement)? The short answers are: 1) all, 2) no. A breakout should be acted upon immediately; waiting for a retracement, will diminish profitability, and you may very well miss the entire price move.
Is volume a good confirmation of breakouts? Astute traders have observed that with upward breakouts (through resistance), less volume is preferred (contrary to popular belief) while with downward breakouts (through support), more volume is preferred.
Failures happen. Breakouts can fail in any pattern; some more than others. Remember that a breakout is a signal that prices are beginning to trend, either upward or downward. As noted earlier, key level (resistance and support) breakouts and approaches have very high (~ 75%) success rates.
Additional resources:
- How to trade key levels – article with video
- How to trade resistance breakout video
Strategy #6: Trading crypto chart patterns (show such coins now)
Price patterns appear when traders are buying and selling at certain levels, and therefore, price oscillates between these levels, creating chart patterns. When price finally does break out of the price pattern, it can represent a significant change in sentiment.
Patterns that emerge over a longer period of time generally are more reliable, with larger moves resulting once price breaks out of the pattern. Therefore, a pattern that develops on a daily chart is expected to result in a larger move than the same pattern observed on an intraday chart, such as a one-minute chart.
altFINS’ automated chart pattern recognition engine identifies 16 trading patterns across multiple time intervals (15 min, 1h, 4h, 1d), saving traders a ton of time, including:
- Ascending / Descending Triangle
- Head and Shoulders, Inverse Head and Shoulders
- Channel Up / Down
- Falling / Rising Wedge
- Double Bottom / Top
- Triple Bottom / Top
The system also clearly indicates the expected price path going forward, based on machine learning algorithms that crunched thousands of past situations.
Check out current trading chart pattern opportunities here.
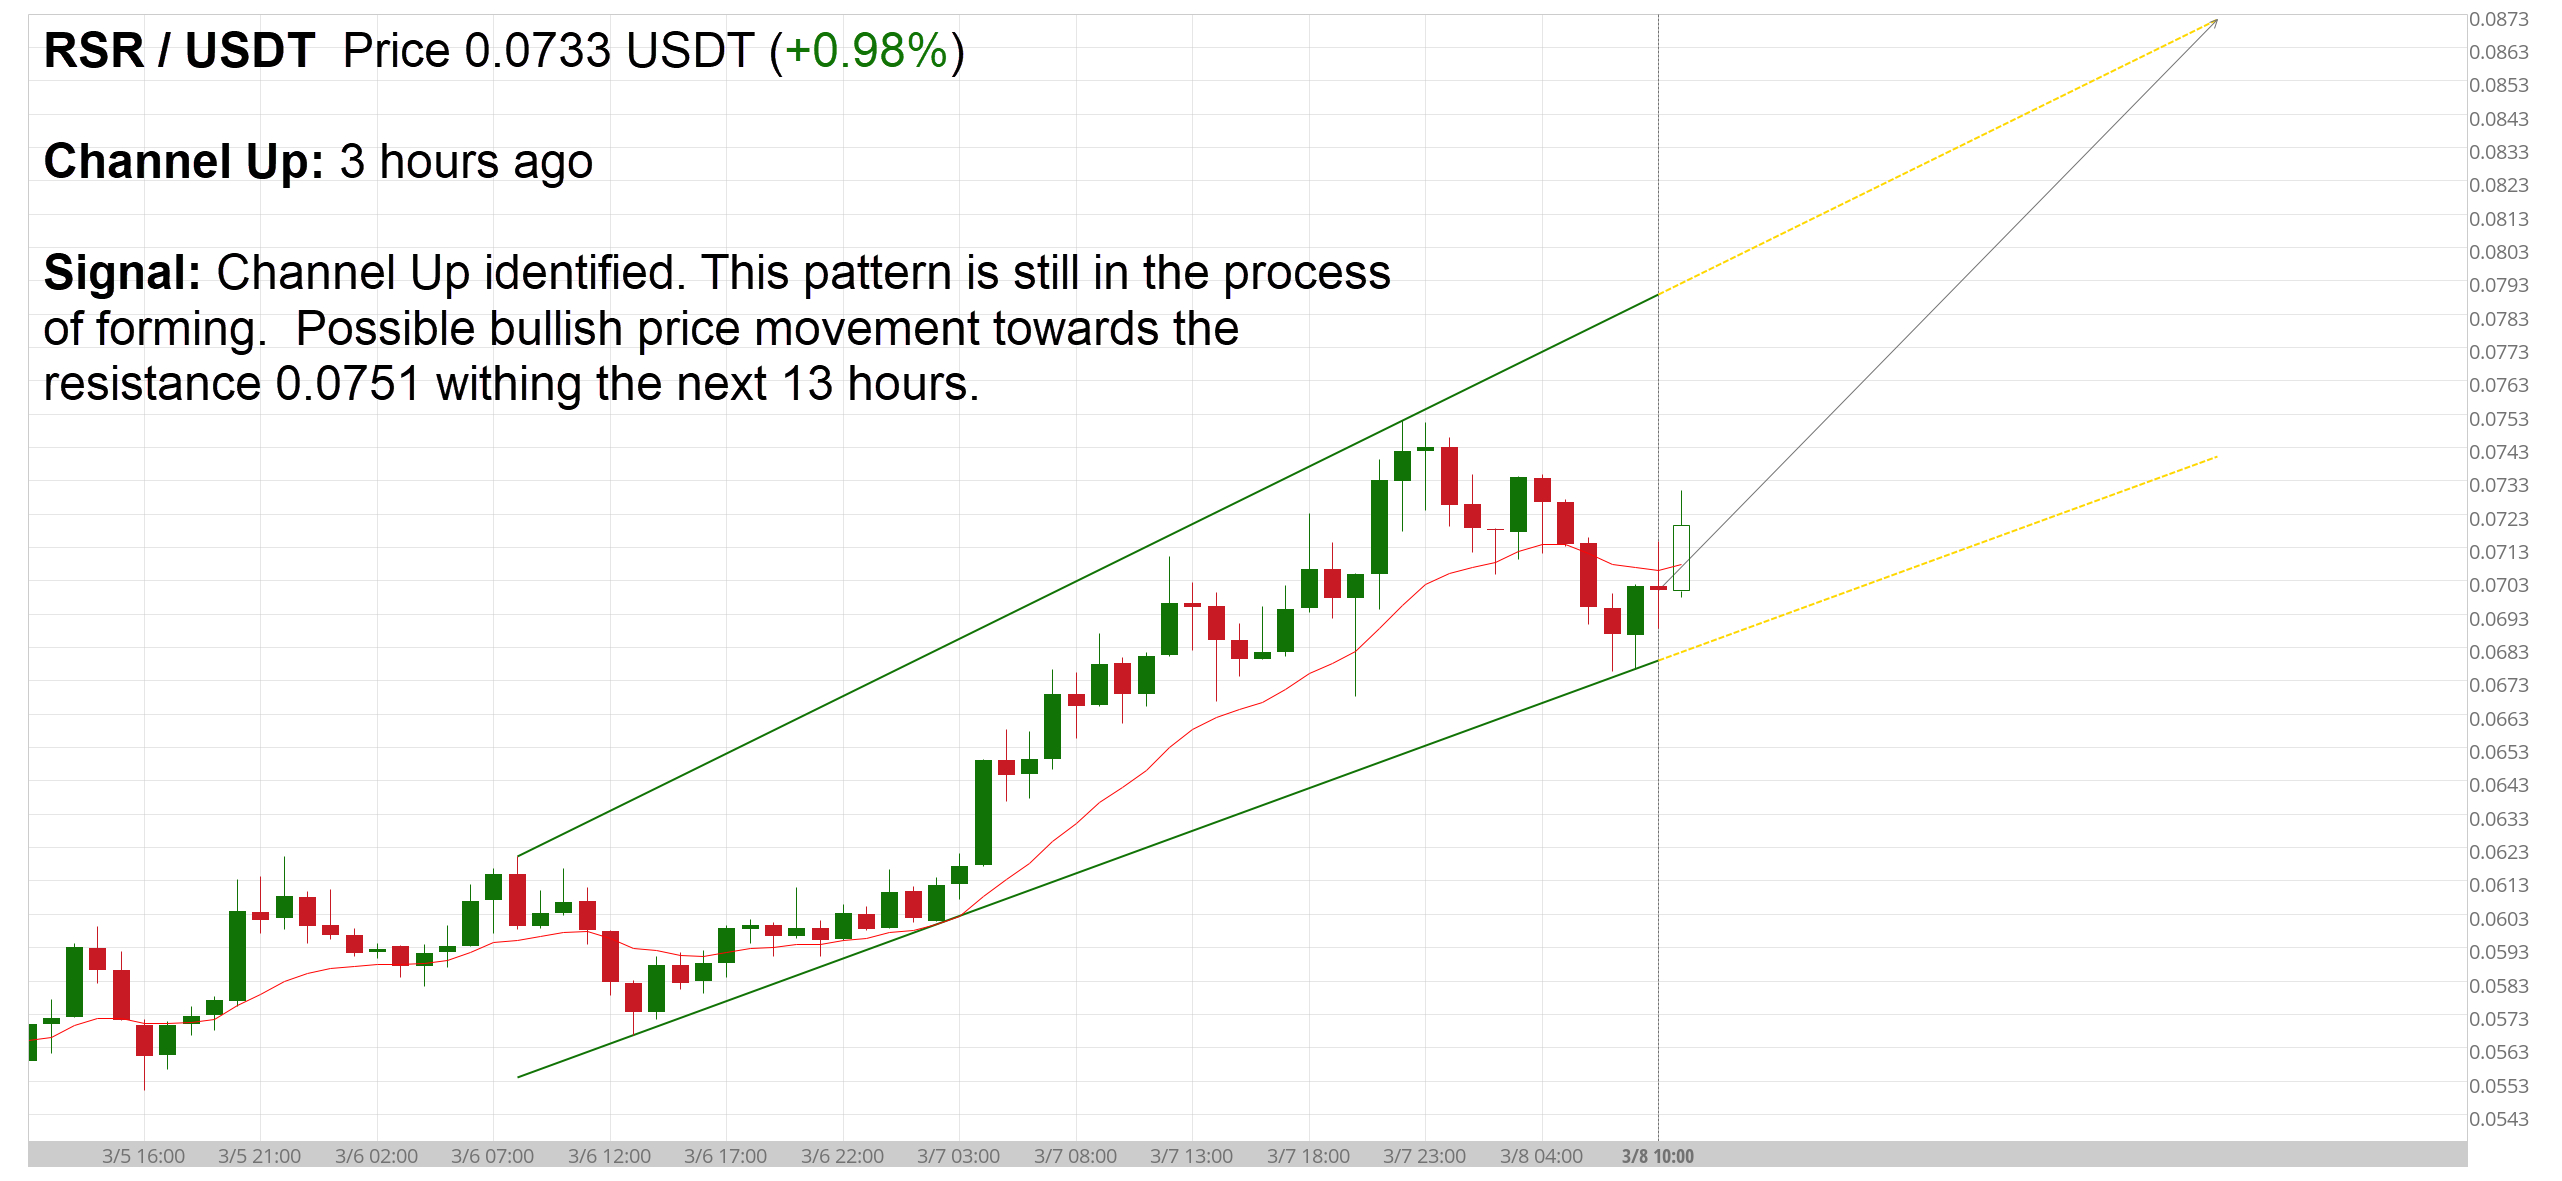
Here is an example of a bullish Channel Up chart pattern:
Additional resources:
Overview of chart patterns.
Chart patterns cheat sheet.
How to trade chart patterns video
How to trade Ascending Triangle breakout.
Emerging versus Completed (breakout) chart patterns.
