Search Knowledge Base by Keyword
How To Trade Channel Up Pattern? | Crypto Chart Pattern
Channel up patterns are characterized by two parallel lines that encapsulate a specified range. The upper line exhibits a slightly steeper slope than the lower one, signaling an overarching upward trajectory in prices. This pattern visually represents a bullish trend, indicating that the market is consolidating gains while preserving its upward momentum.
Trading a channel up chart pattern involves identifying a bullish trend in the market, where the price of an asset is moving higher in a channel pattern. Trading range between diagonal parallel lines. It forms when an up or downtrend is formed between parallel support and resistance lines.
How To Profitably Trade Channel Up Patterns?
Currently, we are seeing many assets trading in a Channel Up pattern.
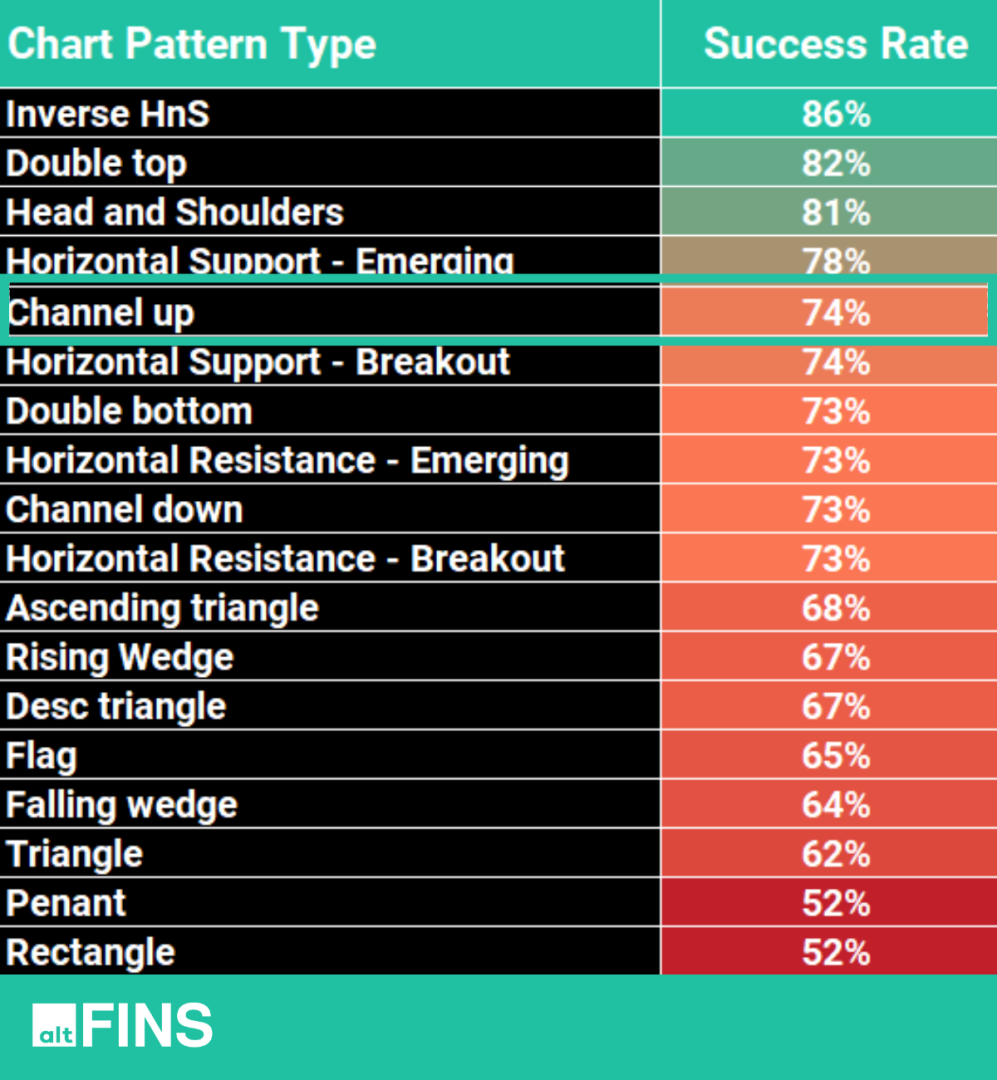
According to historical backtests conducted on the altFINS platform, Channel Up pattern exhibits one of the highest success rates of 74%!
We teach trading Chart Patterns in our new Crypto Trading Course, which includes 10 lessons, 40 videos, 7 trading strategies, notes, quizzes and risk management techniques to get you to generate consistent trading profits.
Channel Up patterns form in an Uptrend as the price is gradually making Higher Highs and Higher Lows between two parallel trendlines (resistance and support trendlines). It shows that traders and investors are eager to accumulate the asset at an increasingly higher price.
There are two types of Channel Up trade setups on altFINS:
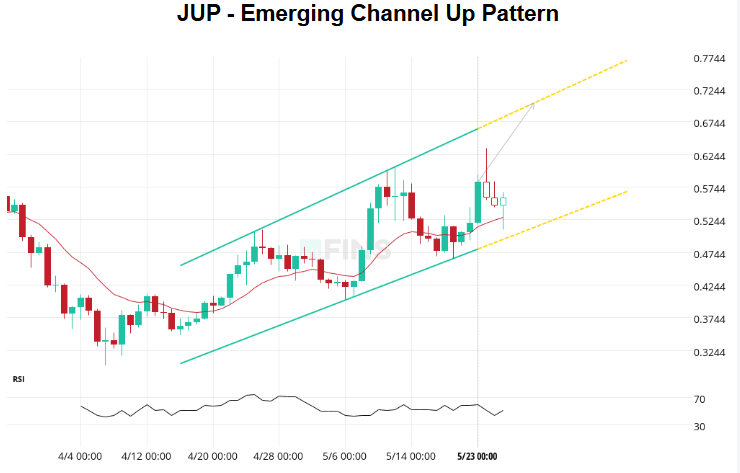
1. Emerging patterns: traders initiate trades when the price fluctuates within its channel trendlines (enter near support trendline and exit near resistance trendline).
Here’s an example of an emerging Channel Up pattern that our automated pattern detection system identified thee days ago (see arrow and three empty candles in chart below).
There’s about +20% potential gain.
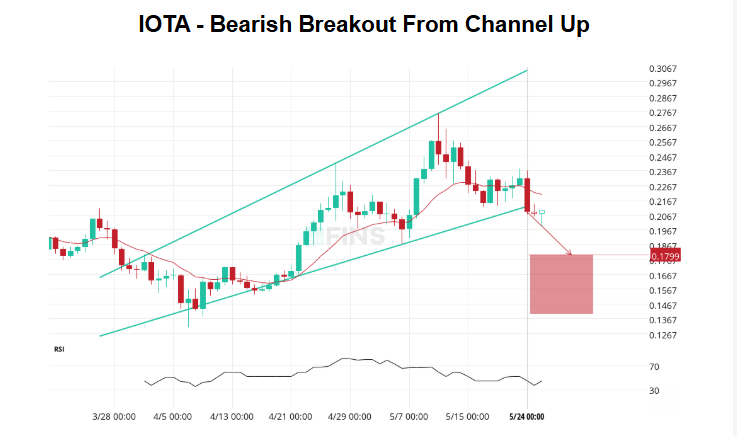
2. Complete patterns (breakout): initiate a trade when the price breaks through the channel’s trendlines, either on the upper (bullish) or lower side (bearish). When this happens, the price can move rapidly in the direction of that breakout.
Here is an example of a bearish breakout that has a 14% profit (short sell).
According to historical backtests conducted on the altFINS platform, the Channel Up pattern exhibits one of the highest success rates, standing at an impressive 74%!
Trading Strategies for Channel Up Crypto Chart Patterns
Traders often look for opportunities to capitalize on this pattern through various trading strategies. Here are some common trading strategies for a channel up chart pattern:
Trend Following:
- Long Positions: Traders can go long (buy) when the price approaches the lower trendline of the channel, anticipating a bounce off the support level.
- Profit Target: Aim for a profit when the price reaches the upper trendline of the channel or when a resistance level is encountered.
Support and Resistance:
- Buy Near Support: Look for buying opportunities near the lower trendline (support) of the channel.
- Sell Near Resistance: Consider selling or taking profits when the price reaches the upper trendline (resistance).
Breakout Trading:
- Breakout Confirmation: Traders may enter long positions if the price breaks above the upper trendline, signaling a potential continuation of the uptrend.
- Stop-Loss: Place a stop-loss order below the breakout point to manage risk.
Moving Averages:
- Use Moving Averages: Employ moving averages to confirm the trend direction.
- Golden Cross: Consider a long position when a shorter-term moving average (e.g., 50-day) crosses above a longer-term moving average (e.g., 200-day) within the channel.
Oscillators and Indicators:
- Relative Strength Index (RSI): Confirm overbought or oversold conditions using RSI. Consider buying when RSI is below 30 and selling when it is above 70.
- MACD (Moving Average Convergence Divergence): Use MACD crossovers as signals for potential entry or exit points.
Fibonacci Retracement:
- Identify Key Levels: Use Fibonacci retracement levels to identify potential support or resistance levels within the channel.
- Buy at Retracement Levels: Consider entering long positions when the price retraces to Fibonacci support levels.
Volume Analysis:
- Confirm with Volume: Analyze volume to confirm the strength of the trend. Higher volume during an upward move can signal conviction in the trend.
How To Identify Channel Up Pattern on altFINS?
To identify cryptocurrencies with channel up patterns, visit these altFINS sections:
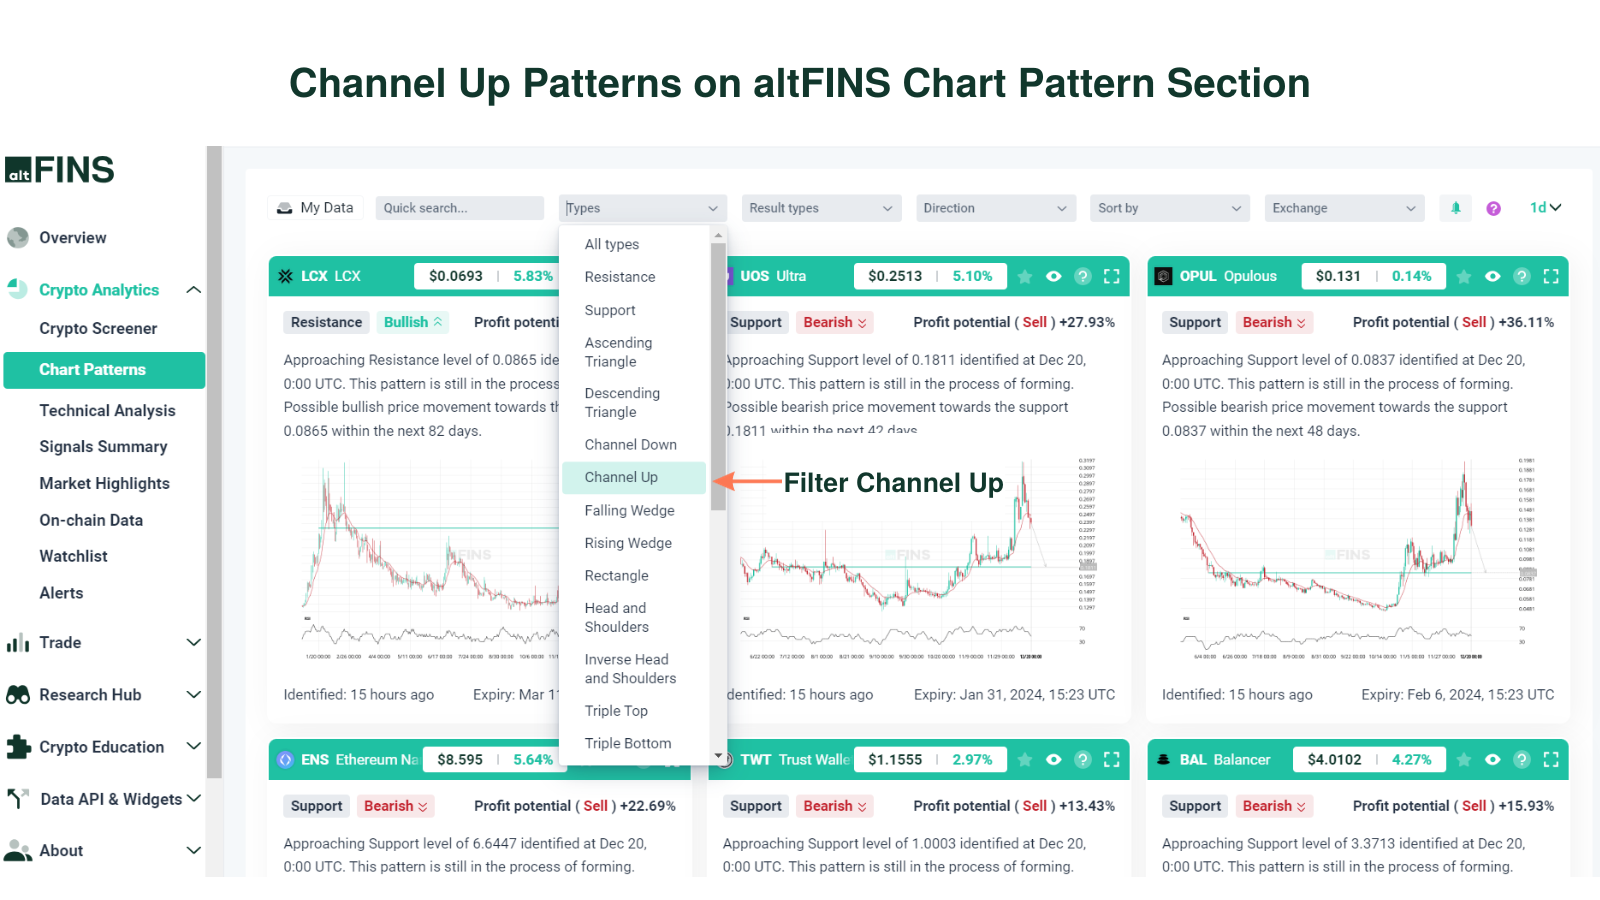
altFINS’ AI chart pattern recognition engine identifies 26 trading patterns across multiple time intervals (15 min, 1h, 4h, 1d), saving traders a ton of time.
You can filter chart patterns by type, profit potential, success rate, buy or sell direction, exchange, and more.
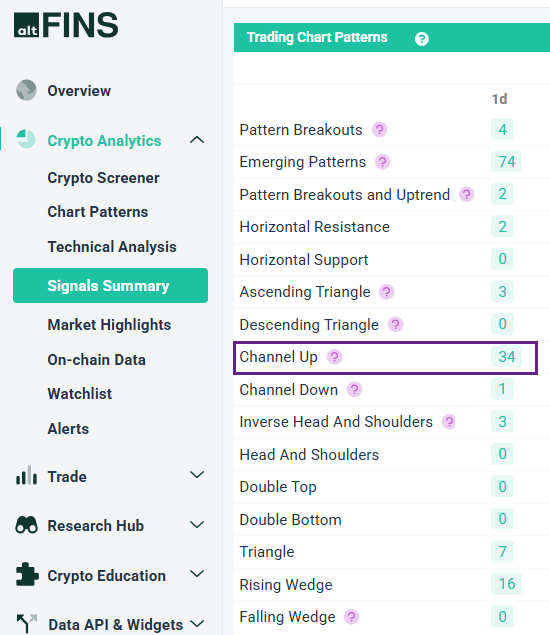
Crypto signals represent a summary of pre-defined and custom filters for trading strategies. Signals Summary is a great starting point for discovering trading opportunities. Channel up chart patterns can be found in the Trading Patterns category.

-
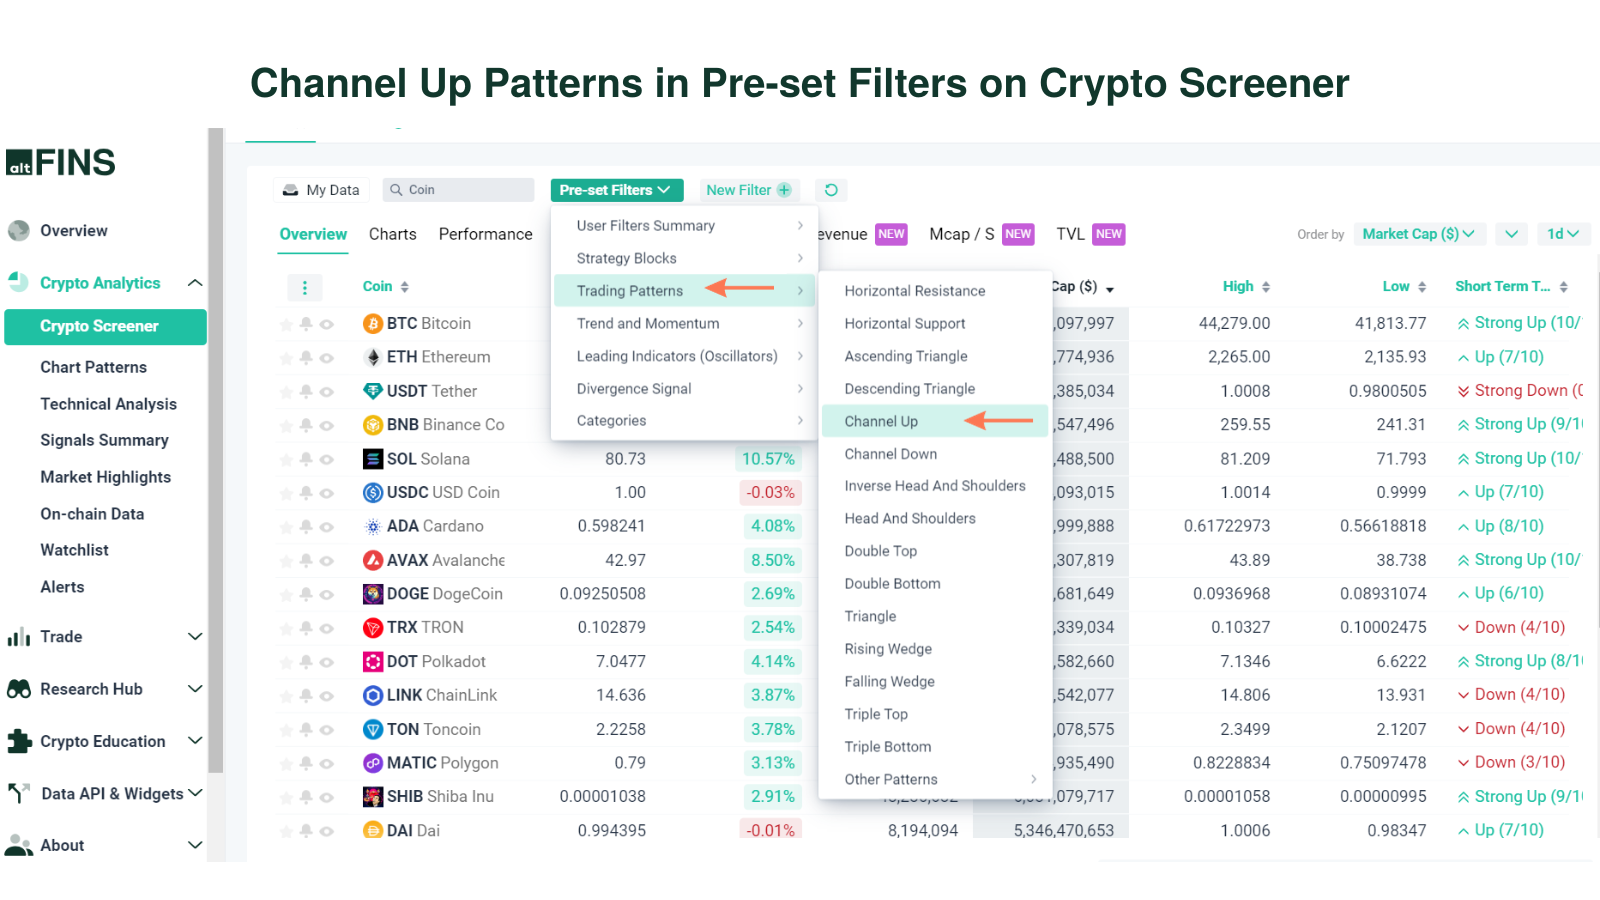
Crypto Screener – Pre-set filters
altFINS offers the best free crypto screener. It includes a wide range of pre- set filters to help find the best cryptocurrencies to invest in based on your specific trading strategy. Learn how to use crypto screener.
-
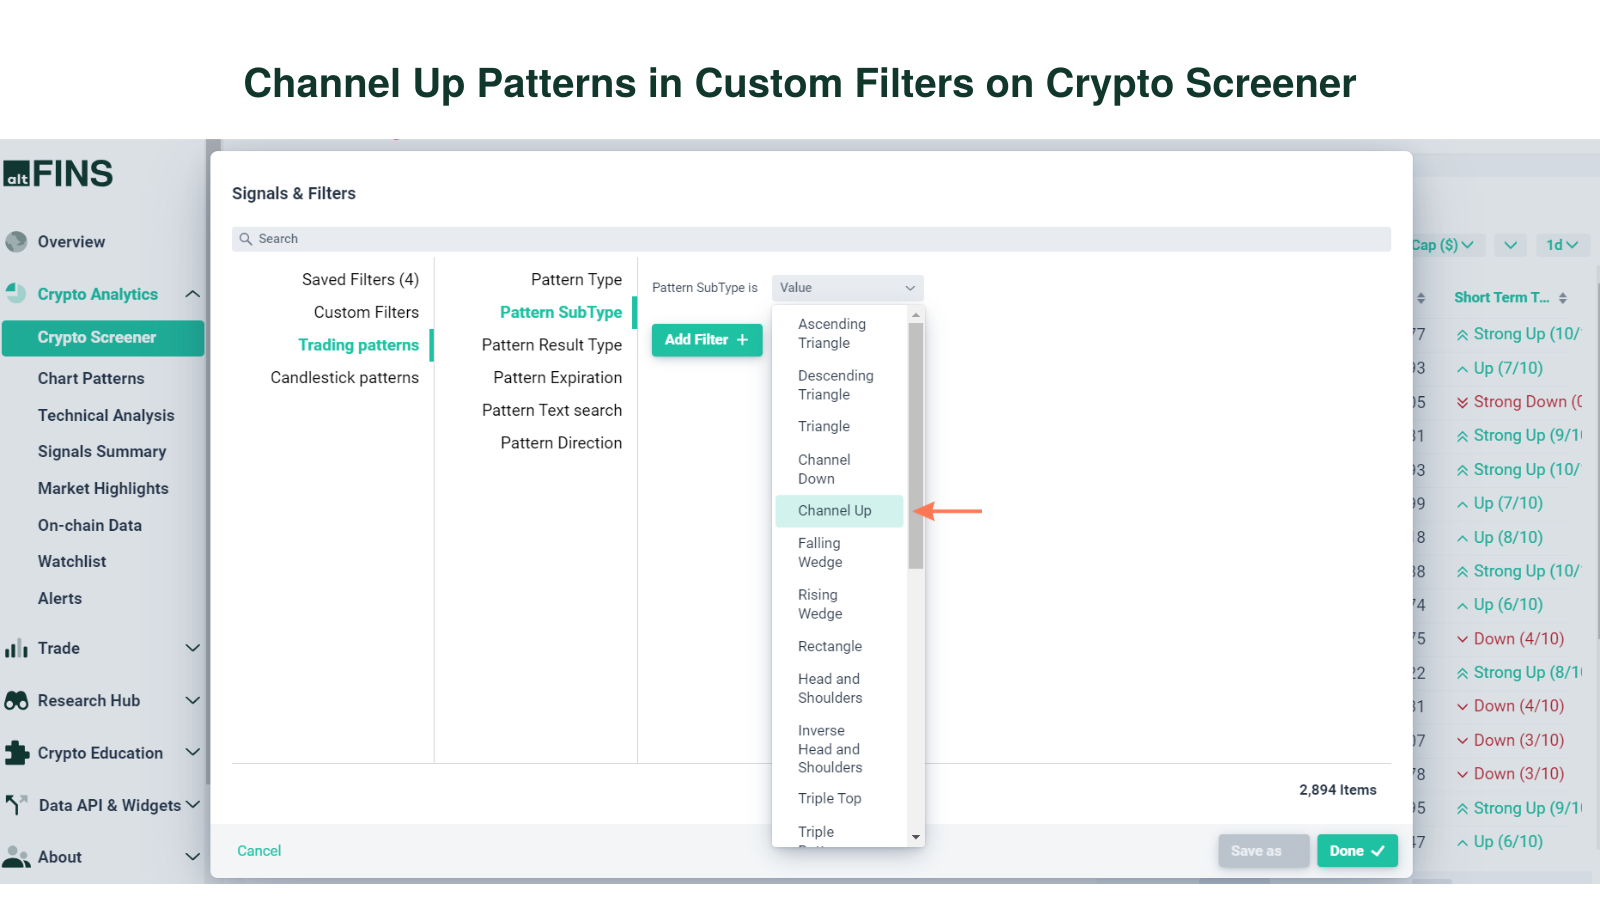
Crypto Screener – Custom filters
You can set up your own custom screens using combinations of technical indicators (SMA, EMA, RSI, MACD), variables like market cap, traded volume and price performance. You can also create price alerts for your scans.
-
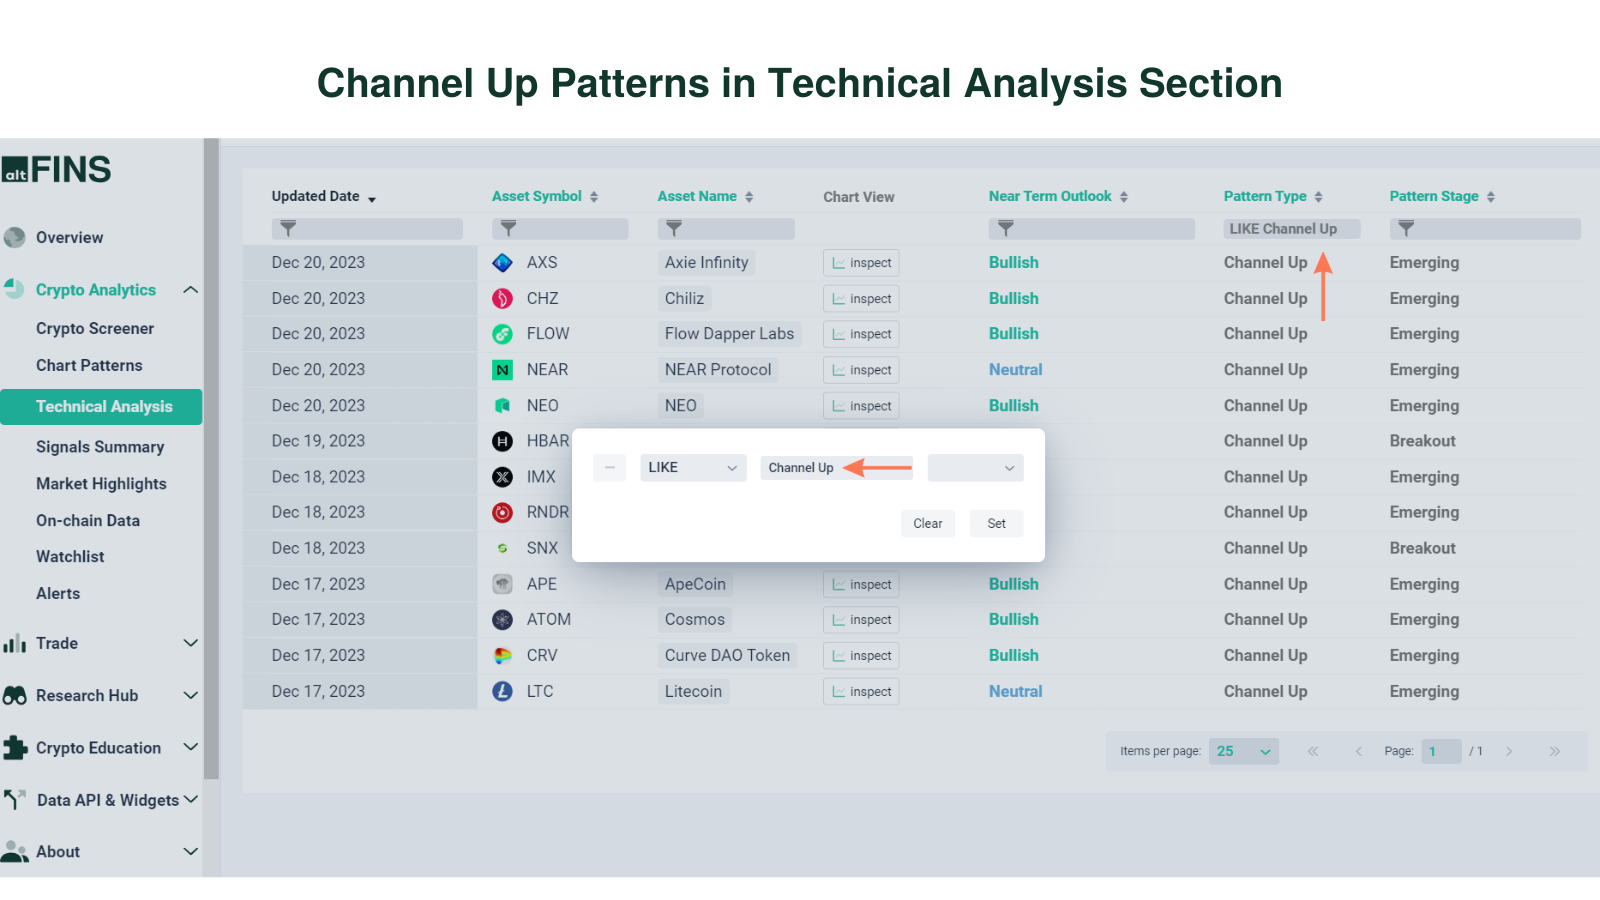
Technical Analysis
altFINS’ analysts conduct technical analysis of top 60 coins. The technical analysis is simple and consistent. It follows the key concepts of Technical Analysis (TA): 1) Trend 2) Momentum 3) Volume 4) Chart Patterns 5) Support and Resistance.
Go to Technical Analysis Section
Key Considerations While Trading Channel Up Crypto Chart Patterns
Volume and Trend Strength:
Evaluate trading volume and the overall robustness of the bullish trend for a comprehensive understanding.
Confirmation Signals:
Rely on supplementary signals, such as bullish candlestick patterns or moving average crossovers, to corroborate the validity of a channel up pattern before committing to trades.
Diversification:
Mitigate risk by diversifying trading strategies, avoiding over-reliance on a single pattern or indicator.
Pattern Formation:
Channel up patterns typically emerge following a substantial period of price appreciation, signifying a market pause to consolidate gains and gather momentum for further upward movement.
Length and Width of the Channel Up:
The length of a channel can offer insights into the strength of the bullish trend, with longer channels suggesting a more sustainable uptrend. Channel width represents the degree of volatility within the defined range, with narrower channels indicating a more defined uptrend and wider channels suggesting increased volatility.
Trading Entry and Exit Points:
Identify opportune entry points by observing price behavior near the support line. Determine exit points for long positions based on overall trend analysis and signs of weakening upward momentum near the resistance line.
Avoiding Contrarian Trading:
While breakouts from the channel can signal potential trend changes, exercise caution and conduct thorough analysis before initiating trades against the prevailing trend.
Risk Management:
Given the inherent risks in crypto trading, implement robust risk management strategies, including setting stop-loss orders, to protect capital. Watch this trading video and learn how to set stop-loss and risk management settings.
More tips:
- Lean how to trade Chart Patterns?
- What are Crypto Chart Patterns?
- How to Trade Channel Down Pattern?
