Search Knowledge Base by Keyword
MACD Indicator Explained: MACD Line, Signal Line & Histogram (Complete 2026 Guide)
Updated January 2026 · 8 min read
The MACD (Moving Average Convergence/Divergence) is a trend-following momentum indicator that measures the difference between two exponential moving averages — typically the 12-day and 26-day EMAs. It’s one of the most widely used tools in crypto technical analysis because it combines trend detection and momentum measurement in a single oscillator.
In this guide you’ll learn how the MACD works, how to read the MACD Line, Signal Line, and Histogram, the four ways to trade MACD signals (including the underrated histogram slope method), real crypto examples on BTC and ADA, and how to scan for MACD setups automatically with altFINS.
Quick Answer (TL;DR):
- MACD Line = 12-day EMA − 26-day EMA
- Signal Line = 9-day EMA of the MACD Line
- Histogram = MACD Line − Signal Line
- Buy signal: MACD crosses above Signal Line (or above zero)
- Sell signal: MACD crosses below Signal Line (or below zero)
- Market Scan: Fresh Bullish MACD Signal Lie Cross Over
- Market Scan: Bullish Momentum Inflection
What Is the MACD Indicator?
The Moving Average Convergence/Divergence (MACD) is a momentum indicator developed by Gerald Appel in the late 1970s. It measures the relationship between two exponential moving averages (EMAs) of an asset’s price, revealing when momentum is building, fading, or reversing.
What makes MACD so powerful in crypto trading is that it converts two trend-following tools (the 12-day and 26-day EMAs) into a momentum oscillator — giving traders the best of both worlds: direction and strength.
The 3 Components of MACD
| Component | Formula | What It Shows |
|---|---|---|
| MACD Line | 12-EMA − 26-EMA | Short-term vs. long-term momentum |
| Signal Line | 9-EMA of MACD Line | Smoother line used to spot turning points |
| Histogram | MACD Line − Signal Line | Visualizes momentum strength and direction |
The MACD fluctuates above and below a zero line as the two EMAs converge, cross, and diverge — producing the full picture of momentum shifts.
The 4 Ways to Trade MACD
There are four core MACD trading techniques, ranked from most popular to most underrated:
| Method | Timing | Best For |
|---|---|---|
| 1. Signal Line Crossover | Medium | Most common, balanced signal |
| 2. Histogram Slope | Earliest | Aggressive, early entries |
| 3. Divergence | Early warning | Spotting reversals |
| 4. Centerline Crossover | Latest (lagging) | Trend confirmation |
1. MACD Signal Line Crossover (Most Used)
The Signal Line is a 9-day EMA of the MACD Line. It smooths the indicator and helps traders identify turning points.
- Bullish crossover: MACD Line turns up and crosses above the Signal Line → potential buy signal.
- Bearish crossover: MACD Line turns down and crosses below the Signal Line → potential sell signal.
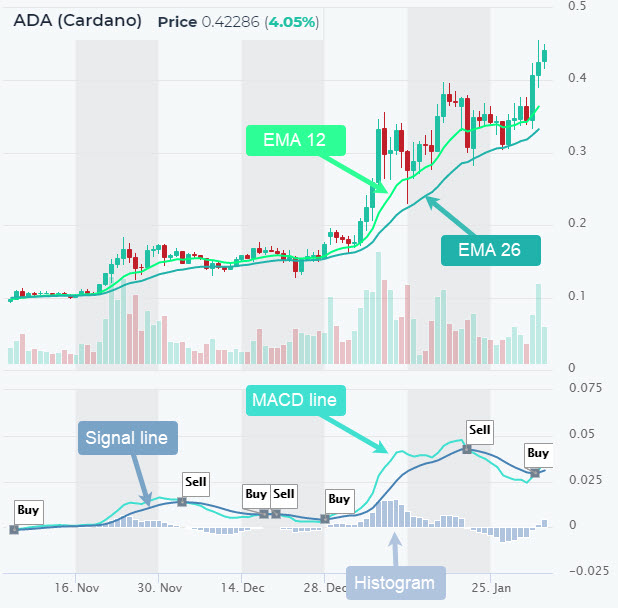
Real example: When the MACD Line crossed above the Signal Line on ADA (Cardano), altFINS automatically flagged it as a Buy signal. Traders can find all current bullish and bearish MACD crossovers on the altFINS Signals Summary page.
2. MACD Histogram Slope (Earliest Signal — Most Underrated)
This is one of the most overlooked MACD techniques — and it often produces earlier entries than crossovers. The Histogram is essentially an “indicator of indicators”: it shows the gap between the MACD Line and the Signal Line.
How to read histogram slope:
- Histogram peaks & starts declining → potential sell signal (momentum fading).
- Histogram bottoms & starts rising → potential buy signal (momentum building).
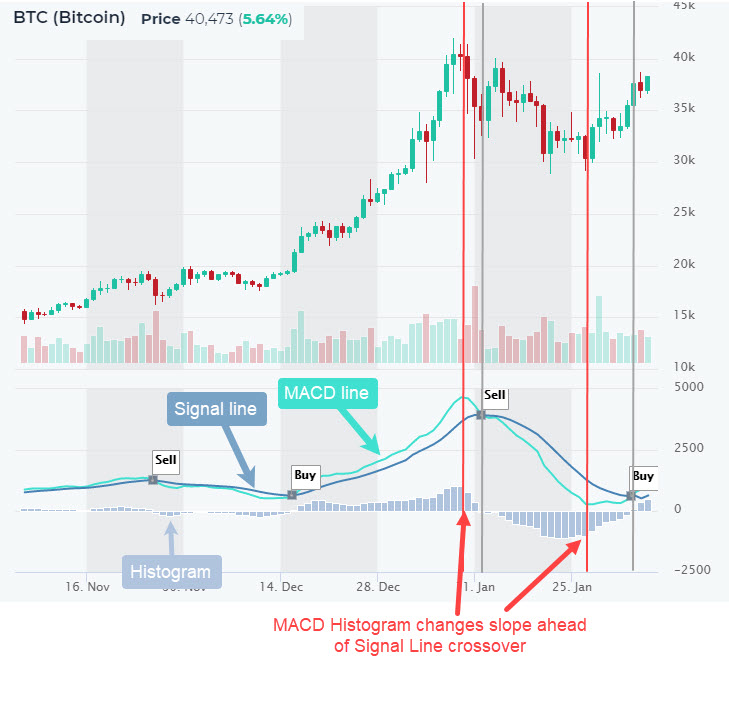
In the Bitcoin chart above, the change in histogram slope (red lines) gives traders an earlier entry than waiting for the full MACD Signal Line crossover (grey lines). That slight edge in timing can translate into significant profits on trending moves.
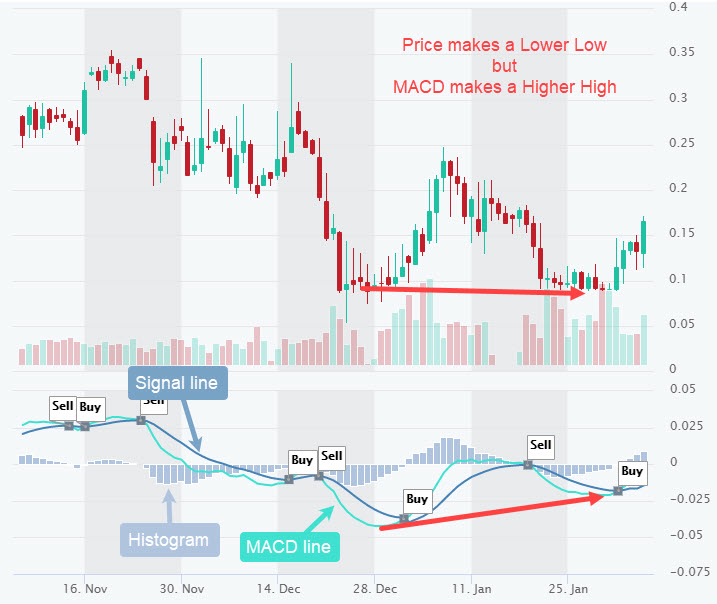
3. MACD Divergences (Spotting Reversals)
A divergence happens when price and MACD move in opposite directions — a powerful clue that the current trend is losing steam.
- Bullish divergence: Price makes a lower low, but MACD makes a higher low → selling pressure is fading, reversal likely up.
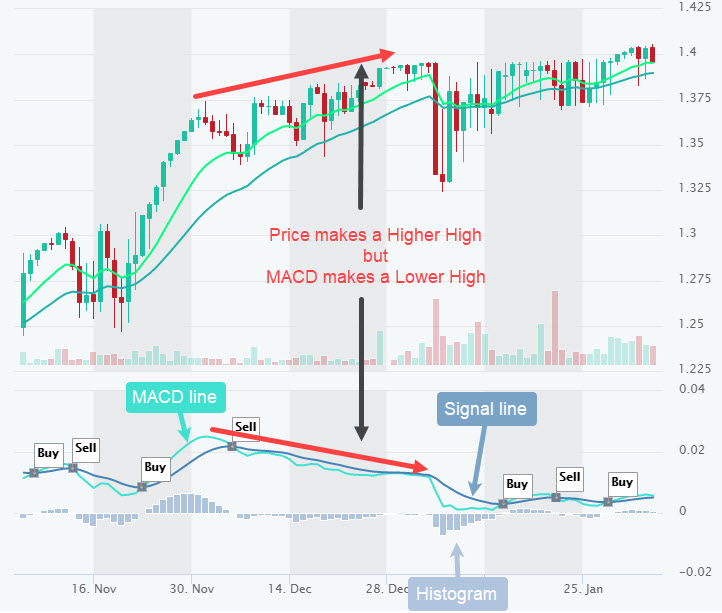
- Bearish divergence: Price makes a higher high, but MACD makes a lower high → buying momentum weakening, reversal likely down.
Pro tip: Manually spotting divergences across dozens of coins is tedious. In altFINS, open Screener → Charts tab → Show 6, 12, or 24 charts per page to scan many coins at once for divergences.
4. MACD Centerline Crossover (Lagging Trend Signal)
The Centerline (zero line) crossover tells you the broad trend direction:
- MACD > 0 → 12-EMA is above 26-EMA → uptrend / buy bias.
- MACD < 0 → 12-EMA is below 26-EMA → downtrend / sell bias.
This method is the slowest of the four because it requires the EMAs themselves to cross. Use it as a trend filter, not an entry trigger — for example, only take long signal-line crossovers when MACD is above zero.
MACD Signal Comparison at a Glance
| Signal Type | Bullish Trigger | Bearish Trigger |
|---|---|---|
| Signal Line Cross | MACD crosses above Signal Line | MACD crosses below Signal Line |
| Histogram Slope | Histogram bottoms & rises | Histogram peaks & falls |
| Divergence | Lower price low + higher MACD low | Higher price high + lower MACD high |
| Centerline Cross | MACD crosses above 0 | MACD crosses below 0 |
MACD Combined with Other Indicators
MACD is strong on its own but becomes lethal when combined with other indicators. The goal: confirmation, not duplication.
- MACD + RSI: MACD confirms trend, RSI confirms overbought/oversold conditions.
- MACD + 200-day SMA: only take bullish MACD signals when price is above the 200 SMA.
- MACD + Fibonacci levels: bullish MACD crossover at the 61.8% retracement = high-probability setup.
- MACD + volume: crossovers accompanied by rising volume are far more reliable.
- MACD + candlestick patterns: a Dragonfly Doji + bullish MACD cross = powerful reversal combo.
A Step-by-Step MACD Trade Plan
- Identify the macro trend using the centerline: MACD above 0 = long bias, below 0 = short bias.
- Watch the histogram. When it bottoms and starts rising (in an uptrend), prepare for a long.
- Wait for signal-line crossover for confirmation, or enter early if histogram + price action align.
- Check confluence: RSI not overbought, price above key moving average, healthy volume.
- Enter the trade on the close of the confirmation candle.
- Set stop-loss below the most recent swing low (for longs) or above swing high (for shorts).
- Watch for exit signals: histogram rolling over or bearish divergence = consider taking profit.
- Final exit on opposite signal-line crossover or target hit.
Limitations of MACD
No indicator is perfect. MACD has real weaknesses you must account for:
- Lagging indicator: MACD is based on moving averages, which react to past price. In fast crypto markets, signals can come late.
- Whipsaws in sideways markets: during consolidation, MACD produces many false crossovers.
- Not a standalone system: always combine with other tools — price action, volume, support/resistance.
- Divergences can last long: price can keep trending against a divergence before reversing. Never enter on divergence alone.
How to Find MACD Setups with altFINS
Manually scanning charts for MACD signals across 3,000+ coins is impossible. altFINS automates it:
- Signals Summary: see all coins with fresh MACD bullish or bearish crossovers, updated live.
- Crypto Screener: filter by “MACD > Signal” or “MACD Bullish Cross” across 5 time frames.
- Grid chart view: spot divergences fast by viewing 6, 12, or 24 charts in one screen.
- Alerts: get notified the instant a coin prints a MACD signal you care about.
- Technical Analysis charts with pre-configured MACD (12,26,9) settings.
Key Takeaways
- MACD combines trend-following and momentum in one indicator.
- The standard settings are 12, 26, 9 (MACD Line, slower EMA, Signal Line).
- The four MACD signals (in order of timing): histogram slope → signal line cross → divergence → centerline cross.
- The histogram slope is the most underrated and gives the earliest entries.
- Divergences are powerful reversal signals but must be confirmed by price action.
- Always combine MACD with other indicators (RSI, moving averages, volume) for higher-probability trades.
- Use altFINS to scan 2,000+ coins for MACD setups automatically.
