Search Knowledge Base by Keyword
Essential Candlestick Patterns for Crypto Traders
Updated June 2026 · 12 min read
Candlestick patterns are the fastest way to read market psychology in real time. They reveal who is winning — buyers or sellers — and flag high-probability reversal and continuation setups before the move happens. In this guide, you will learn the five most powerful patterns used by professional crypto traders, how to identify them, and how to act on them with precision.
Each pattern is directly scannable on the altFINS Crypto Screener — covering 2,000+ coins across all major timeframes, updated in real time.
In this article
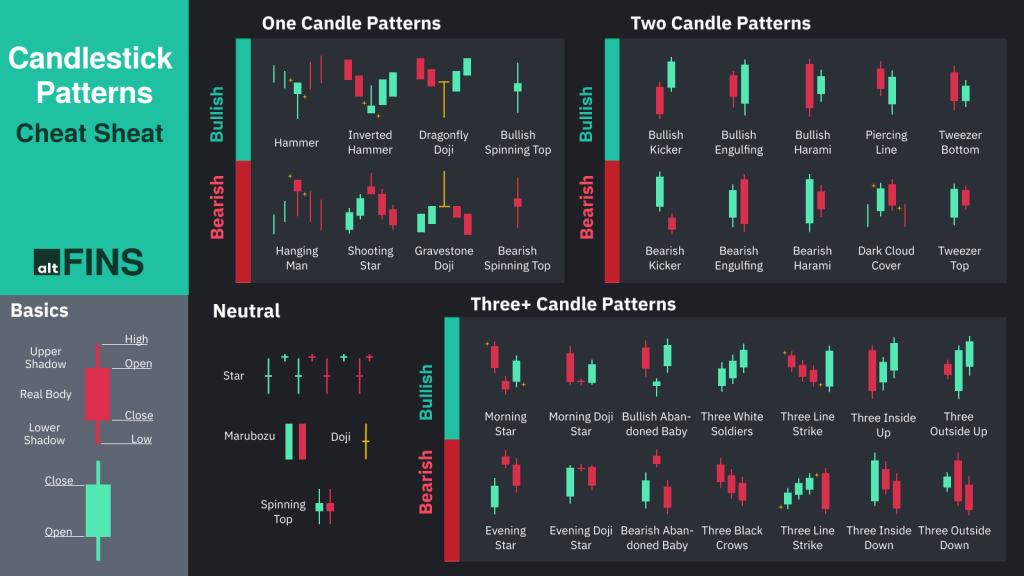
What are candlestick patterns?
A candlestick records four data points for a given time period: the open, high, low, and close price. The shape of the candle — and its relationship to surrounding candles — tells a story about supply and demand in that exact moment.
Watch Tutorial Video
Traders group these shapes into three categories:
Bullish
Buying pressure is dominant. Price is likely to move higher.
Bearish
Selling pressure dominates. A downtrend may be starting or continuing.
Indecision
Neither side has control yet. Watch for the next candle to confirm direction.
● altFINS Crypto Screener
Stop scanning charts manually — find every pattern in seconds
altFINS scans 2,000+ coins across all timeframes and surfaces these exact patterns the moment they form — with RSI, volume, and trend filters built in.
✓ Real-time signals
✓ 150,000+ traders
✓ Free to start
1. Three White Soldiers
Bullish reversal | 3-candle pattern
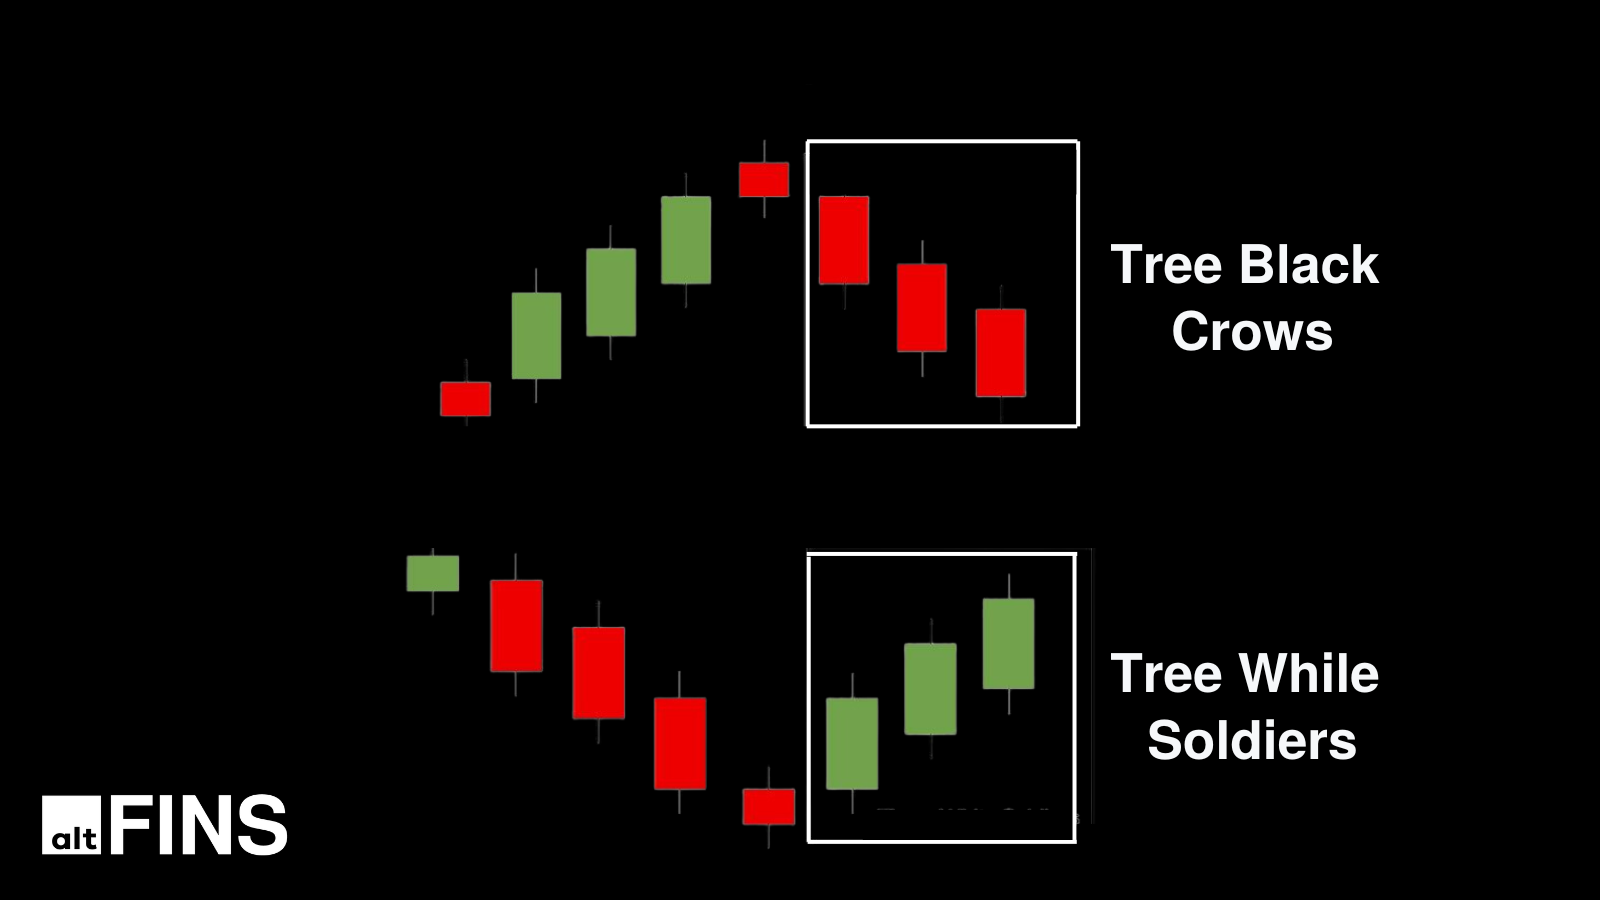
Three White Soldiers is one of the strongest bullish reversal signals in technical analysis. It forms after a downtrend and consists of three consecutive green candles, each closing higher than the last with small upper and lower shadows. This pattern shows sustained, confident buying — not a brief bounce.
What to look for:
- Three consecutive bullish (green) candles following a downtrend
- Each candle opens within the body of the previous candle
- Each candle closes near its high — minimal upper shadow
- Increasing or above-average volume confirms strength
Trading tip
Enter long after the third candle closes. Set your stop-loss below the low of the first soldier. Combine with RSI rising from oversold (<30) for higher-probability setups.
Bearish counterpart: The Three Black Crows pattern is the mirror image — three consecutive red candles after an uptrend — signalling a strong bearish reversal.
🔗 Deep dive: Three White Soldiers on altFINS
Assets with Three White Soldiers Candlestick Patterns
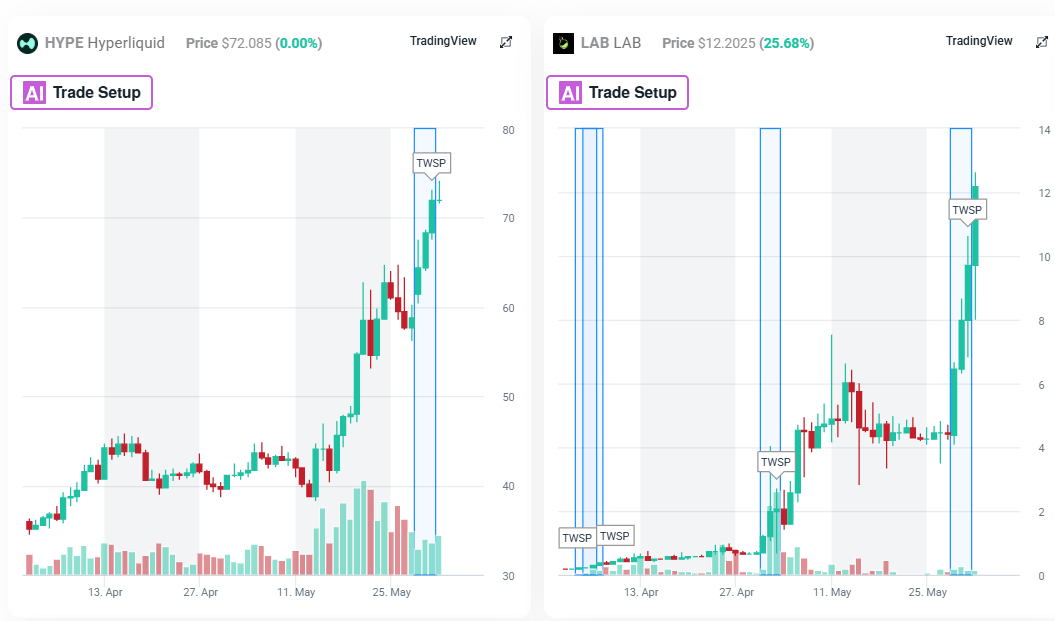
🔗 These are coins with Three White Soldier Candlestick Patterns now on 1D interval!
2. Doji
Indecision / Reversal signal | 1–3 candle pattern
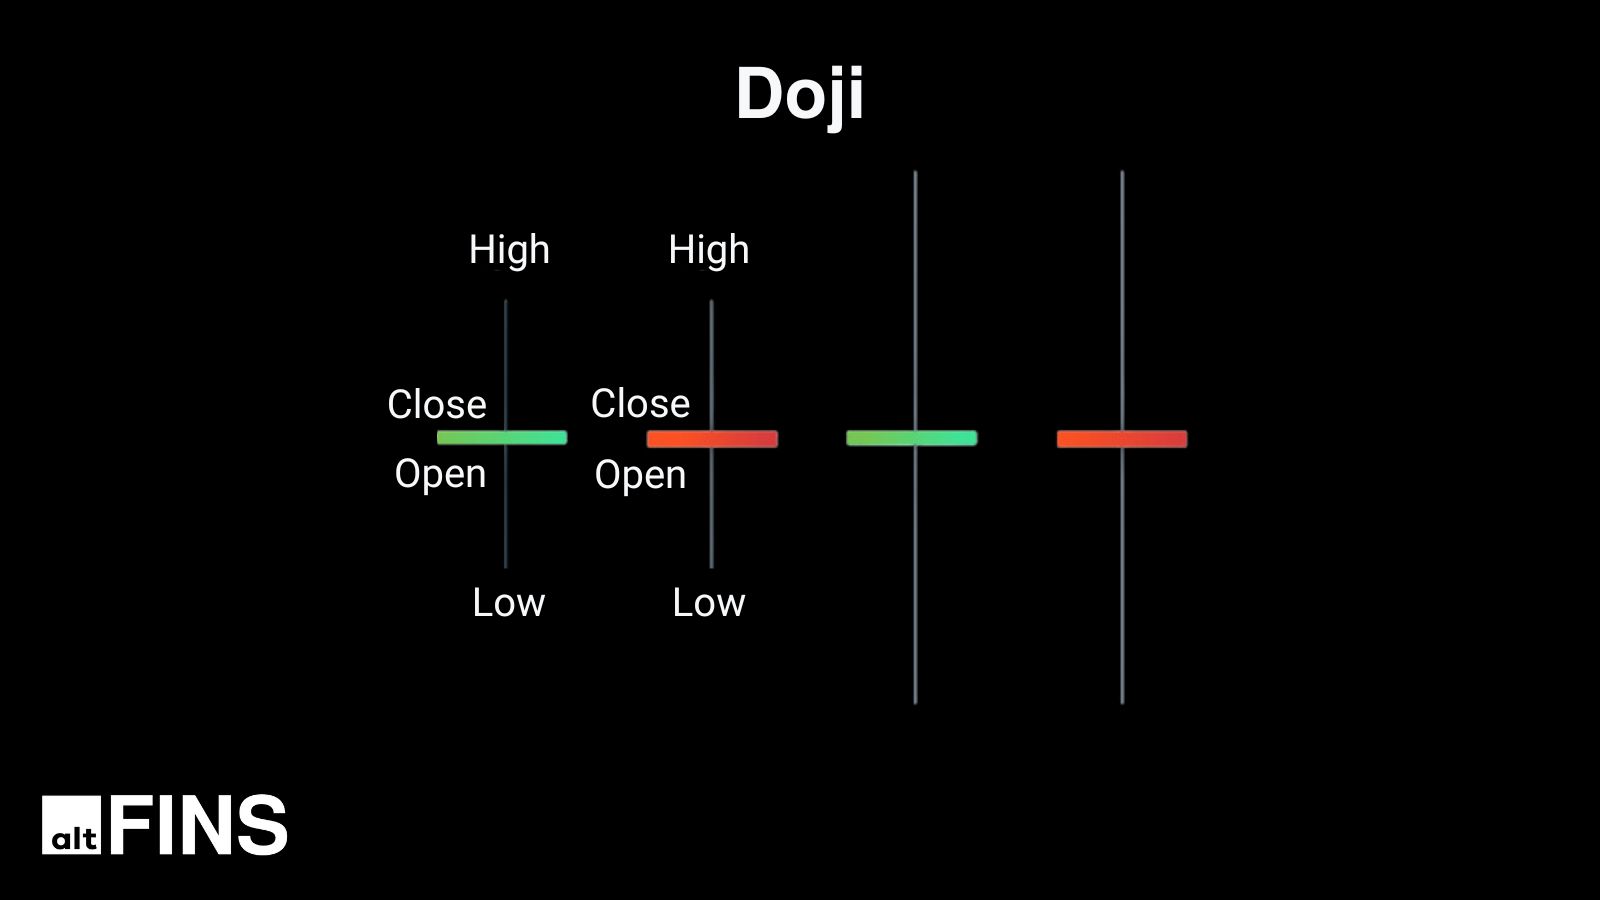
A Doji forms when the opening and closing prices are nearly identical, creating a very small or non-existent body with long shadows on both sides. It represents a momentary standoff between buyers and sellers — and in the context of an established trend, it often signals that momentum is about to reverse.
Key Doji variants:
| Variant | Context | Signal |
|---|---|---|
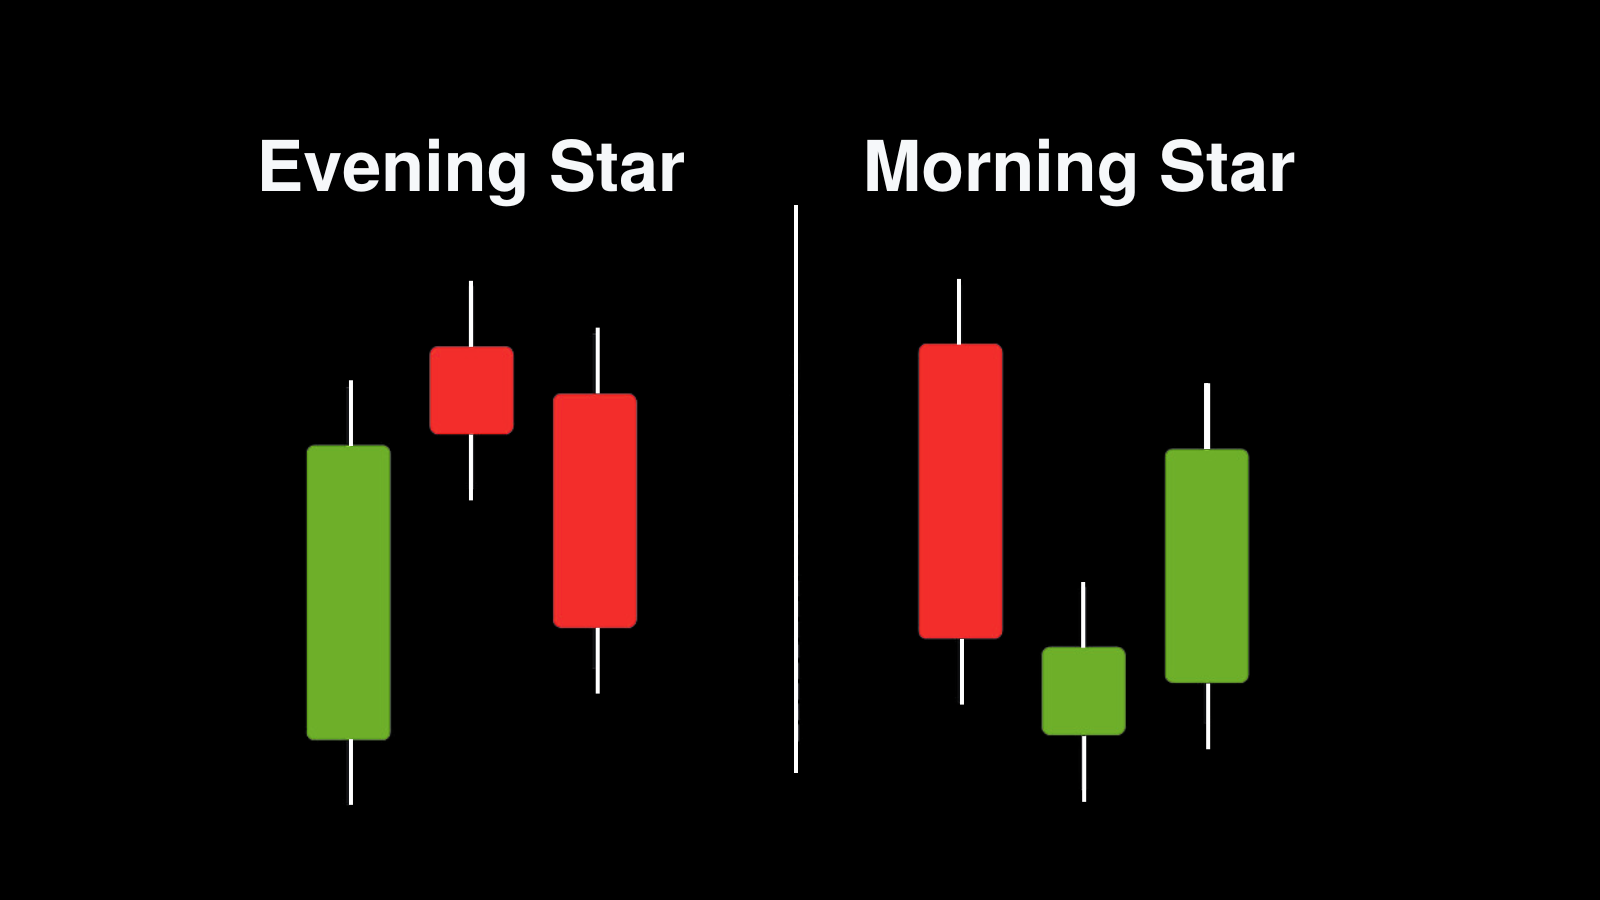
| Morning Star | After a downtrend | Bullish reversal |
| Evening Star | After an uptrend | Bearish reversal |
| Standard Doji | Any trend | Wait for confirmation |
Trading tip
Never trade a Doji alone. Wait for the next candle to confirm direction. A Doji followed by a strong bullish candle (Morning Star) is a high-confidence long entry. Pair with MACD crossovers for added confirmation.
🔗 Learn more: Doji patterns on altFINS
Asset with Bullish Doji Candlestick Pattern
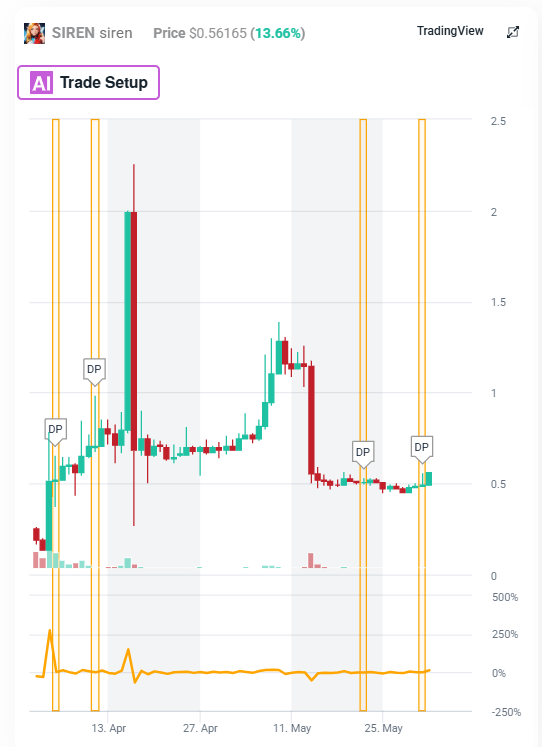
🔗 These are coins with Bullish Doji Candlestick Patterns now on 1D interval!
3. Engulfing Patterns
Bullish or bearish reversal | 2-candle pattern
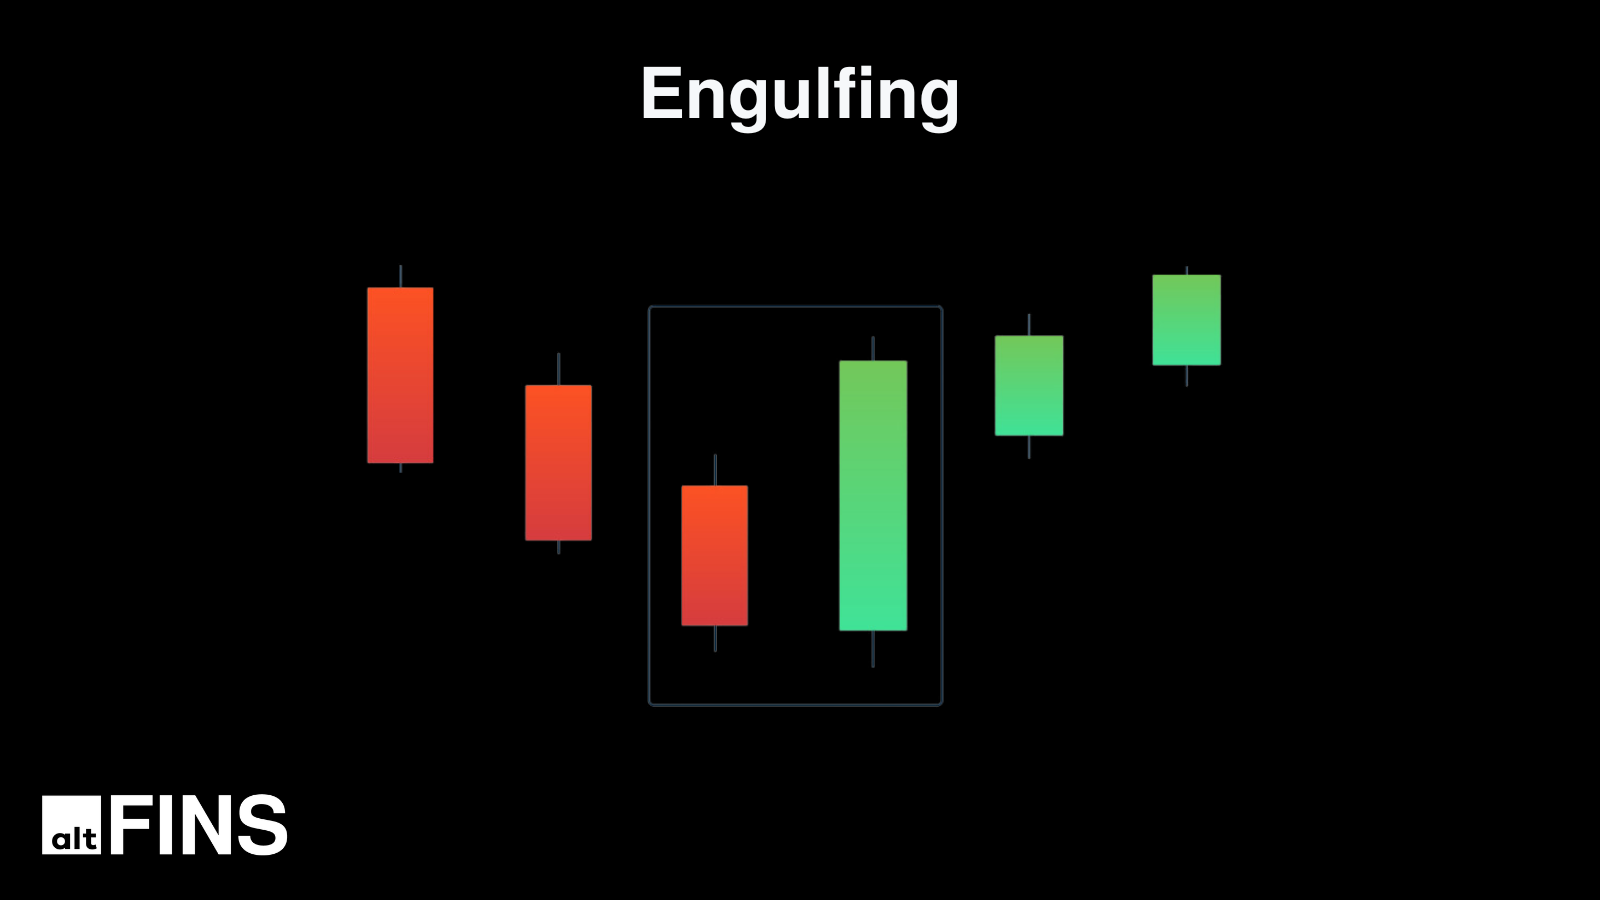
An Engulfing pattern occurs when a second candle completely swallows the body of the first. It signals an aggressive, decisive shift in control — the kind of momentum change that often marks the beginning of a meaningful new trend.
Bullish Engulfing
A large green candle fully covers the prior red candle. Forms after a downtrend. Signals buyers have overwhelmed sellers — a potential upward reversal.
Bearish Engulfing
A large red candle fully engulfs the prior green candle. Forms after an uptrend. Signals sellers have taken control — a potential downward reversal.
Trading tip
Wait for one confirming candle before entering. Place your stop-loss behind the engulfed candle’s low (for bullish) or high (for bearish). Combining with RSI divergence significantly increases accuracy.
🔗 Learn more: Bullish Engulfing on altFINS
● Already spotted a pattern?
See which coins are forming Engulfing patterns right now
Use the altFINS pre-set filter to instantly scan 2,000+ coins for confirmed Bullish Engulfing setups — filtered by trend, RSI, and timeframe.
✓ Real-time signals
✓ Free to start
Assets with Bullish Engulfing Candlestick Patterns
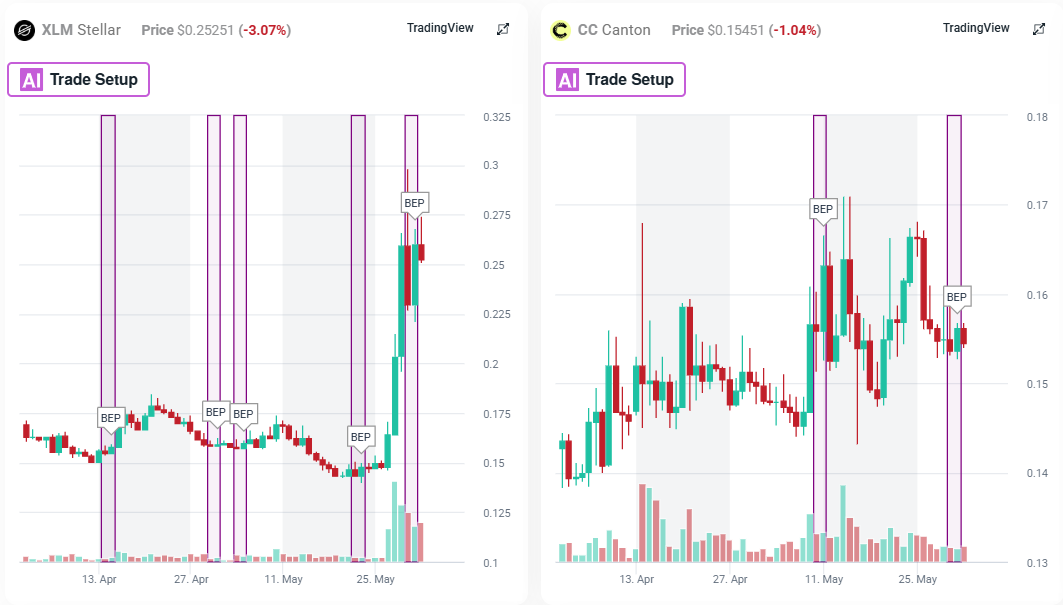
🔗 These are coins with Bullish Engulfing Candlestick Patterns now on 1D interval!
4. Hammer
Bullish reversal | Single candle
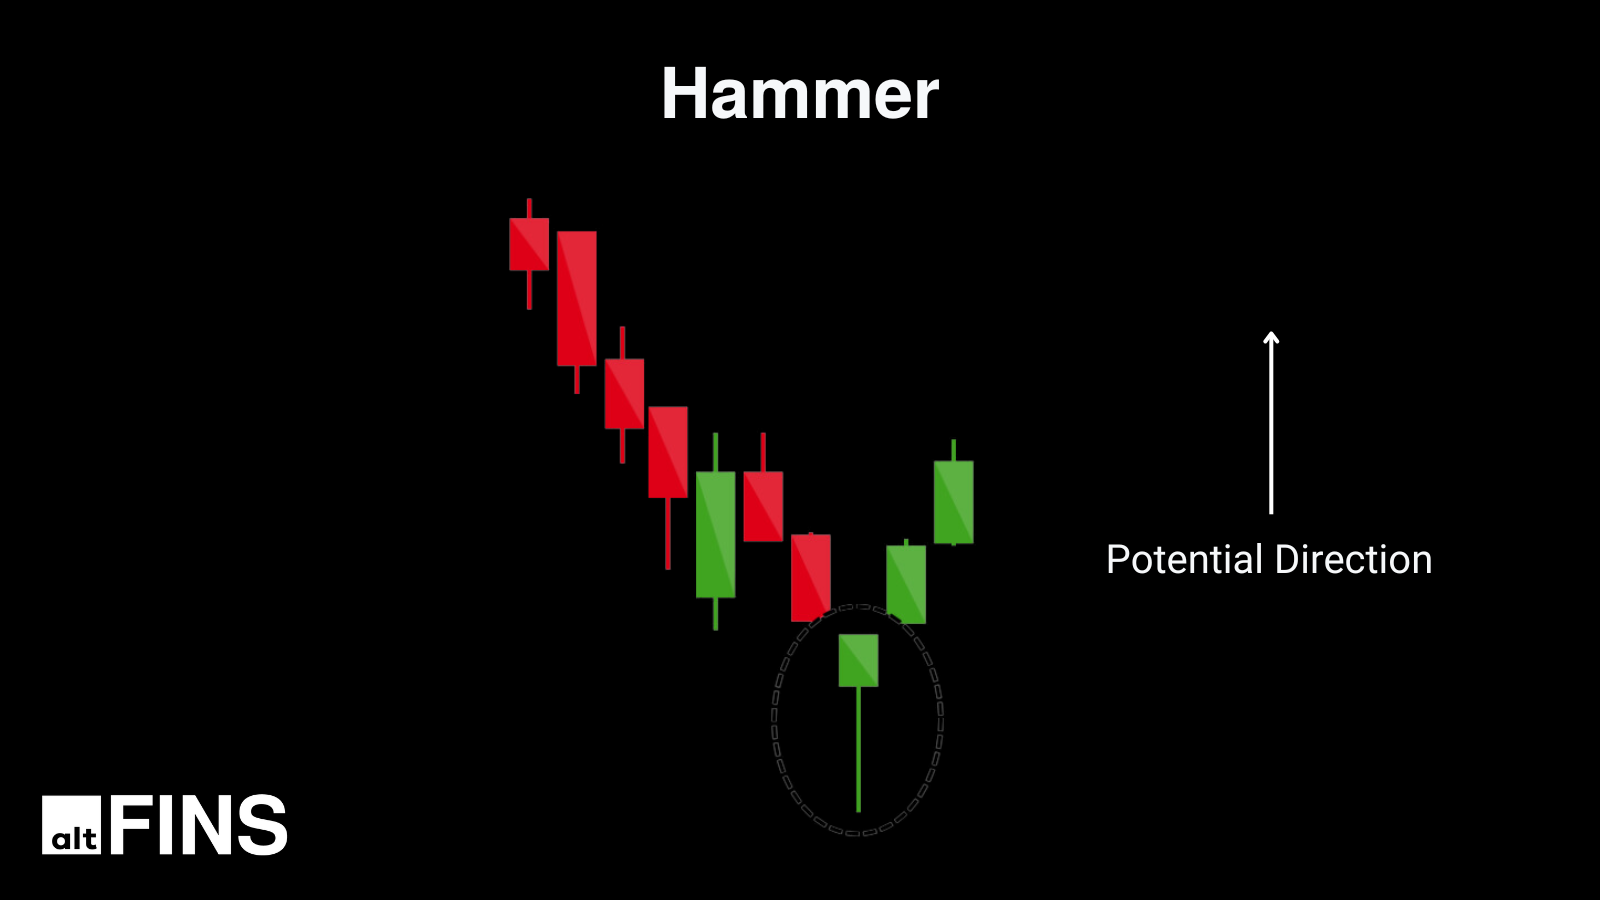
The Hammer is one of the most recognisable and reliable single-candle reversal patterns. It forms during a downtrend when sellers push price aggressively lower — only for buyers to step in and drive it back up, closing near the session high. The result is a candle that looks like a hammer: small body, very long lower shadow, minimal upper shadow.
Anatomy of a valid Hammer:
- Small real body near the top of the candle
- Lower shadow at least 2× the length of the body
- Little to no upper shadow
- Appears after a clear downtrend or at a key support level
Trading tip
Wait for three subsequent bullish candles closing above the Hammer before entering. This multi-candle confirmation dramatically reduces false signals. Place your stop-loss just below the Hammer’s low.
Related pattern: The Inverted Hammer has a long upper shadow and small body at the bottom — it carries the same bullish reversal implication but requires stronger confirmation.
🔗 Learn more: Hammer pattern on altFINS
Assets with Hammer Candlestick Patterns
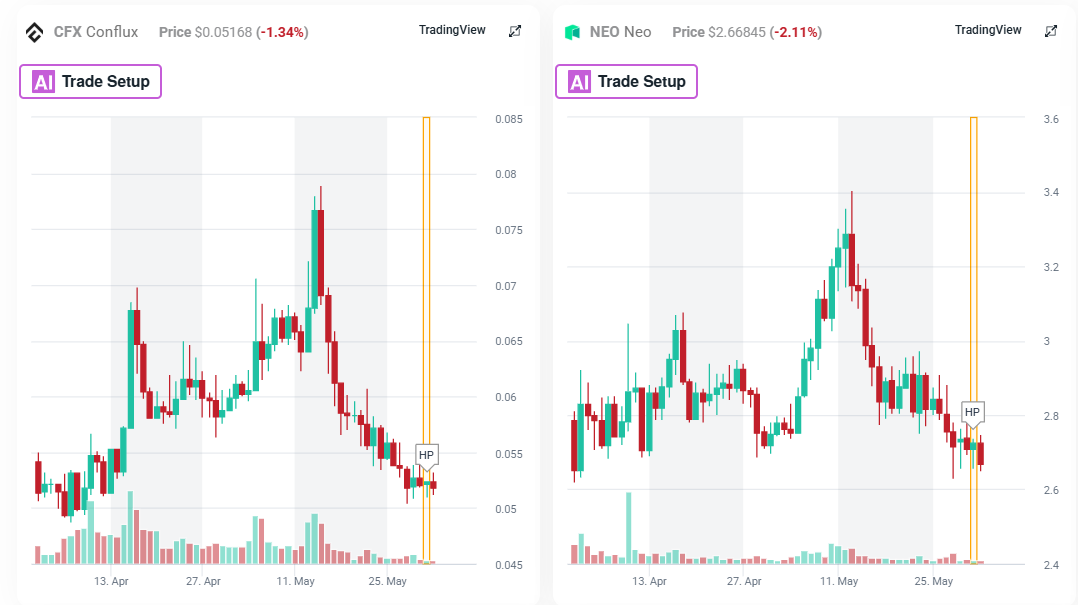
🔗 These are coins with the Hammer Candlestick Patterns now on 1D interval!
5. Perfect Dragonfly Doji
Rare bullish reversal | Single candle
The Perfect Dragonfly Doji is a rare and precise pattern that signals exceptional buyer strength. The open, high, and close prices are all identical (or nearly so), with a long lower shadow extending well below. This means price tested lower levels decisively — and was fully rejected. Not a small bounce. A complete rejection.
Why it stands out:
- Open = High = Close (or within a very tight range)
- Long lower shadow — the longer, the more powerful the rejection
- Often coincides with major support, Fibonacci levels, or moving average clusters
- AI pattern engines on altFINS flag these at momentum exhaustion points
Trading tip
Confirm with the next candle closing above the Dragonfly. Enter long on that confirmation. Use a tight stop-loss just below the Dragonfly’s low. Look for RSI or OBV divergence to validate the reversal signal.
🔗 Learn more: Dragonfly Doji on altFINS
Assets with the Perfect Dragonfly Doji Candlestick Patterns
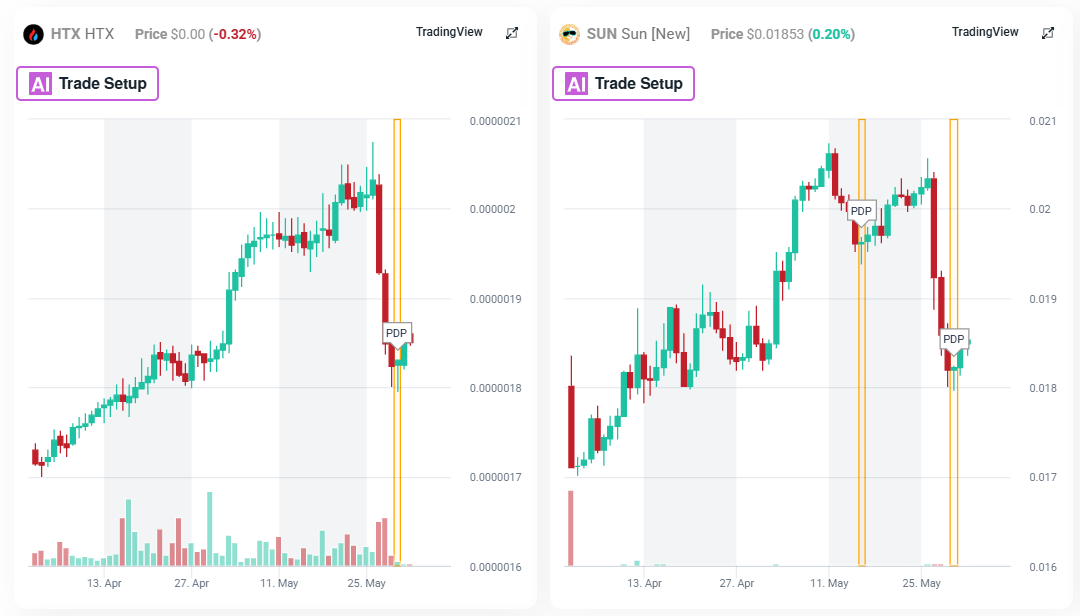
🔗 These are coins with the Hammer Candlestick Patterns now on 1D interval!
How to identified candlestick patterns on altFINS
You can easily find 1-, 2-, and 3+ candlestick formations (like the Hammer, Doji, or Engulfing) using the altFINS Crypto Screener or Signals Summary
-
Preset Crypto Screener Filters: Quickly scan for patterns across 2,000+ coins
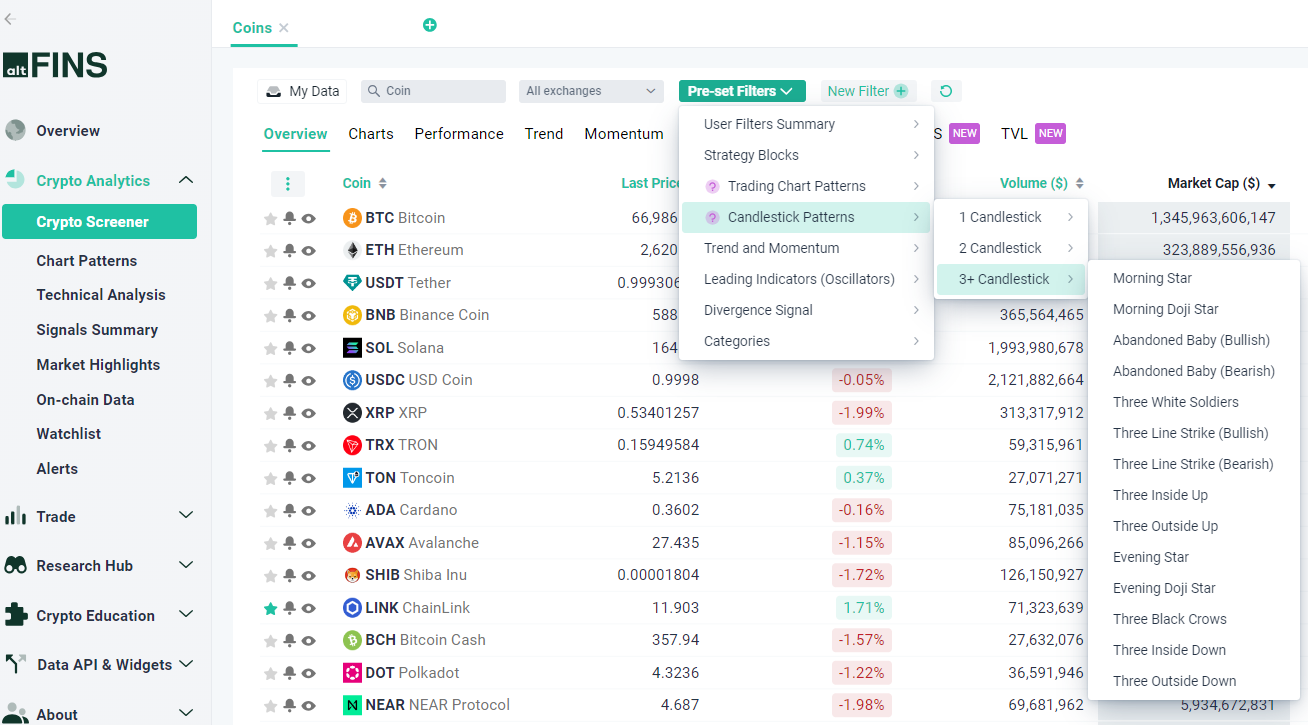
- Crypto Screener Custom Filters: Create your own screens with Candlestick Patterns
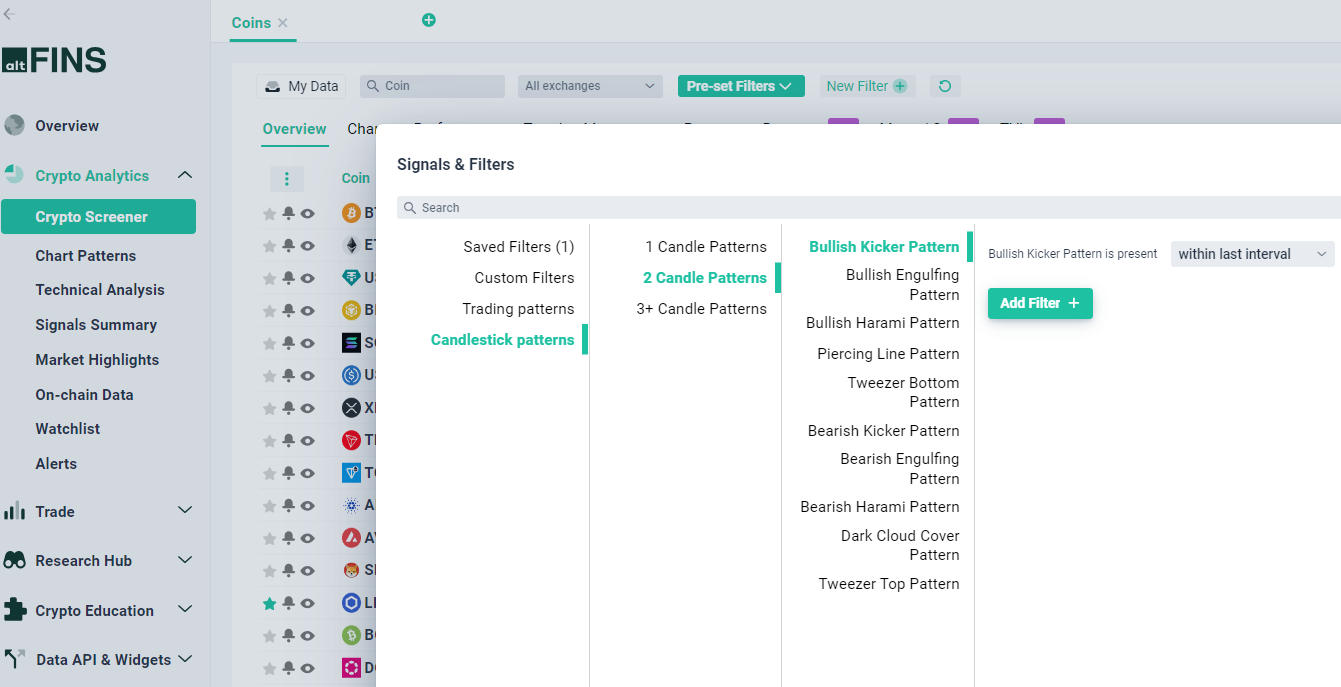
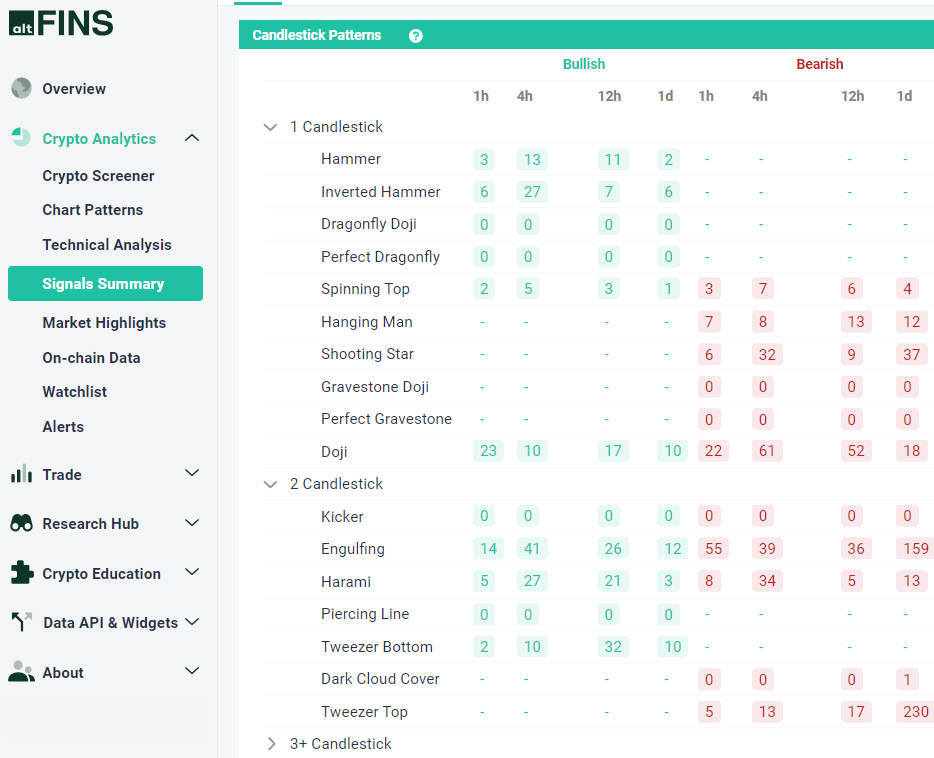
- Signals Summary: Easily find bullish or bearish 1,2,3- Candlestick Patterns across four time intervals
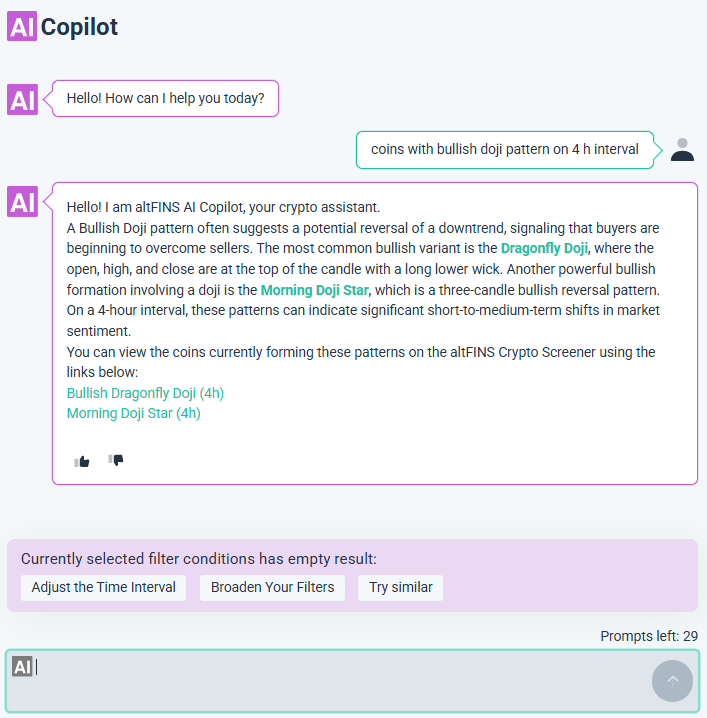
- AI Copilot: Ask in AI Copilot in any language and get a screener filter link with explanation in seconds
How to trade candlestick patterns effectively
Spotting a pattern is only the first step. Profitable traders combine candlestick signals with technical context and risk management. Here is a repeatable three-step process:
Identify the pattern
Use the altFINS Screener to scan for patterns across 2,000+ coins in seconds. Pre-set filters for each pattern type are already built in.
Confirm the trend and indicators
Check the broader trend using moving averages. Look for RSI confirmation (oversold for bullish, overbought for bearish). Volume should support the pattern direction.
Manage risk before entering
Set your stop-loss based on the pattern structure (below the Hammer low, below the first Soldier, etc.). Define your risk-reward ratio before you enter. Never risk more than you planned.
Quick reference: The 5 patterns at a glance
| Pattern | Type | Candles | Best timeframe | Confirmation |
|---|---|---|---|---|
| Three White Soldiers | Bullish | 3 | 4H, Daily | Volume spike |
| Doji | Indecision | 1–3 | Any | Next candle direction |
| Engulfing | Bullish / Bearish | 2 | 1H, 4H, Daily | RSI divergence |
| Hammer | Bullish | 1 | 4H, Daily | 3 bullish closes above |
| Perfect Dragonfly Doji | Bullish (rare) | 1 | Daily, Weekly | Next candle close above |
● altFINS Crypto Screener
Your next trade could be forming right now
Join 150,000+ traders who use altFINS to scan 2,000+ coins for candlestick patterns in real time — with RSI, trend, and volume filters built in.
Scan Candlestick Patterns Free →
✓ Real-time signals
✓ No credit card required
✓ 150,000+ traders
Frequently asked questions
What is the most reliable candlestick pattern for crypto?
No single pattern is universally reliable, but Three White Soldiers and Bullish Engulfing tend to produce the most consistent results when confirmed by volume and RSI. The best results always come from combining multiple signals.
Which timeframe works best for candlestick patterns?
The 4-hour and Daily charts produce the highest-quality signals with fewer false positives. Shorter timeframes (15m, 1H) can work but require tighter risk management and faster execution.
How do I find candlestick patterns quickly across many coins?
The altFINS Crypto Screener automates this completely. Select a pattern from the pre-set filters and it instantly scans 2,000+ coins, returning only the coins currently matching your criteria.
Can I use candlestick patterns without other indicators?
Technically yes, but it is not recommended. Patterns used in isolation have a meaningfully higher false signal rate. Combining with RSI, MACD, volume analysis, and trend context is best practice for consistent results.
Related guides on altFINS
- The Dragonfly Doji Candlestick Pattern
- The Hammer Candlestick Pattern
- The Inverted Hammer Candlestick Pattern
- Bullish Engulfing Candlestick Pattern
- Gravestone and Perfect Gravestone Doji
- The Spinning Top Candlestick Pattern
- Understanding Basic Candlestick Charts
This article is for educational purposes only and does not constitute financial or investment advice. Crypto markets are highly volatile. Always conduct your own research and apply appropriate risk management before trading.
