Search Knowledge Base by Keyword
Fibonacci Patterns
Introduction
Fibonacci patterns are commonly utilized in crypto trading as a technical analysis tool to pinpoint potential support and resistance levels based on the Fibonacci sequence. Traders use Fibonacci retracement and extension levels – derived from key ratios such as 61.8%, 38.2%, and 23.6% – to forecast price movements and determine optimal entry and exit points. By identifying a trend’s high and low points, these levels are plotted on a price chart to help predict potential corrections or continuations. The psychological impact of these levels, influenced by natural patterns and investor behavior, contributes to their widespread use in analyzing the highly volatile cryptocurrency market.
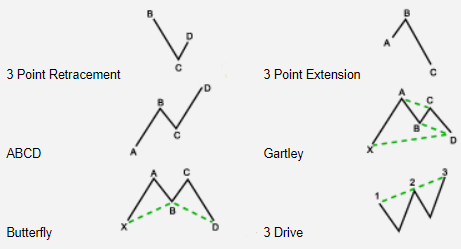
There Are Three Main Groups of Fibonacci Patterns:
(1) we have three point patterns like retracements and extent0ions
(2) four point patterns (the ABCDs)
(3) five point pattern like Gartley, butterfly, and three drives.
Fibonacci retracements and extensions plot possible levels of support and resistance. Fibonacci price levels are created by tracking a price’s primary move and its retracement.
Looking to effortlessly find and trade Fibonacci patterns? Explore altFINS and access them with just a few clicks! More details are in the end of this article.
Tutorial Video – How To Use Fibonacci Retracement?
Advanced traders love using Fibonacci Retracement Levels. It’s a powerful and actually very easy concept to apply. Let us teach you how. Fibonacci Retracement Levels act as potential support levels, especially after a significant price rise. It can help with trade entry during a pullback in Uptrend. altFINS’ trade setups (Technical Analysis for 60 major altcoins) use this indicator to pinpoint support levels for optimal swing trade entry.
How Fibonacci Patterns Emerge in Price Charts
Fibonacci retracements are created by taking two extreme points (usually a peak and a trough) on a price chart and dividing the vertical distance by the key Fibonacci ratios of 23.6%, 38.2%, 50%, 61.8%, and 100%. Common Fibonacci extension levels are 61.8%, 100%, 161.8%, 200%, and 261.8%.
Fibonacci retracements and extensions are used by traders identify possible support and resistance levels in situations when such levels are difficult to identify. Traders use them to determine critical points where an asset’s price momentum is likely to reverse. They’re also used to place stop-loss orders and set target prices.
All 3 point retracements are emerging four-point ABCDs, and many 4-point ABCDs are also emerging five point Gartlies or butterflies. This is because the patterns with more points contain or are made up from patterns with fewer points.
The way to recognize that you are looking at an emerging Fibonacci pattern is also the color of the direction arrow. If it is grayed out, the pattern is emerging, but a more obvious feature is the pink dot on emerging patterns.
Unlike with chart patterns or emerging patterns that can be straightforward opportunities to trade, with Fibonacci patterns they really are just an early warning signal. Because for the opportunity to realize (complete pattern), two things still need to happen. First, the price has to rise to the level of the pink dot. Time is not that important. It can reach the level before or after the dot, as long as it is on that level. Second thing that needs to happen is that price should encounter support or resistance at the level of the dot, depending on whether it is a bullish or bearish pattern. Only if the price reaches this level and turns around at this level, then the expectation is that there will be support or resistance at the Fibonacci levels that follow.
Because of the many requirements for a Fibonacci emerging pattern to complete, there are many of them that never do. As a trader, the ones that will be of more interest to you would be the higher-order ones: the five point Gartley and Butterflies, because they are more valuable patterns. And the way they fit with the Fibonacci theory by meeting a considerable number of requirements, you are increasing your odds for trading in the right direction.
What Are Fibonacci Patterns in Trading?
Fibonacci patterns are price chart formations based on the Fibonacci sequence, a mathematical pattern where each number is the sum of the two preceding ones. In trading, Fibonacci ratios like 23.6%, 38.2%, 50%, 61.8%, and 100% are used to analyze potential price levels for reversals, continuations, or retracements. These ratios are integral to understanding market psychology and identifying key trading opportunities.
The Three Main Groups of Fibonacci Patterns
1. Three-Point Patterns: Retracements and Extensions
Fibonacci retracements and extensions help traders plot possible levels of support and resistance. These patterns are created by tracking an asset’s primary price move and its retracement.
Fibonacci Retracements:
By identifying a peak and a trough, traders divide the vertical distance by the key Fibonacci ratios:
23.6%
38.2%
50%
61.8%
100%
These levels indicate potential support during an uptrend or resistance during a downtrend.
Fibonacci Extensions:
Common extension levels include:
61.8%
100%
161.8%
200%
261.8%
Extensions project potential future price targets beyond the original range.
Application:
Traders use these levels to identify potential price reversal zones, set stop-loss orders, and determine target prices.
2. Four-Point Patterns: ABCD Patterns
The ABCD pattern is a four-point Fibonacci pattern that highlights potential reversal zones based on symmetry and proportion.
Key Characteristics:
Point A to B represents the initial price move.
Point B to C signifies a retracement, often aligning with Fibonacci retracement levels.
Point C to D is the continuation, mirroring the A to B move in magnitude and duration.
Application:
ABCD patterns are reliable setups for identifying trend reversals or continuations. Traders often use them as stepping stones to recognize more complex patterns.
3. Five-Point Patterns: Gartley, Butterfly, and Three Drives
Five-point patterns like the Gartley, butterfly, and three drives are advanced Fibonacci formations that integrate multiple retracements and extensions.
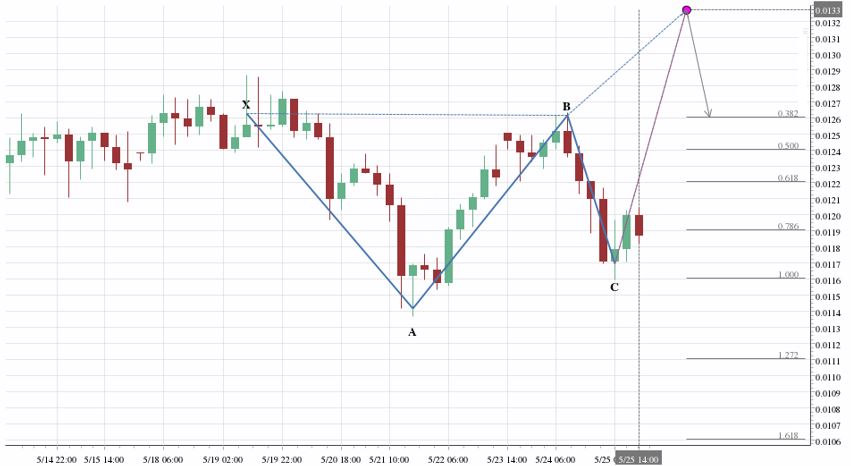
Gartley Pattern:
A bullish or bearish Gartley pattern includes:
- Point X to A: Initial price move.
- Point A to B: Retracement, often aligning with 61.8%.
- Point B to C: A shallower retracement.
- Point C to D: A final move to the 78.6% retracement level of X to A.
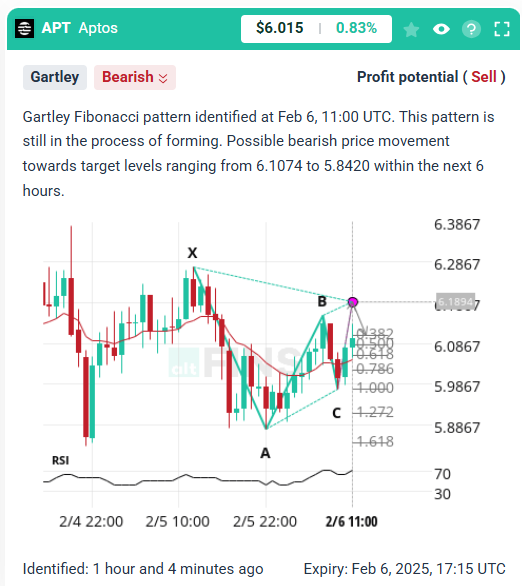
Example of Bearish Gartley Pattern
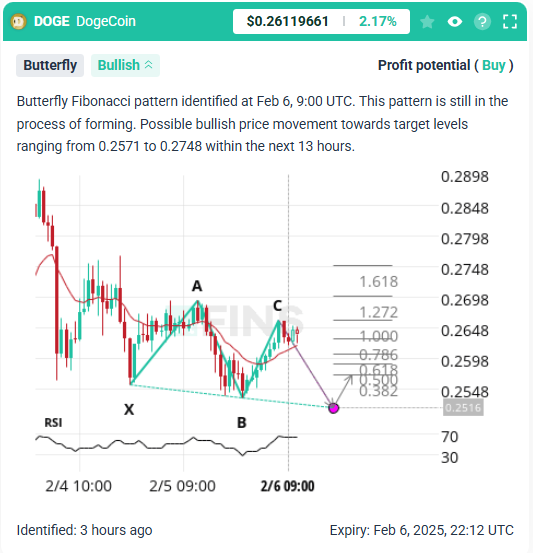
Butterfly Pattern:
Similar to the Gartley but extends beyond Point X, typically aligning with the 127.2% or 161.8% extension.
Example of Butterfly Pattern
Three Drives Pattern:
A sequence of three symmetrical price moves and retracements, all aligned with Fibonacci ratios.
Application: These high-order patterns are considered more reliable because they meet stricter criteria, increasing the likelihood of a successful trade.
Recognizing Emerging Fibonacci Patterns
Identifying emerging Fibonacci patterns is crucial for traders who want to act before the pattern completes. Here’s how:
- Visual Cues: Emerging patterns often display a grayed-out direction arrow and a pink dot indicating the expected completion level.
- Price Movement Requirements: The price must reach the level indicated by the pink dot. The price should encounter support or resistance at this level, depending on whether the pattern is bullish or bearish.
Pro Tip: Not all emerging patterns will complete, but focusing on higher-order patterns like the Gartley and butterfly can yield better results.
How to Use Fibonacci Patterns in Your Trading Strategy
Identify the Pattern: Use charting tools to locate potential Fibonacci retracements, extensions, or complex patterns like the ABCD or Gartley.
Validate with Fibonacci Levels: Ensure the price levels align with key Fibonacci ratios for greater accuracy.
Set Entry and Exit Points:
- Entry: Near the completion point of the pattern (e.g., the pink dot).
- Stop-Loss: Slightly beyond the level of the expected support or resistance.
- Target: Based on Fibonacci extension levels.
- Confirm with Other Indicators:
Combine Fibonacci patterns with RSI, MACD, or moving averages for additional confirmation.
The Importance of Higher-Order Patterns
While three-point and four-point patterns provide valuable insights, five-point patterns like the Gartley and butterfly are more dependable. They align closely with Fibonacci theory and offer a higher probability of success, making them indispensable tools for advanced traders.
Fibonacci patterns offer a robust framework for analyzing price movements and making strategic trading decisions. From simple retracements to complex five-point patterns, understanding these formations can enhance your trading skills and improve your profitability.
Start incorporating Fibonacci patterns into your trading strategy today, and unlock the potential of these timeless mathematical principles!
How to find Fibonnaci Patterns on altFINS?
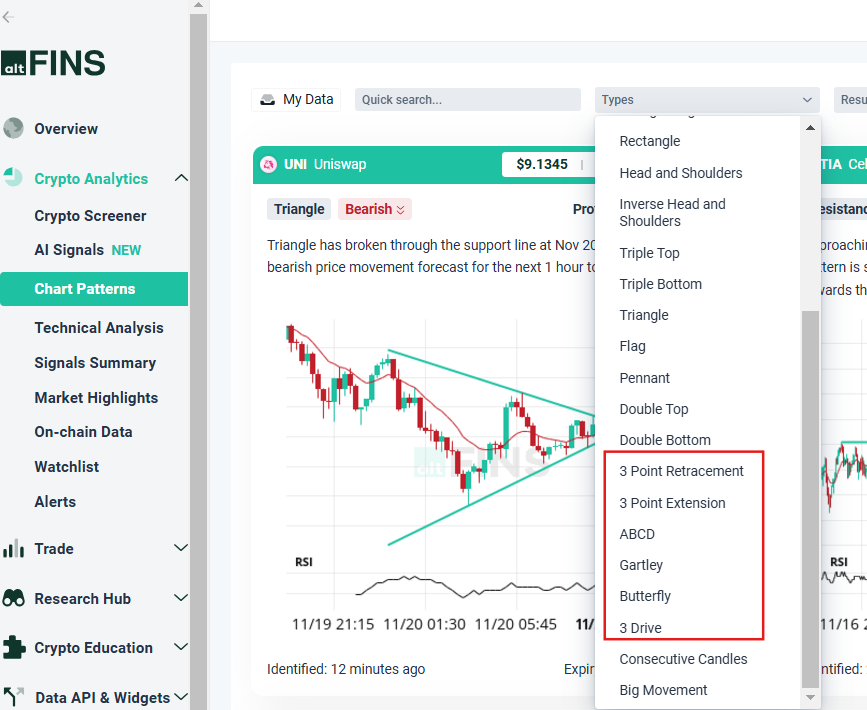
altFINS features AI pattern recognition that scan for emerging Fibonacci patterns like: ABCDs, Gartleys, Butterflies, 3Drive, 3 Point Retracement, and 3 Point Extension.
-
Fibonacci Patterns on Chart Patterns Section
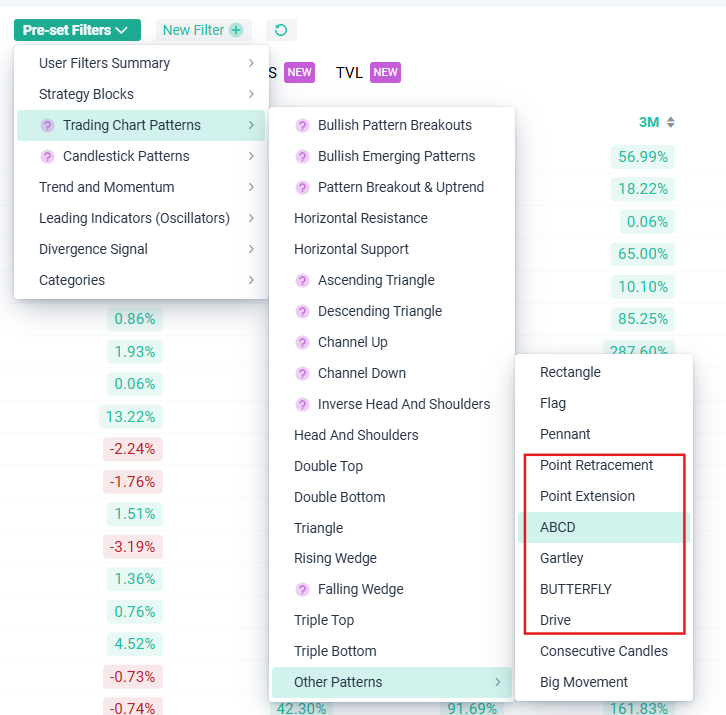
-
Fibonacci Patterns on Crypto Screener Section
Looking to effortlessly find and trade Fibonacci patterns? Explore altFINS and access them with just a few clicks!
