Search Knowledge Base by Keyword
Fibonacci Retracement Levels: The Complete Crypto Trading Guide (2026)
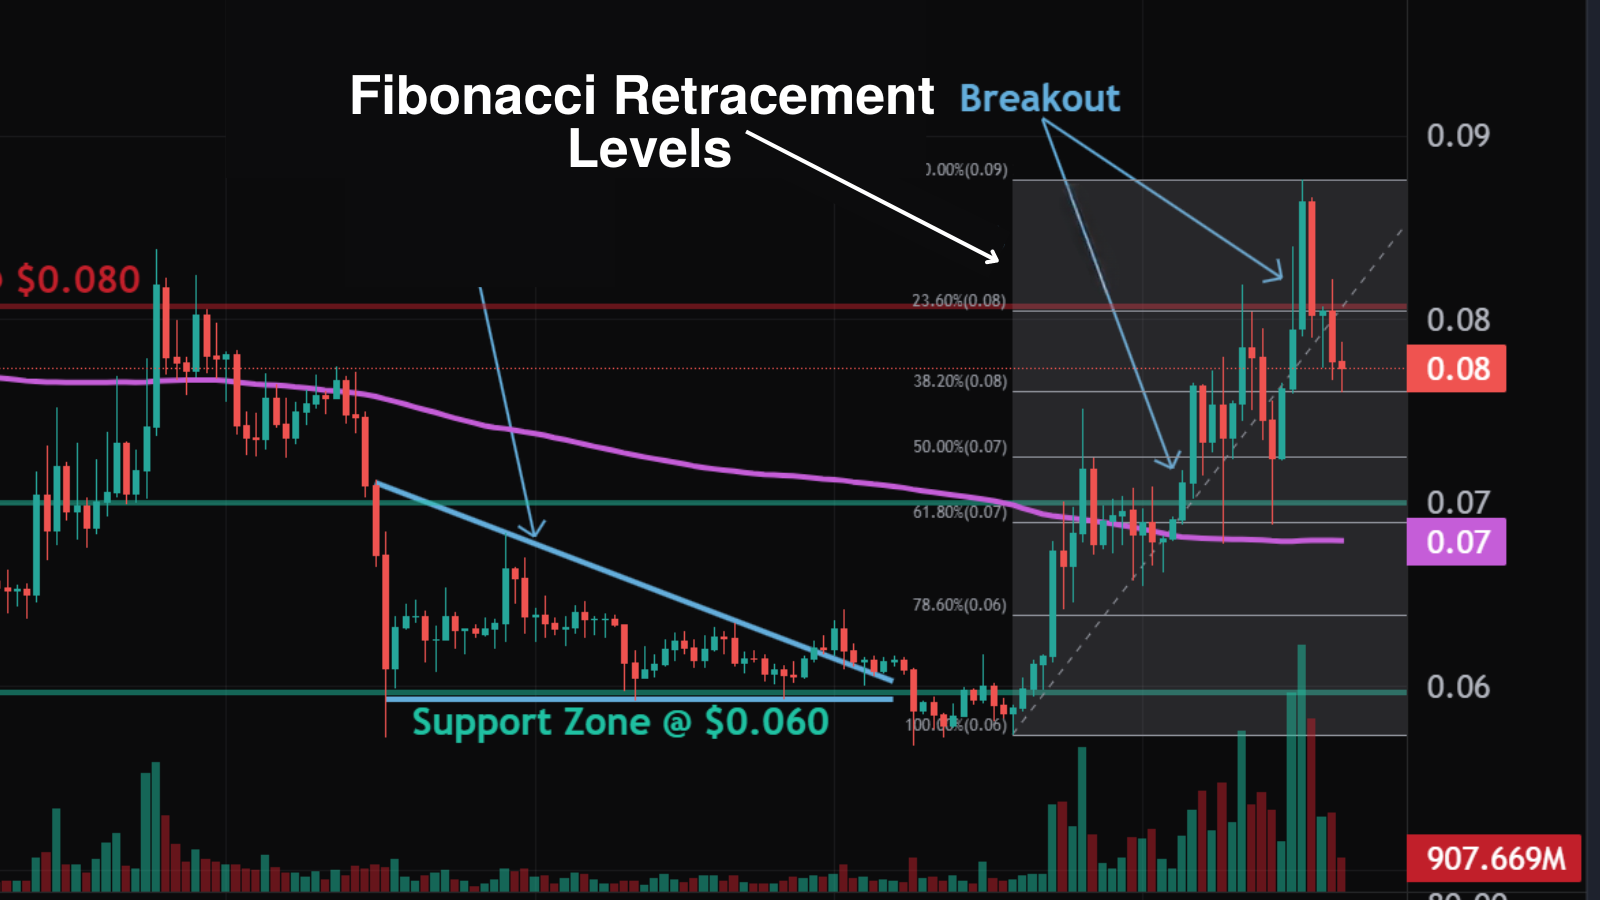
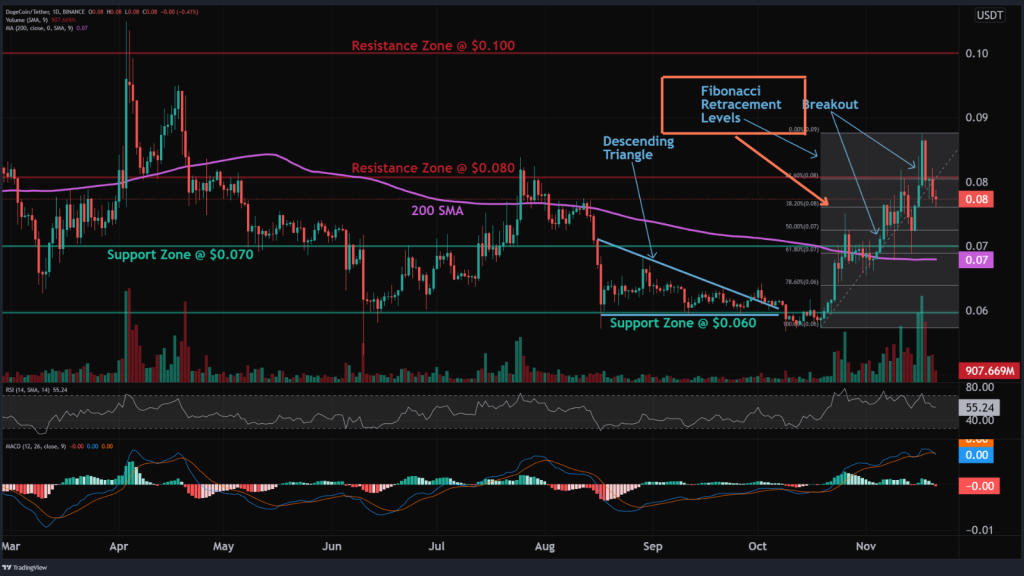
Fibonacci Retracement Levels are horizontal support and resistance zones drawn between a swing high and a swing low, based on the key ratios 23.6%, 38.2%, 50%, 61.8%, and 78.6%. Traders use them to predict where a pullback is likely to reverse — making them one of the most popular tools in crypto technical analysis.
In this guide you’ll learn how to calculate Fibonacci retracement levels, how to draw them correctly, a real Bitcoin example with numbers, how to combine them with other indicators, plus Fibonacci extensions for setting price targets.
Quick Answer (TL;DR):
- What they are: potential support/resistance levels based on Fibonacci ratios.
- Key levels: 23.6%, 38.2%, 50%, 61.8% (the “golden ratio”), and 78.6%.
- How to use: draw between a swing high and swing low to spot pullback reversal zones.
- Best practice: combine with volume, RSI, moving averages, or candlestick patterns.
What Are Fibonacci Retracement Levels?
Fibonacci Retracement Levels are horizontal price lines that identify potential support and resistance zones during a pullback within a trend. They’re derived from the Fibonacci sequence, a famous series of numbers discovered by the 13th-century Italian mathematician Leonardo Fibonacci.
In crypto trading, these levels help answer one of the most important questions every trader faces: “After a rally, how far will price pull back before resuming the trend?”
Tutorial Video: Fibonacci Retracement Levels
The Fibonacci Sequence
The sequence starts with 0 and 1, and every next number is the sum of the two before it:
0, 1, 1, 2, 3, 5, 8, 13, 21, 34, 55, 89, 144, 233…
Dividing numbers in this sequence produces the key Fibonacci ratios: 23.6%, 38.2%, 50%, 61.8%, and 78.6%. The 61.8% level is particularly famous — it’s called the Golden Ratio and appears throughout nature, architecture, and financial markets.
The 5 Key Fibonacci Retracement Levels Explained
| Level | Meaning | Trader Interpretation |
|---|---|---|
| 23.6% | Shallow pullback | Very strong trend — buyers barely let price dip. |
| 38.2% | Moderate pullback | Healthy retracement in a strong trend. |
| 50% | Halfway point (not a true Fib number) | Widely respected psychological level. |
| 61.8% | The Golden Ratio | Most closely watched — major reversal zone. |
| 78.6% | Deep pullback | Last line of defense — break below invalidates the trend. |
How to Calculate Fibonacci Retracement Levels (With Real Example)
Let’s walk through a concrete example using Bitcoin. Assume BTC rallies from a swing low of $60,000 to a swing high of $100,000. The total move = $40,000.
Now calculate where each Fibonacci retracement level sits:
| Level | Calculation | BTC Price |
|---|---|---|
| 23.6% | $100,000 − (0.236 × $40,000) | $90,560 |
| 38.2% | $100,000 − (0.382 × $40,000) | $84,720 |
| 50% | $100,000 − (0.50 × $40,000) | $80,000 |
| 61.8% | $100,000 − (0.618 × $40,000) | $75,280 |
| 78.6% | $100,000 − (0.786 × $40,000) | $68,560 |
The simple formula:
Retracement Level = Swing High − (Fib Ratio × [Swing High − Swing Low])
In practice, you won’t need to calculate manually — every modern charting tool, including altFINS charts, TradingView, and Binance, has a built-in Fibonacci drawing tool.
How to Draw Fibonacci Retracement in 4 Steps
- Identify the trend. Fibonacci works best on established trends, not sideways chop. Use a moving average or trendline to confirm direction.
- Locate the swing high and swing low. The swing high is the highest point before a significant pullback; the swing low is the lowest point before the rebound that started the rally.
- Draw the Fibonacci tool from swing low to swing high (for an uptrend) or from swing high to swing low (for a downtrend). The retracement levels will plot automatically.
- Watch for reactions. When price approaches a level, look for candlestick signals, volume spikes, or indicator confirmations before entering a trade.
Fibonacci Retracement in Uptrends vs. Downtrends
| Market Condition | Fib Levels Act As | Trade Idea |
|---|---|---|
| Uptrend pullback | Support | Look to buy bounces at 38.2%, 50%, or 61.8%. |
| Downtrend rally | Resistance | Look to short rejections at 38.2%, 50%, or 61.8%. |
Fibonacci Confluence: The Secret to Higher Win Rates
A Fibonacci level alone is a decent signal. A Fibonacci level that aligns with other technical factors is a high-probability setup. Look for these confluences:
- Horizontal support/resistance: if a previous swing low sits right at the 61.8% level, the zone becomes much stronger.
- Moving averages: the 50-day or 200-day SMA intersecting with a Fib level creates dynamic + static support.
- Oversold/overbought RSI: an RSI below 30 at the 61.8% retracement signals likely exhaustion of the pullback.
- Candlestick patterns: a Dragonfly Doji or Bullish Engulfing at a Fib level = strong reversal setup.
- Volume spike: rising volume on the bounce confirms real buying interest.
Pro tip: Check Fibonacci levels on multiple time frames. A level that appears on the daily AND the 4-hour chart carries much more weight than one that’s only visible on one time frame.
Fibonacci Extensions: Setting Price Targets
While retracements help you find entries, Fibonacci Extensions help you find exits. They project potential price targets beyond the original swing high in the direction of the trend.
Key extension levels:
| Extension Level | Typical Use |
|---|---|
| 127.2% | First profit-taking target after a breakout. |
| 161.8% | Main target — extension of the Golden Ratio. |
| 261.8% | Aggressive target for trending markets / parabolic moves. |
Example: BTC breaks out above $100,000 after pulling back to the 61.8% retracement at $75,280. A trader targeting the 161.8% extension would set a profit target at roughly $124,720 — a natural magnet for trending price action.
A Complete Fibonacci Trade Plan
- Confirm the trend using a 50-day or 200-day moving average.
- Draw Fibonacci from the most recent significant swing low to swing high.
- Wait for a pullback to a key retracement level (usually 38.2%, 50%, or 61.8%).
- Look for confluence: candlestick reversal + RSI oversold + volume spike + horizontal support.
- Enter the trade on the first bullish confirmation candle.
- Set stop-loss just below the next Fibonacci level (e.g., entering at 50% → stop below 61.8%).
- Set take-profit at the 127.2% or 161.8% Fibonacci Extension.
- Move stop to break-even once price reaches the 100% level.
Limitations: Why Fibonacci Isn’t Magic
Like every technical tool, Fibonacci has weaknesses you must understand:
- Too many levels: with 5+ retracement lines, some will always act as support — which makes post-hoc explanation easy but prediction harder.
- Subjectivity: different traders pick different swing highs and lows, producing different Fibonacci zones.
- Self-fulfilling prophecy: Fibonacci works partly because so many traders watch it. In thin markets or low-float altcoins, this effect weakens.
- No signal in chop: sideways markets produce meaningless retracements.
- Not a standalone system: must be combined with price action, volume, and other indicators.
Common Mistakes to Avoid
- Using Fibonacci on sideways charts. No trend = no meaningful retracement.
- Drawing from arbitrary points. Always use significant, clearly visible swing highs and lows.
- Ignoring the broader trend. Don’t buy a 61.8% pullback if the overall market structure is bearish.
- Trading every touch. Wait for confirmation — candlestick, volume, or indicator.
- Forgetting risk management. Even the best Fib setup fails sometimes. Always use stops.
How to Find Fibonacci Setups with altFINS
Manually scanning dozens of charts for Fibonacci setups is slow. altFINS makes it faster:
- Technical Analysis charts with built-in Fibonacci Retracement and Extension drawing tools.
- Crypto Screener to find coins in pullback zones with oversold RSI — perfect for Fibonacci setups.
- Signals Summary to cross-check if a Fib bounce aligns with other bullish indicators.
Key Takeaways
- Fibonacci Retracement Levels are 23.6%, 38.2%, 50%, 61.8%, and 78.6% — potential support/resistance zones during pullbacks.
- The 61.8% Golden Ratio is the most important single level.
- Draw Fibonacci between the most significant swing high and low.
- Confluence with moving averages, volume, RSI, and candlestick patterns drastically improves reliability.
- Use Fibonacci Extensions (127.2%, 161.8%, 261.8%) to set realistic price targets.
- Always combine with risk management — Fibonacci is a tool, not a guarantee.
- Use the altFINS platform to chart Fibonacci setups and scan for confluence in seconds.
Frequently Asked Questions (FAQ)
What is Fibonacci Retracement, and how does it apply to crypto trading?
Fibonacci Retracement is a technical analysis tool that identifies potential support and resistance levels during price pullbacks. In crypto, where volatility is high, these levels help traders pinpoint likely reversal zones for entries and exits.
How do I use Fibonacci Retracement in my trading strategy?
Identify a clear trend, draw Fibonacci between the swing high and low, wait for price to pull back to 38.2%, 50%, or 61.8%, look for confluence with other indicators (RSI, volume, candlestick patterns), then enter with a stop-loss below the next level.
What’s the difference between Fibonacci Retracements and Extensions?
Retracements (23.6%, 38.2%, 50%, 61.8%, 78.6%) identify potential reversal points within a trend — typically used for entries. Extensions (127.2%, 161.8%, 261.8%) project future price targets beyond the prior high/low — typically used for exits.
Are Fibonacci levels applicable to all time frames?
Yes, Fibonacci works on any time frame — from 1-minute scalping charts to weekly investing charts. However, higher time frames (daily, weekly) generate more reliable signals because they reflect broader market consensus.
How do I calculate Fibonacci Retracement levels manually?
Use this formula: Retracement = Swing High − (Fib Ratio × [Swing High − Swing Low]). Example: if BTC rallies from $60,000 to $100,000, the 61.8% level = $100,000 − (0.618 × $40,000) = $75,280.
Which Fibonacci level is the most important?
The 61.8% Golden Ratio is the most closely watched level by professional traders. A clean bounce off 61.8% in an uptrend is one of the highest-probability setups in technical analysis.
Why is 50% included if it’s not a true Fibonacci number?
The 50% level is included because it’s a powerful psychological midpoint. Traders naturally watch “half retracement” moves, making it behave as a strong support/resistance zone in practice — even though it doesn’t come from the Fibonacci sequence.
Does Fibonacci work on altcoins?
Yes, but reliability drops on very low-cap, illiquid altcoins where price action is driven by a few large holders. It works best on high-volume coins where many traders actively respect technical levels.
Related Reading
- Mastering Candlestick Patterns for Successful Crypto Trading
- Fibonacci Patterns
- The 200-Day Simple Moving Average
- What is the ATR Indicator?
- Fibonacci Retracement — Investopedia
- TradingView Fibonacci Retracement Guide
Trade Fibonacci Setups Like a Pro
Chart Fibonacci retracements and extensions on 2,000+ coins with altFINS — plus AI-powered signals, chart patterns, and technical analysis built for serious crypto traders.
