Search Knowledge Base by Keyword
The Dragonfly Doji Candlestick Pattern: Complete Trading Guide (2026)
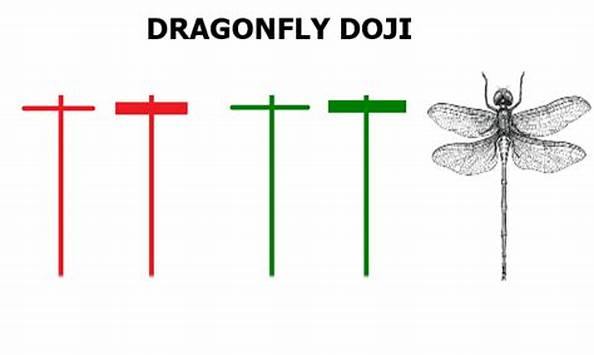
The Dragonfly Doji is a T-shaped candlestick pattern that signals a potential bullish reversal at the bottom of a downtrend. It forms when a candle’s open, high, and close are virtually identical, leaving a long lower wick — visual proof that sellers pushed price down but buyers aggressively rejected the lows.
In this guide you’ll learn how to identify the Dragonfly Doji, when it works best, real examples (including a PEPE trade that doubled), confirmation strategies, and how to scan for it automatically with altFINS.
Quick Answer (TL;DR):
- What it is: T-shaped candle with long lower shadow, no upper shadow, flat top.
- What it signals: Bullish reversal after a downtrend.
- Perfect setup: 2+ red candles → Dragonfly Doji → green confirmation candle.
- Best context: at key support, oversold RSI, or major moving average.
- Market screen with Dragonfly Doji Patterns – see rusults
What Is the Dragonfly Doji?
The Dragonfly Doji is a single-candle reversal pattern in technical analysis. It appears when the open, high, and close prices are the same (or nearly so), while the low is significantly lower — creating a distinct “T” shape on the chart.
It typically emerges at the bottom of a downtrend and represents a moment where sellers lost control: they drove price down during the session, but buyers stepped in with enough force to push it back to the opening level before the candle closed.
Visual Anatomy of the Dragonfly Doji
| Candle Element | Dragonfly Doji Characteristic |
|---|---|
| Upper shadow | None or extremely small |
| Real body | Flat — open, high, and close are essentially the same |
| Lower shadow (wick) | Long — the defining feature |
| Location | Bottom of a downtrend (ideally at support) |
The Market Psychology Behind the Pattern
Every candle tells a story — the Dragonfly Doji tells one of seller exhaustion and buyer conviction:
- Sellers dominate early: price drops sharply from the open, creating the long lower wick.
- Buyers step in hard: aggressive buying absorbs all the selling pressure.
- Price closes at the high: buyers completely reclaim the session’s losses.
- Sentiment shifts: the tug-of-war ends in favor of bulls, hinting at a trend reversal.
This is why a Dragonfly Doji preceded by several red candles is so powerful — it marks the exact moment when buying pressure overwhelms a tired downtrend.
The “Perfect” Dragonfly Doji Setup
Not every Dragonfly Doji is worth trading. The Perfect Dragonfly Doji setup has three elements that dramatically improve the win rate:
The 3-Candle Perfect Setup:
- At least 2 red (down) candles preceding the pattern → confirms an active downtrend.
- The Dragonfly Doji itself → signals rejection of lower prices.
- A green (up) candle after → confirms the reversal is real, not a one-day fluke.
Real Example: PEPE’s +100% Dragonfly Doji Trade
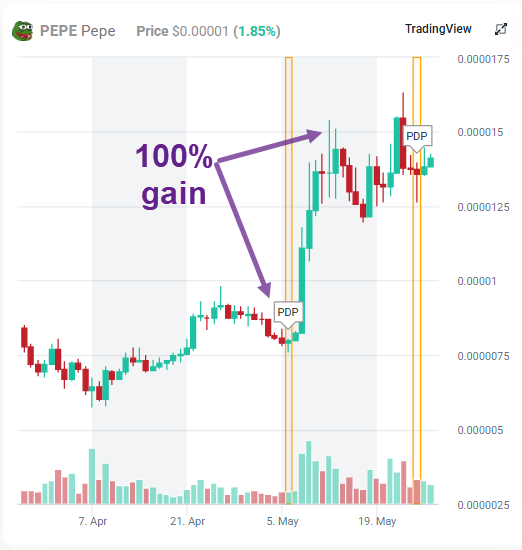
One of the cleanest Dragonfly Doji trades in recent memory happened on PEPE (a popular meme coin). Here’s the exact sequence:
| Step | What Happened |
|---|---|
| 1. Downtrend | 5 consecutive red candles — strong selling pressure. |
| 2. Support level | Price reached $0.000008 — a historical support zone. |
| 3. Dragonfly Doji | T-shaped candle formed at the support level in early May. |
| 4. Green confirmation | Next session closed bullish — reversal confirmed. |
| 5. Result | Price doubled (+100%) in the following weeks. |
The key lesson: the pattern alone wasn’t enough — it was the confluence of support + downtrend exhaustion + confirmation candle that made it a high-probability trade.
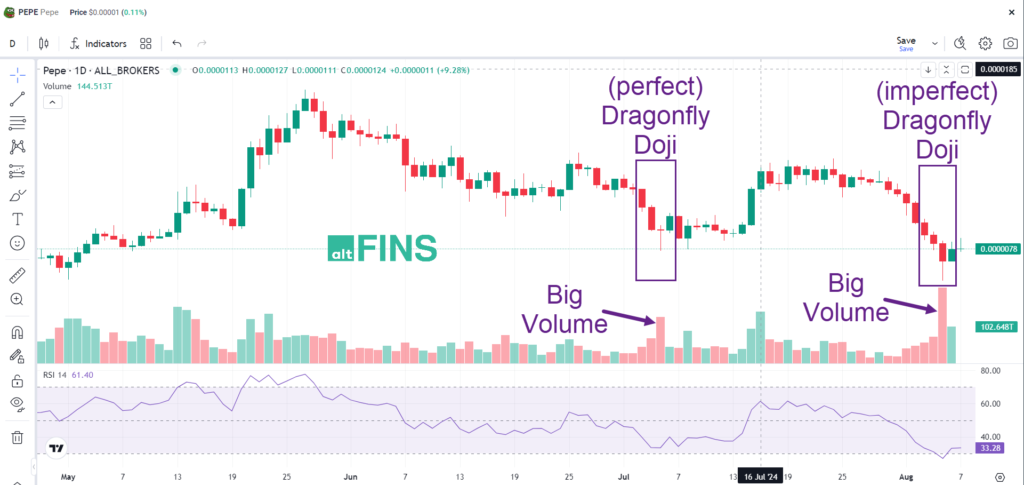
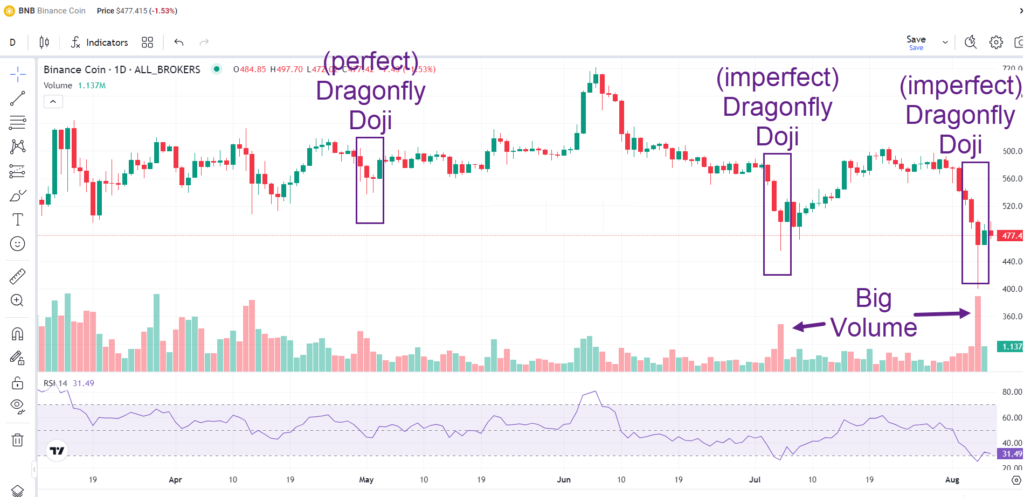
Examples of Dragonfly Doji Candlestick Patterns
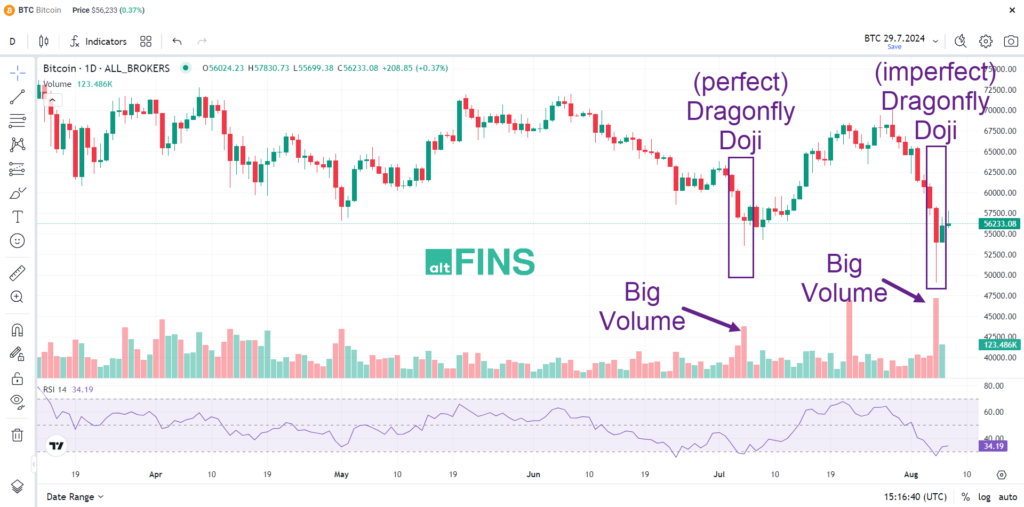
Confluence Is King: 4 Filters That Boost Reliability
A Dragonfly Doji in isolation is a weak signal. Combined with other technical factors, it becomes a high-probability setup. Look for these 4 confluences:
| Confluence | Why It Matters |
|---|---|
| Key support level | Historical price floor where buyers have defended before. |
| Oversold RSI (< 30) | Confirms momentum has been stretched to the downside. |
| Major moving average | 200-day SMA or 50-day EMA often acts as dynamic support. |
| Above-average volume | High volume = real buying interest, not a thin-market blip. |
Dragonfly Doji vs. Similar Candlestick Patterns
Traders often confuse the Dragonfly Doji with related single-candle patterns. Here’s how to tell them apart:
| Pattern | Shape | Signal |
|---|---|---|
| Dragonfly Doji | T-shape (long lower wick, no upper) | Bullish reversal |
| Gravestone Doji | Inverted T (long upper wick, no lower) | Bearish reversal |
| Long-legged Doji | Cross (long upper AND lower wicks) | Indecision / pause |
| Hammer | Small body at top, long lower wick | Bullish reversal |
How to Trade the Dragonfly Doji: Step-by-Step
- Identify a downtrend: at least 2–3 consecutive red candles, ideally near a known support level.
- Spot the Dragonfly Doji: T-shape with open = high = close and a long lower wick.
- Check confluence: Is RSI oversold? Is price at a major moving average? Is volume above average?
- Wait for confirmation: do NOT enter on the Doji itself. Wait for the next candle to close green.
- Enter the trade: open a long position at the close of the confirmation candle (or the open of the following one).
- Place stop-loss: just below the low of the Dragonfly’s lower wick.
- Set a target: nearest resistance, a risk/reward ratio of 1:2 or better, or use a trailing stop.
Risk Management: Protecting Your Capital
Even the best pattern fails sometimes. Sound risk management turns Dragonfly Doji trading from a gamble into a strategy:
- Stop-loss placement: always just below the low of the Dragonfly’s wick. If price breaks that level, the signal has failed.
- Position sizing: risk no more than 1–2% of your portfolio per trade.
- Dynamic stop adjustment: once price moves in your favor, move the stop to break-even or trail it to lock in profits.
- Avoid bear markets: in an overwhelmingly negative macro environment, individual patterns fail more often — wait for cleaner conditions.
Important: The Dragonfly Doji is a signal, not a guarantee. A successful reversal often has bumps and retracements before the real move begins. Patience and confirmation matter more than perfect entries.
Find Dragonfly Doji Patterns Automatically with altFINS
Scanning 3,000+ altcoins manually for Dragonfly Dojis is impossible. The altFINS Crypto Screener does it for you, analyzing 120 indicators across 5 time frames.
Option 1: Pre-set Filter (fastest)
In the altFINS Screener, go to Pre-set Filters → Candlestick Patterns → 1 Candlestick → Dragonfly Doji Candlestick Pattern to instantly see every coin currently printing the pattern.
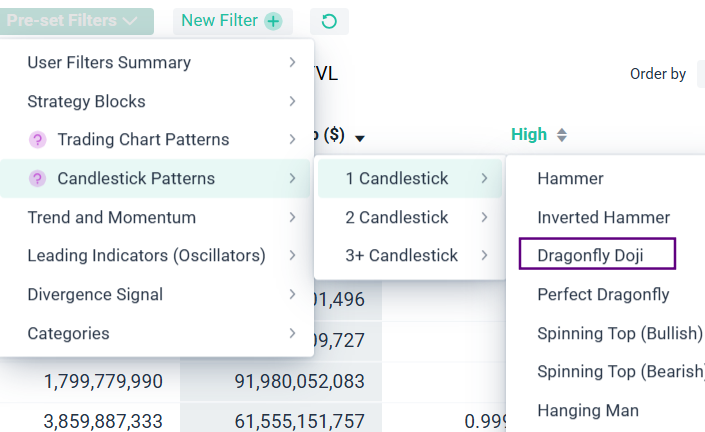
Option 2: Custom Filter (flexible)
Crypto Screener → Click New Filter → Candlestick Patterns → 1 Candlestick → Dragonfly Doji, then select your preferred time interval (1H, 4H, Daily, Weekly). You can stack additional conditions like “RSI < 30” or “price above 200-day SMA” for maximum confluence.

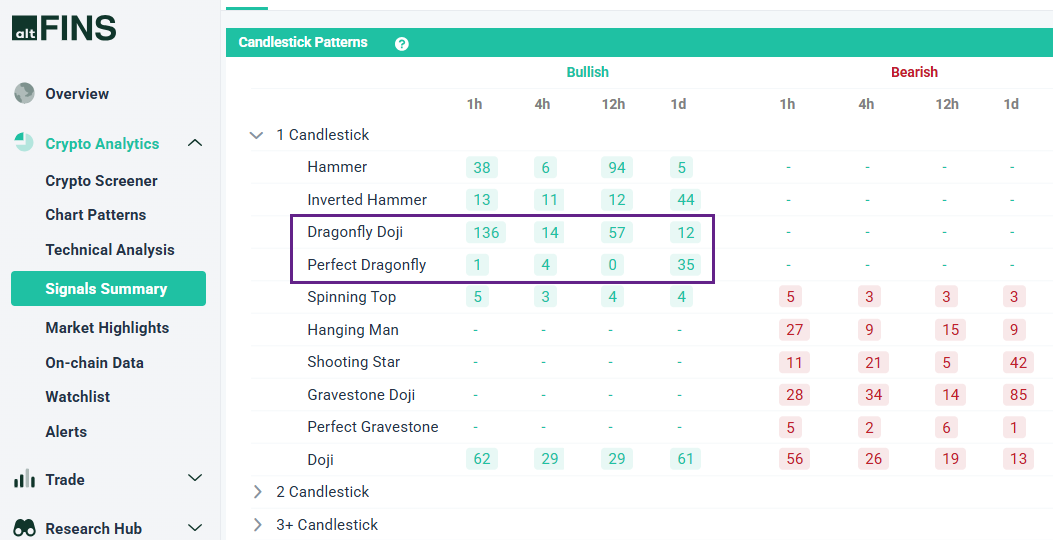
Option 3: Signals Summary
Use the altFINS Signals Summary to get a consolidated view of all bullish and bearish candlestick signals across your watchlist — a great way to confirm Dragonfly Dojis align with broader momentum.
Common Mistakes to Avoid
- Trading without confirmation: the next green candle is non-negotiable — without it, you’re guessing.
- Ignoring context: a Dragonfly Doji in a sideways chop means little. It must follow a real downtrend.
- Skipping the volume check: low-volume Dojis often fail because there aren’t enough buyers to sustain the reversal.
- No stop-loss: never enter a Doji trade without defining your risk first.
- Using it alone: single-candle patterns work best as part of a multi-indicator strategy.
Key Takeaways
- The Dragonfly Doji is a T-shaped bullish reversal candlestick pattern.
- It forms when open = high = close with a long lower wick.
- The “Perfect” setup = 2+ red candles → Dragonfly → green confirmation.
- Confluence (support, RSI oversold, moving averages, volume) dramatically improves reliability.
- Always wait for the confirmation candle before entering.
- Place stop-loss just below the Doji’s low.
- Use the altFINS Screener to scan thousands of coins for this pattern in seconds.
Frequently Asked Questions (FAQ)
Is the Dragonfly Doji bullish or bearish?
The Dragonfly Doji is a bullish reversal pattern when it appears at the bottom of a downtrend. Its long lower wick reflects strong buying pressure rejecting lower prices.
How reliable is the Dragonfly Doji pattern?
Reliability increases significantly with confluence. A Dragonfly Doji at a key support level, with oversold RSI and above-average volume, followed by a green confirmation candle, has a much higher success rate than the pattern in isolation.
What is the difference between a Dragonfly Doji and a Hammer?
Both are bullish reversal patterns with long lower wicks. The Dragonfly Doji has no real body (open = close), while the Hammer has a small real body at the top of the candle. The Dragonfly represents more perfect indecisio
Read also an article:
- Mastering Candlestick Patterns for Successful Crypto Trading
- Essential Candlestick Patterns for Crypto Traders
- The Hammer Candlestick Pattern
- The Inverted Hammer Candlestick Pattern
- The Hammer Candlestick Pattern
- The Gravestone and Perfect Gravestone Doji Candlestick Patterns
- Bullish Engulfing Candlestick Pattern
- The Spinning Top Candlestick Pattern
- The Hanging Man Candlestick Pattern
What is Candlestick Pattern (source: Investopedia)
