Search Knowledge Base by Keyword
The Hammer Candlestick Pattern
TL;DR: The Hammer Pattern
The Hammer is a powerful bullish reversal candlestick that appears at the bottom of a downtrend. It features a small body at the top and a long lower shadow (at least twice the body’s length), signaling that while sellers tried to push prices lower, buyers successfully drove them back up before the close.
-
Market Meaning: It signals that the downtrend is losing steam and buyers are beginning to take control.
-
Trading with altFINS: You can instantly scan 3,000+ altcoins for this pattern using the altFINS Crypto Screener. Use Pre-set Filters for a quick search or Custom Filters to find Hammers at key support levels or oversold RSI zones.
-
Execution Strategy:
-
Confirmation: Wait for the next candle to close above the Hammer’s body.
-
Entry: Enter a long position once the high of the Hammer is broken.
-
Stop-Loss: Place it just below the tip of the Hammer’s lower shadow.
-
Detailed Characteristics of the Hammer Pattern
The Hammer candlestick pattern is considered a bullish reversal signal. It typically appears at the bottom of a downtrend and suggests that despite selling pressure during the trading session, buyers were able to push the prices back up close to the opening level, indicating potential strength returning to the market. This setup hints at a possible reversal from bearish to bullish sentiment if confirmed by subsequent trading activity.
The Hammer candlestick pattern is a pivotal tool in technical analysis, serving as a beacon for potential market reversals. Recognized by its unique structure, it provides critical insights into price dynamics. This comprehensive guide delves deeper into the Hammer pattern, offering advanced tips and tricks for utilizing it in various trading scenarios.
Variations of the Candlestick Pattern – Hammer
- Inverted Hammer: Similar to the Hammer, the Inverted Hammer appears at the bottom of downtrends and has a small body with a long upper shadow. While both suggest bullish reversals, the Inverted Hammer needs bullish confirmation on the following days.
- Dragonfly Doji: This is a variant where the open and close are at the highest of the day, indicating a strong buying pressure after a downtrend.
Understanding these variations can help traders discern which signals might lead to stronger bullish reversals.
Hammer Candlestick Patterns on altFINS
altFINS crypto screener allows traders to create custom filters based on Candlestick patterns. These patterns include 1-Candle Patterns, 2-Candle Patterns, and patterns involving 3 or more candles.
To access Candlestick patterns on altFINS, go to:
Crypto Screener – Preset Filters
altFINS provides a leading cryptocurrency screening tool capable of analyzing over 3,000 altcoins using 120 different indicators across five time frames. It includes Pre-set Filters, which are predefined and optimized strategies and patterns designed for quick access to the most popular filters, such as the Hammer Candlesticks pattern.
Crypto Screener Pre-set Filters
Select Pre-set Filters – Candlestick Patterns – 1 Candlestick – Hammer and you will get the results:
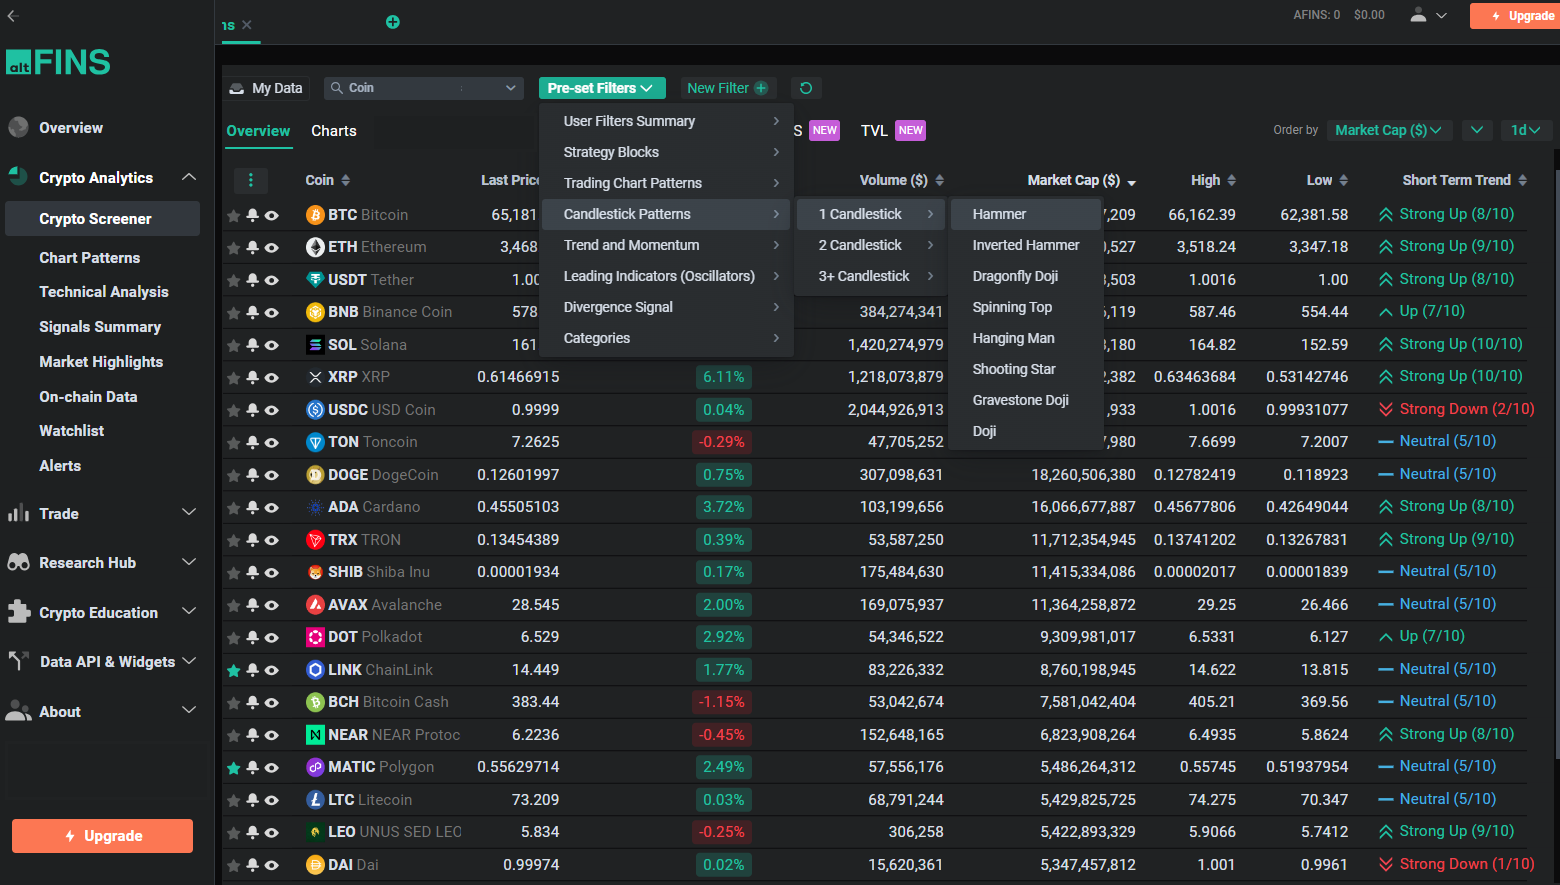
Source: altFINS
Screener Results
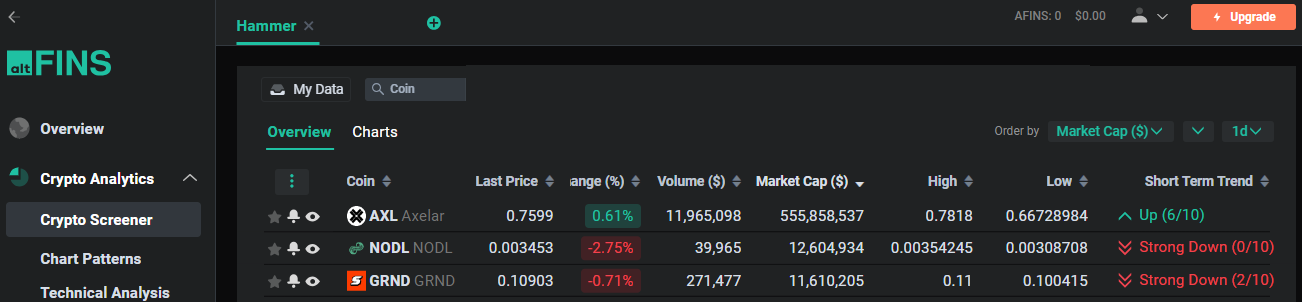
Source: altFINS
Examples: Hammer Candlestick Pattern in Charts
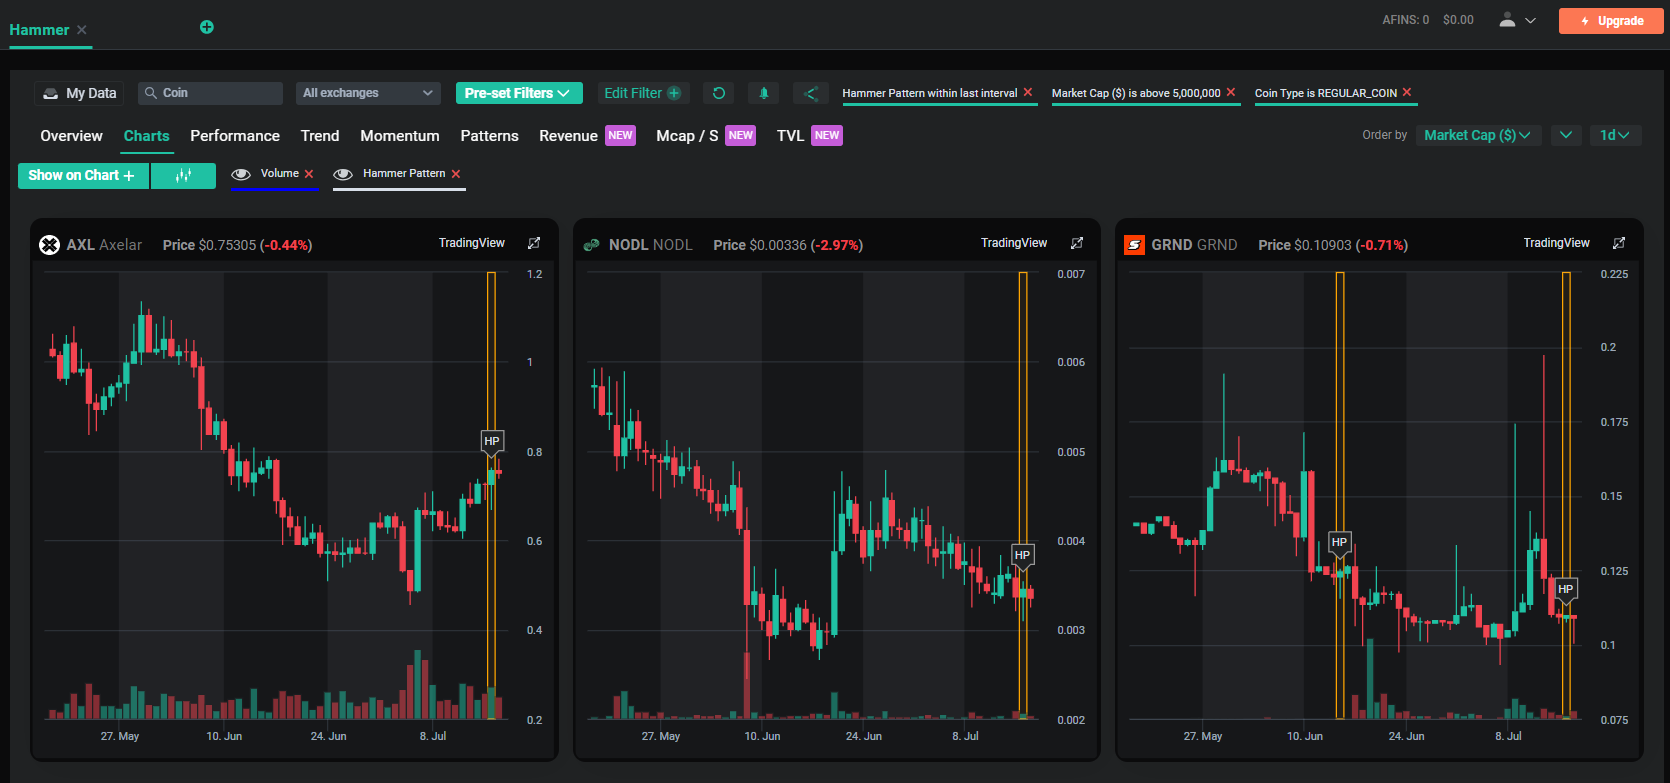
Source: altFINS
Crypto Screener Custom Filters
Select New Filter- Candlestick Patterns – 1 Candlestick – Hammer and select interval.
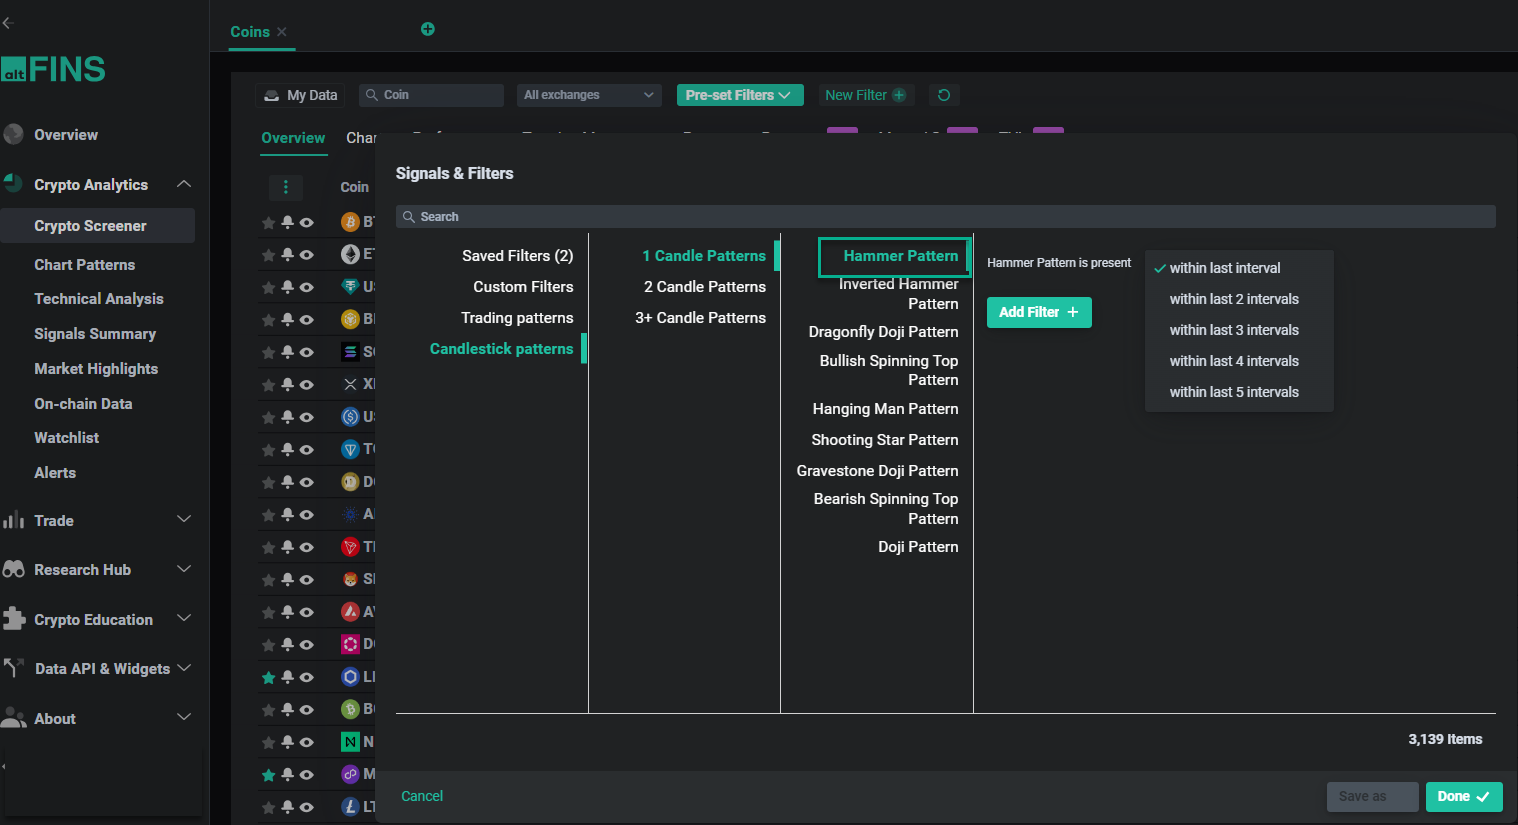
Source: altFINS
Signals Summary Custom Filters
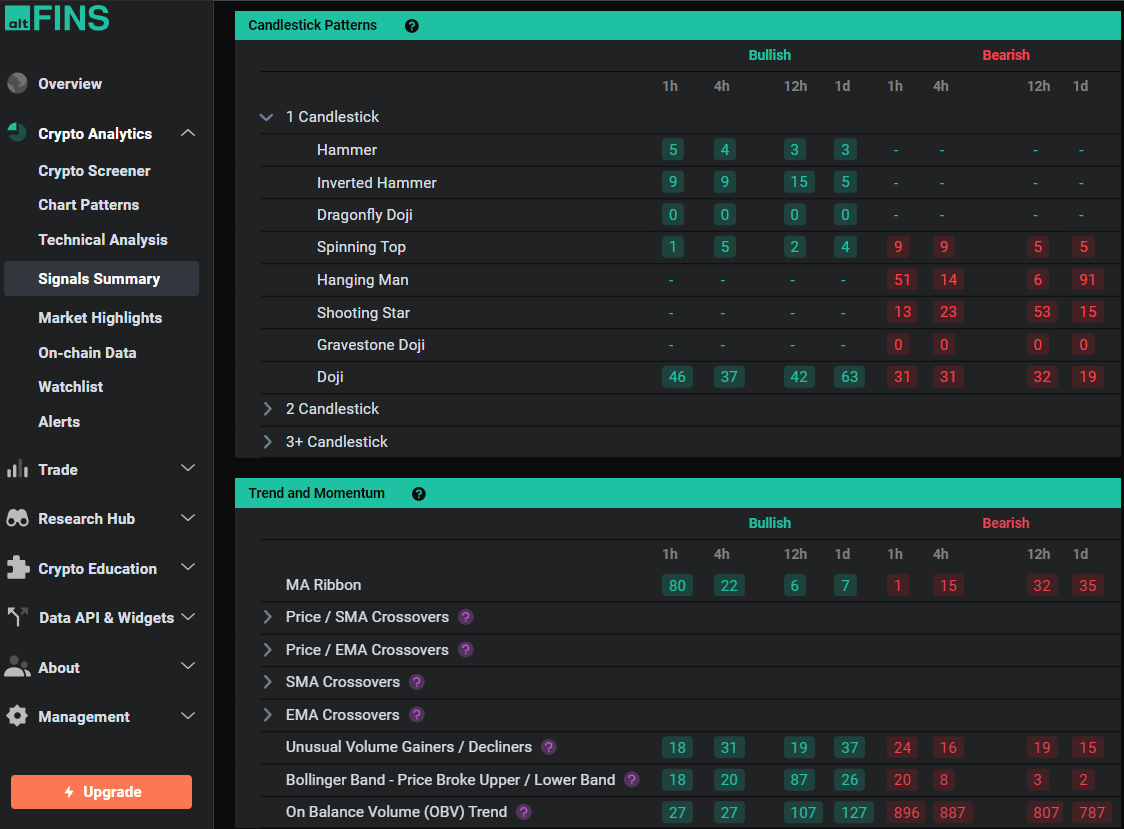
Source: altFINS
Advanced Trading Strategies
1. Combining with Support Levels
Integrating the Hammer pattern with known support levels can significantly increase the reliability of the potential reversal. If a Hammer forms at a key support level, this confluence enhances the bullish signal.
2. Using with Trend Lines
A Hammer pattern that appears near a declining trend line can signal a potential breakout. Traders should look for a closing price above the trend line following the Hammer to confirm a change in trend direction.
Tips and Tricks for Effective Use
Wait for Confirmation
One common mistake is acting too hastily on the Hammer signal. Waiting for confirmation, such as a subsequent bullish candlestick or higher closing prices over the next few trading sessions, can filter out false positives.
Check the Historical Context
Look back at how the asset has reacted to Hammer patterns in the past. Some assets may show a stronger tendency to follow through on Hammer signals, while others may not, offering insights tailored to specific market behaviors.
Monitor Market Sentiment
Be aware of overall market sentiment and economic indicators. A bullish Hammer signal during broadly negative market conditions may be less reliable.
Use Technical Indicators for Confirmation
- Stochastic Oscillator: Useful for identifying overbought or oversold conditions. A Hammer pattern coupled with an oversold reading on the Stochastic can be a strong buy signal. You can find Stochastic Oscillators on altFINS Crypto Screener.
- Fibonacci Retracement Levels: A Hammer forming near a key Fibonacci level, especially the 61.8% retracement, provides additional support to the bullish reversal signal.
Psychological Insights
Understanding the psychology behind the Hammer pattern can give traders an edge. The pattern represents a period where bears initially had control but lost it to the bulls by the session’s close, suggesting a weakening bearish trend.
Risk Management
Implementing effective risk management strategies is crucial when trading with Hammer patterns:
- Proper Position Sizing: Adjust your position size based on the volatility of the asset and the distance to your stop-loss level.
- Dynamic Stop-Loss Adjustment: As the trade moves in your favor, consider moving the stop-loss to breakeven or using a trailing stop-loss to lock in profits.
Learn more about Risk management in the Lesson 9 in Crypto Trading Course.
Practical Examples
Using historical chart data to illustrate successful and unsuccessful Hammer trades can provide practical insights. Analyzing these scenarios helps traders recognize optimal conditions and potential pitfalls.
Conclusion
The Hammer candlestick pattern is a versatile and powerful tool in technical analysis. By applying these advanced strategies, tips, and tricks, traders can enhance their ability to spot potential reversals and make more informed trading decisions. Combining this pattern with a solid understanding of market context, technical indicators, and sound risk management will lead to a robust trading approach.
Learn more about candlestick patterns in this article!
Read also an article:
Mastering Candlestick Patterns for Successful Crypto Trading
Essential Candlestick Patterns for Crypto Traders
The Dragonfly Doji Candlestick Pattern
The Inverted Hammer Candlestick Pattern
The Gravestone and Perfect Gravestone Doji Candlestick Patterns
Bullish Engulfing Candlestick Pattern
The Spinning Top Candlestick Pattern
The Hanging Man Candlestick Pattern
What is Candlestick Pattern (source: Investopedia)
