Search Knowledge Base by Keyword
How To Trade Sideways Channel pattern? | Crypto Chart Pattern
Update Novembers 2024: In crypto trading, a sideways channel pattern represents a period of consolidation where the price of a cryptocurrency moves within a horizontal range, forming clear support and resistance levels. Traders often refer to this pattern as a “sideways market,” “range-bound market,” or “horizontal channel.”
Sideways Channel Trade Setup
Sideways Channel is one of the easiest patterns to identify and trade for beginner traders.
In this trading video, Richard (CEO of altFINS) explains the Sideways Channel patterns using ETH, BCH, TRX, CHZ and RPL as example trade setups.
The video provides a step-by-step guide on how to trade Sideways Channel including:
1. How to find Sideways Channel trade setups
2. How to trade Emerging and Completed (breakout) patterns
3. Where to set Stop Loss (SL) levels (critical!!)
4. How to use Risk-Reward-Ratio for risk management
5. How to use Alerts for breakouts and swing trade entry
6. How to identify Uptrend on altFINS platform
Trading Tutorial
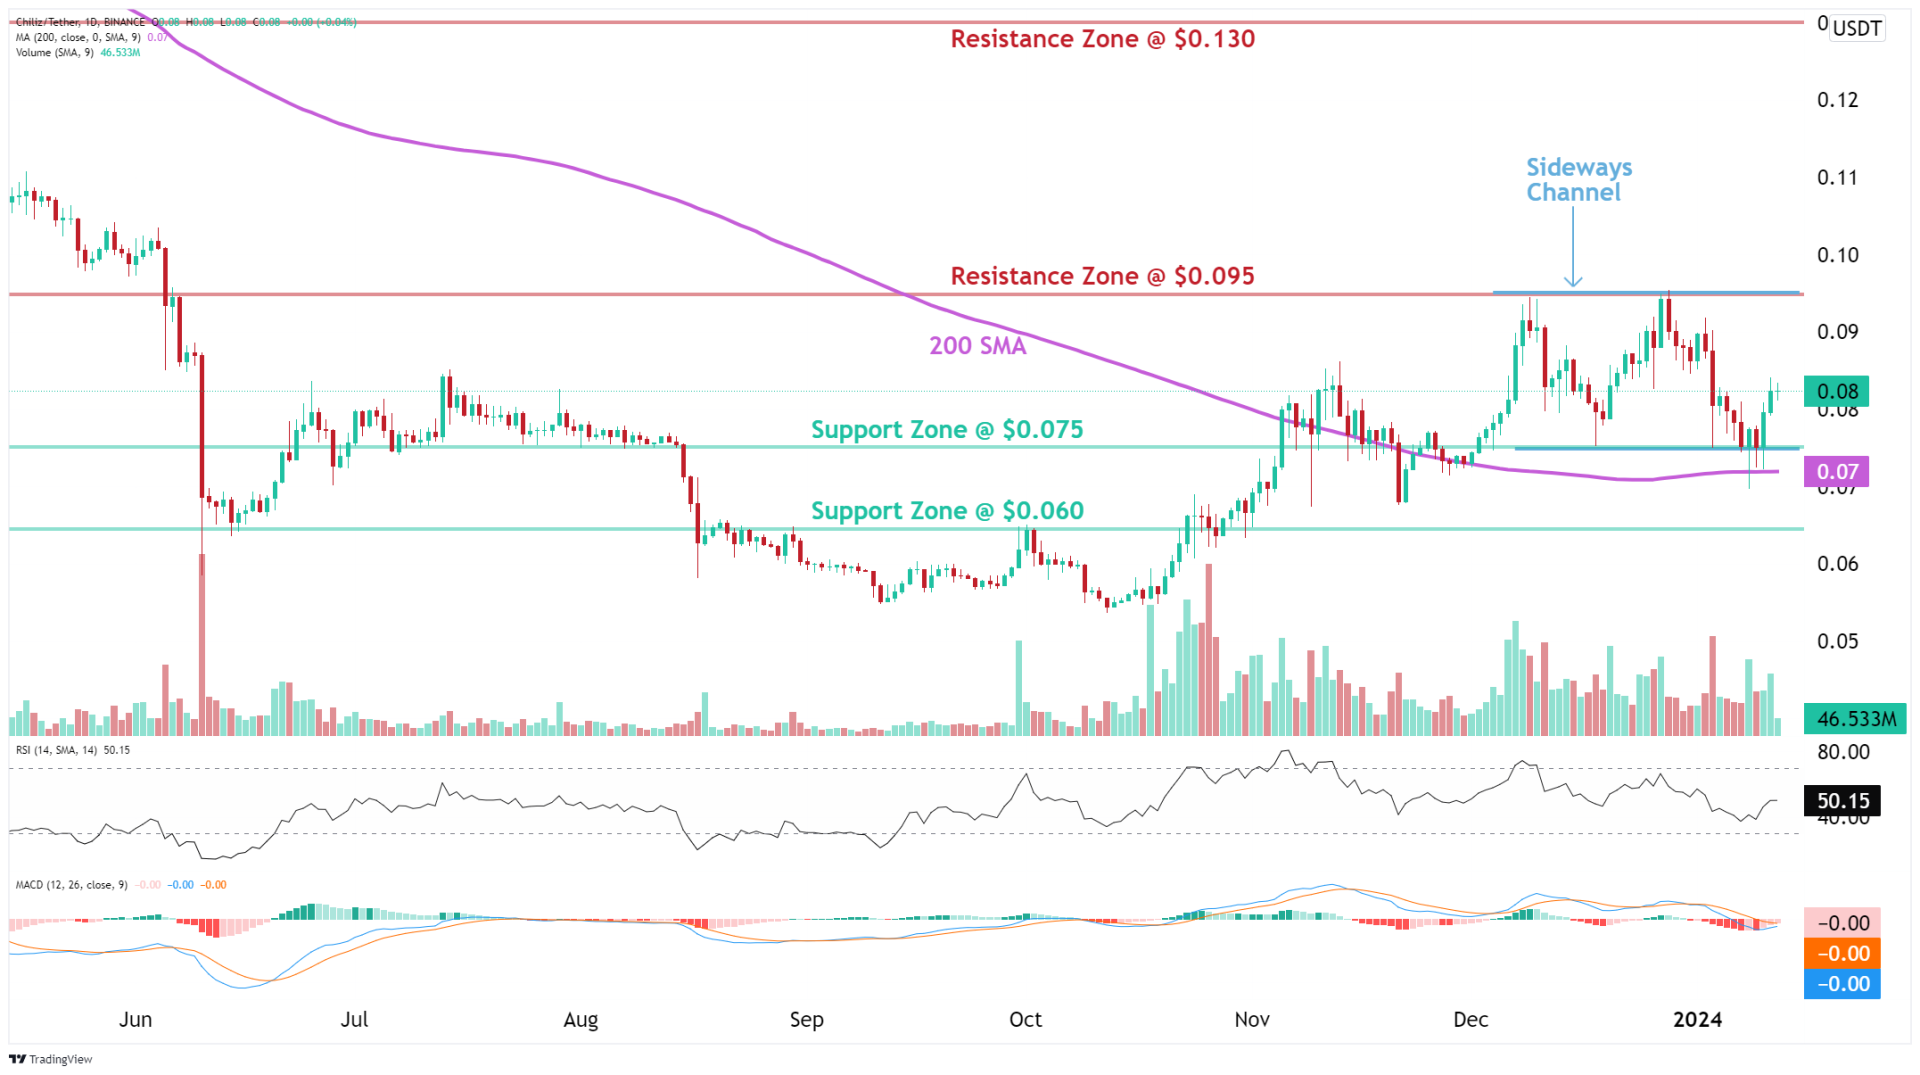
Let’s use Chiliz as an example. While the pattern is emerging, meaning before a breakout, swing traders can trade between the support and resistance areas. Enter near $0.075 support and exit near $0.095 resistance.
Sideways Channel – Emerging (CHZ example)
Once a breakout happens, in either direction, traders can take a position.
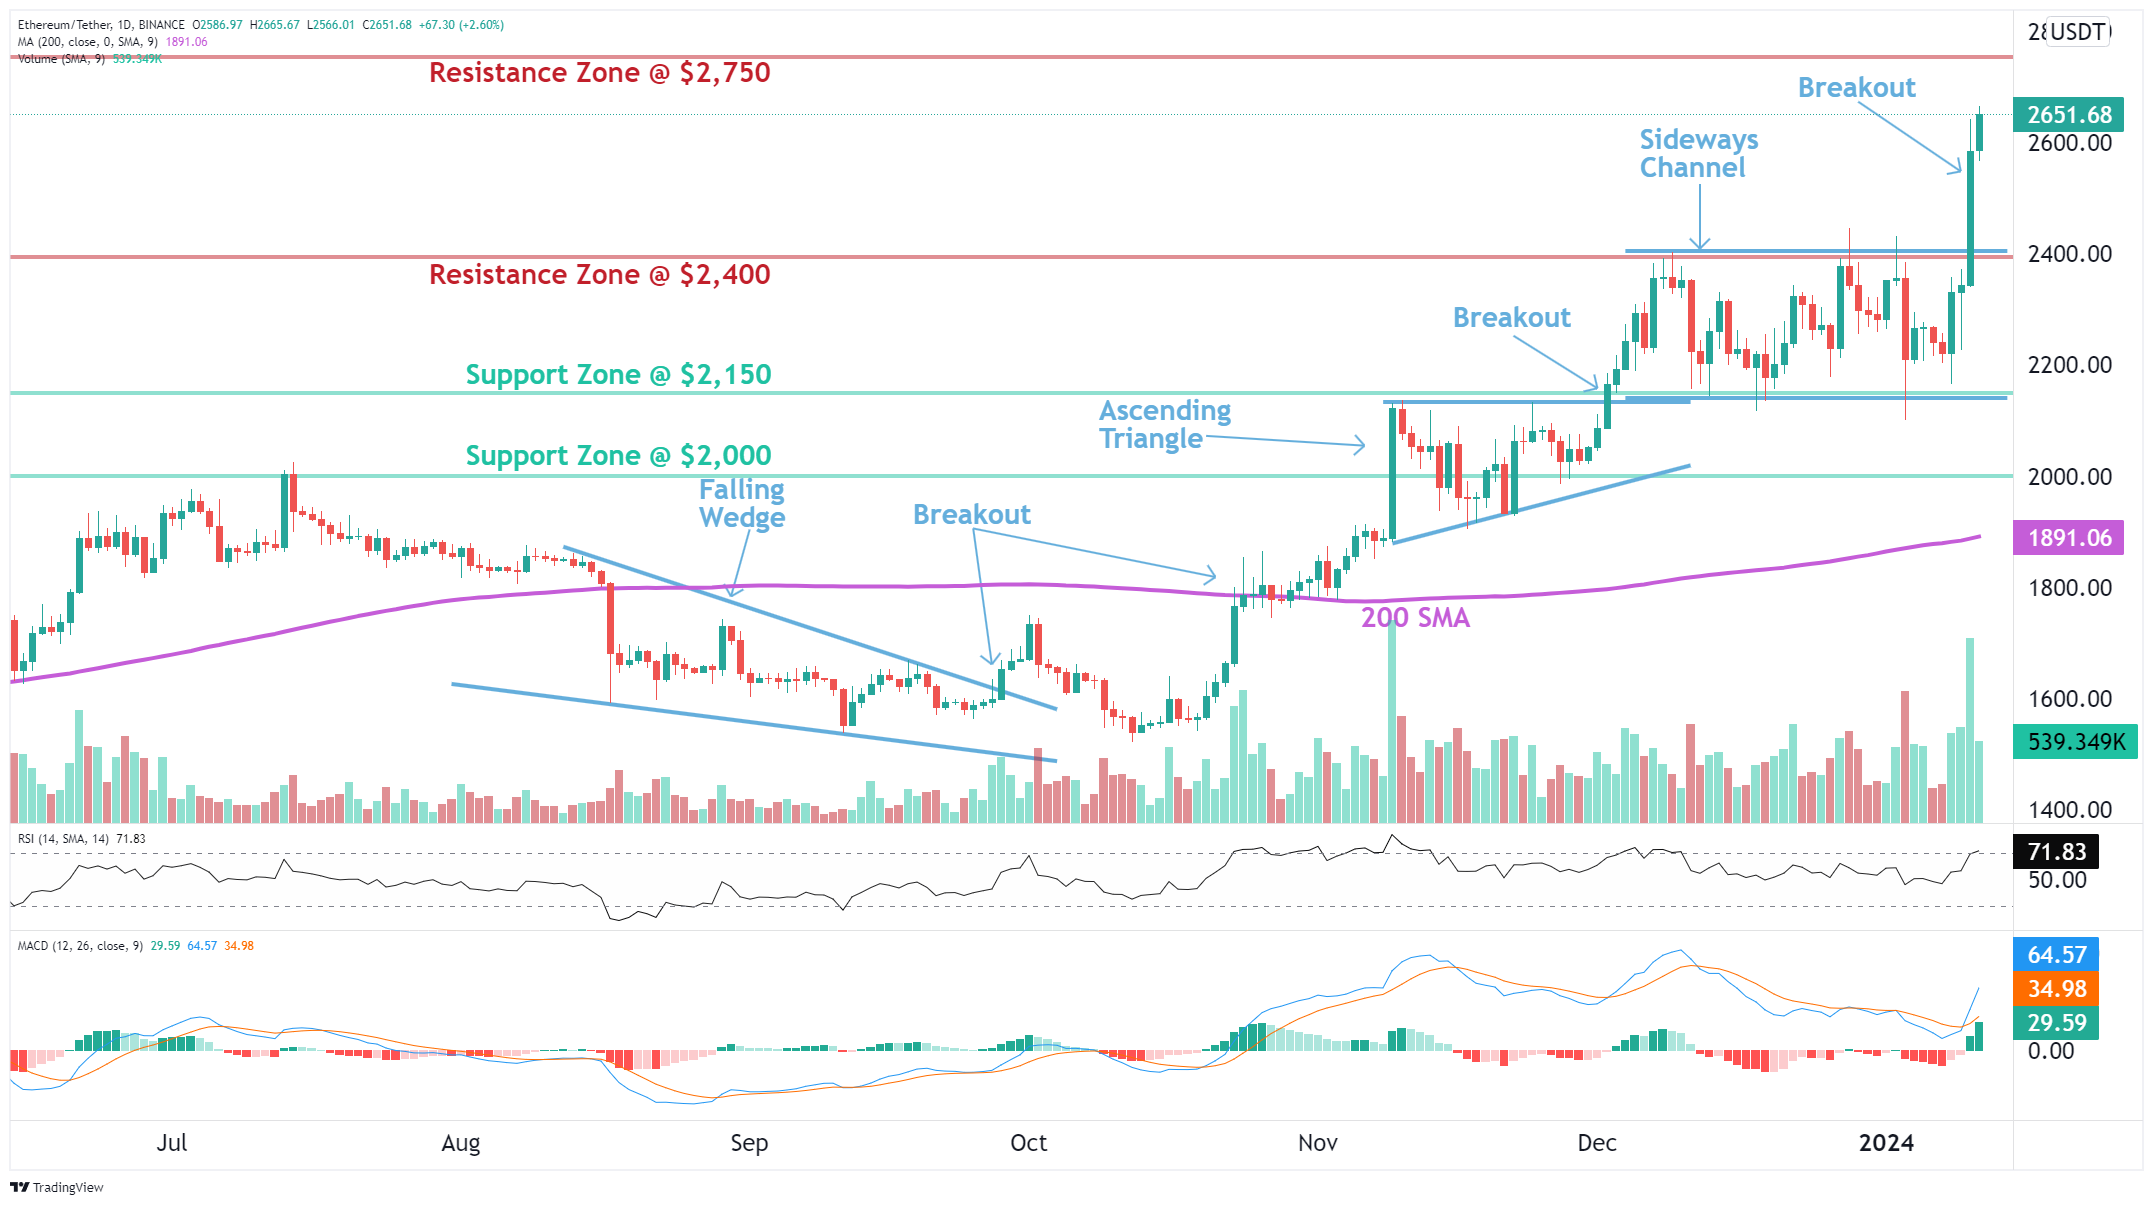
Let’s take a look at Ethereum.
If the asset is trading in an Uptrend, as is the case for Bitcoin Cash, Rocket Pool and Ethereum, then the price is likely just consolidating for a period of time and is likely to break above the channel resistance and continue its uptrend.
Sideways Channel – Breakout (ETH example)
Learn how to trade Chart Patterns and Sideways Channel in the Lesson 6 in Crypto Trading Course!
Characteristics of an Sideways Channel
Here are the key features:
- Horizontal Range: Prices move within a relatively flat or horizontal range on the price chart. The highs and lows are roughly equal, forming a channel-like structure.
- Support and Resistance Levels: Well-defined support and resistance levels mark the upper and lower boundaries of the channel. Support is where buying interest typically emerges, preventing the price from falling further. Resistance is where selling interest tends to surface, preventing the price from rising.
- Consolidation Phase: The market experiences a consolidation or ranging phase, indicating a lack of a clear trend. This phase is characterized by sideways movement as the market digests previous price movements.
- Price Oscillations: Traders can observe regular price oscillations within the established channel. This creates trading opportunities for those looking to buy near support and sell near resistance.
- Volume Analysis: During the consolidation phase, trading volume often decreases. A breakout or breakdown accompanied by increased volume may signal a potential trend reversal.
- Breakout Potential: Traders closely monitor for potential breakouts or breakdowns from the established channel. A breakout above resistance or below support can indicate the beginning of a new trend.
- False Breakouts: Sideways channels may experience false breakouts, where prices briefly move beyond support or resistance but fail to sustain the momentum.
- Technical Indicators: Traders use technical indicators like moving averages, RSI, MACD, or Bollinger Bands to confirm the strength of the sideways channel. Convergence or divergence signals from these indicators may provide additional insights.
- Time Frame Considerations: Sideways channels can appear on various time frames, from short-term intraday charts to longer-term daily or weekly charts. Traders may adjust their strategies based on the time frame they are analyzing.
How to Trade Sideways Channel Crypto Chart Patterns?
Trading sideways channel crypto chart patterns involves identifying potential buy and sell opportunities within the established horizontal range. Here’s a step-by-step guide on how to trade sideways channels in the cryptocurrency market:
- Identify the Sideways Channel:
- Look for a clear horizontal range with roughly equal highs and lows.
- Draw trendlines connecting the highs and lows to establish the channel.
- Confirm Support and Resistance Levels:
- Identify the support level (bottom of the channel) and the resistance level (top of the channel).
- Confirm that these levels have been tested and respected multiple times.
- Wait for Price to Approach Support or Resistance:
- Consider buying when the price approaches the support level.
- Consider selling when the price approaches the resistance level.
How To Identify Sideways Channel Pattern on altFINS?
-
Technical Analysis section
altFINS’ analysts conduct technical analysis of top 60 coins. The technical analysis is simple and consistent. It follows the key concepts of Technical Analysis (TA): 1) Trend 2) Momentum 3) Volume 4) Chart Patterns 5) Support and Resistance.
Our Technical Analysis section includes trade setups for 60+ major altcoins with Take Profit and Stop Loss levels.
Our team of analysts maitain TAs with trade set ups on 60 large cap altcoins (see here) that can provide a great starting point for discovering trading ideas as well as learning TA yourself!

Go to Technical Analysis Section
-
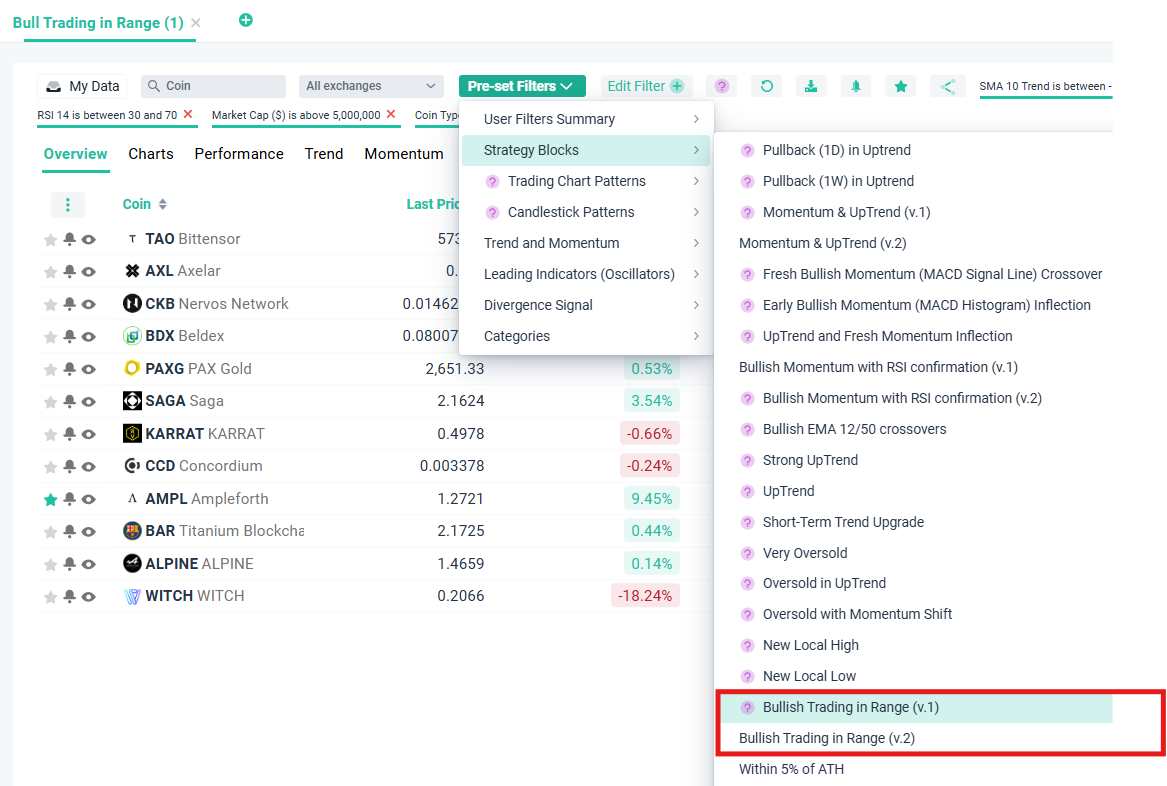
Crypto Screener: Pre-set Filters – Strategy Blocks
More tips:
