Search Knowledge Base by Keyword
-
Overview
-
- altFINS Platform Features - Your All-in-One Crypto Trading Tool
- Why use altFINS?
- Registered user benefits
- What kind of trader are you?
- How to trade cryptocurrencies?
- How to Trend Trade Crypto
- Trading Risk Management
- What Makes altFINS One of the Best Crypto Screeners in 2025?
- What Kind Of Crypto Trading Signals Are on altFINS?
-
-
Crypto Analytics
-
- Why use it?
- Overview > Charts > Scorecards > Performance > Trend > Oscillators
- Add table columns
- Detail view
- Charts
- Create a Trading Signal or Filter
- Find SMA crossover signals
- Crypto Time Intervals
- Create an alert
- Extreme Overbought coins Due for a Pullback
- Early momentum detection
- Crypto Trend Changes
- Why And How Use altFINS Crypto Screener
- Mastering Candlestick Patterns for Successful Crypto Trading
- Fibonacci Retracement Levels: The Complete Crypto Trading Guide (2026)
- Essential Candlestick Patterns for Crypto Traders
- Using Local High to Spot Breakouts
- Oversold in Uptrend
- Strong Uptrend
- The Hammer Candlestick Pattern
- The Inverted Hammer Candlestick Pattern
- The Hanging Man Candlestick Pattern
- The Spinning Top Candlestick Pattern
- The Dragonfly Doji Candlestick Pattern: Complete Trading Guide (2026)
- What is "My Data" Option on altFINS?
- The Relative Volume (RVOL) Indicator
- New Local High
- New Local Low
- Buying Coins at an All-Time-High (ATH)
- Bullish Engulfing Candlestick Pattern: A Comprehensive Guide
- The Gravestone and Perfect Gravestone Doji Candlestick Patterns
- Support and Resistance Crypto: The Complete 2026 Guide for Traders
- What Makes altFINS One of the Best Crypto Screeners in 2025?
- Crypto Volume Tracker: Spot Unusual Volume and Momentum with altFINS
- Crypto Fundamental Data On altFINS: Identifying Projects with Real Traction
- What is ATR Indicator and How to Find It on altFINS?
- Combining fundamentals with TA
- Trading RSI and RSI Divergence
- What Is the 200-Day Simple Moving Average and How to Find It on altFINS
- 11 Best Crypto Screeners in 2026: Comparison, Pricing & Features
- The Complete Guide to altFINS Preset Screener Filters
- altFINS AI Trade Setup: Analyze 2,000 Coins in Seconds
- Show all articles ( 27 ) Collapse Articles
-
- Overview
- Emerging v. Complete
- Mastering Key Levels in Crypto Trading: The Ultimate Guide
- Consecutive Candles
- Big Movement in Trading: Understanding and Trading the Volatility
- Fibonacci Patterns
- 10 steps for how to trade crypto using Crypto Chart Patterns
- How to trade Channel Down? | Crypto Chart Pattern
- Tutorial: Using Custom Chart Pattern Filters
- How To Set Up Chart Patterns Alerts?
- How To Trade Channel Up Pattern? | Crypto Chart Pattern
- How To Trade Ascending Triangles? | Crypto Chart Pattern
- How To Trade Bullish Flag Pattern? | Crypto Chart Pattern
- How To Trade Sideways Channel pattern? | Crypto Chart Pattern
- How To Trade Rising Wedge pattern? | Crypto Chart Pattern
- How To Trade Falling Wedge pattern? | Crypto Chart Pattern
- How To Trade Descending Triangle pattern? | Crypto Chart Pattern
- How To Trade Inverse Head and Shoulders pattern? | Crypto Chart Pattern
- What is "My Data" Option on altFINS?
- How To Trade Symmetrical Triangle Pattern? | Crypto Chart Pattern
- Crypto Chart Patterns Cheat Sheet
- How Does AI Help with Crypto Trading?
- Crypto Chart Patterns: The Complete 2026 Guide to 26 AI-Detected Patterns
- Best Automated Crypto Chart Pattern Recognition Platforms in 2026: The Ultimate Comparison
- Show all articles ( 9 ) Collapse Articles
-
- Technical Analysis - Trade Setups
- Fibonacci Retracement Levels: The Complete Crypto Trading Guide (2026)
- How To Trade Sideways Channel pattern? | Crypto Chart Pattern
- Technical Analysis Alerts
- Support and Resistance Crypto: The Complete 2026 Guide for Traders
- 8 AI-Powered Trade Strategy Prompts Using altFINS MCP
-
- Signals Summary Overview
- How To Find And Trade Crypto Pullbacks In Uptrend (Buying Dips)?
- Momentum & Up / Down Trend
- Range in Up/Down Trend
- Momentum
- How to trade EMA 12 / 50 crossovers?
- Moving Average Ribbons
- Strong Up / Down Trend
- Strong Up / Down Trend (Short Term)
- Strong Up / Down Trend (Medium Term)
- Strong Up / Down Trend (Long Term)
- Price / SMA Crossovers In Crypto
- What are Price / EMA Crossovers in crypto?
- SMA Crossovers
- EMA Crossovers
- Crypto Unusual Volume Gainers / Decliners
- New Up/Down trend (ADX)
- Bollinger Band - Price Broke Upper / Lower Band
- Strong Up / Down Trend and Oversold / Overbought
- Strong Up / Down Trend and Strong / Weak Ultimate Oscillator
- MACD (12,27,9) Signal Line cross
- MACD (12,27,9) Center Line cross
- Commodity Channel Index cross
- Overall Score of Oscillators (Oversold / Overbought)
- Relative Strength Index (9)
- Relative Strength Index (14)
- Relative Strength Index (25)
- Stochastic RSI (3, 3, 14, 14)
- Williams Percent Range (14)
- Bull Power
- MACD line
- Relative Strength Index (RSI) Divergence: Explained
- How to Trend Trade Crypto
- Early momentum detection
- Short-Medium-Long-Term Trend
- Relative Strength Index
- Uptrend and Fresh Bullish Momentum Inflection
- Using Local High to Spot Breakouts
- Oversold in Uptrend
- Strong Uptrend
- The Hammer Candlestick Pattern
- The Inverted Hammer Candlestick Pattern
- The Hanging Man Candlestick Pattern
- The Spinning Top Candlestick Pattern
- The Dragonfly Doji Candlestick Pattern: Complete Trading Guide (2026)
- What is "My Data" Option on altFINS?
- The Relative Volume (RVOL) Indicator
- New Local High
- New Local Low
- Bullish Engulfing Candlestick Pattern: A Comprehensive Guide
- The Gravestone and Perfect Gravestone Doji Candlestick Patterns
- Three White Soldiers Candlestick Pattern: A Comprehensive Guide
- How Does AI Help with Crypto Trading?
- What Kind Of Crypto Trading Signals Are on altFINS?
- Trading RSI and RSI Divergence
- The Complete Guide to altFINS Preset Screener Filters
- Show all articles ( 41 ) Collapse Articles
-
- Volume
- OBV Divergence Indicator
- SMA vs. EMA
- Trading RSI and RSI Divergence
- Stochastic (14, 3, 3) (STOCH)
- What is CCI 20? (Commodity Channel Index 20)
- ADX
- MACD Indicator Explained: MACD Line, Signal Line & Histogram (Complete 2026 Guide)
- Williams %R
- Stochastic RSI Fast
- Bull / Bear Power
- What is the UO: Ultimate Oscillator (7, 14, 28)
- Short Term Trend
- Medium Term Trend
- Long Term Trend
- Oscillator Rating
- Trading Multiple Time Frames
- Support and Resistance Crypto: The Complete 2026 Guide for Traders
- Polarity principle
- Early momentum detection
- Crypto Trend Changes
- MACD Histogram (H1, H2)
- Fibonacci Retracement Levels: The Complete Crypto Trading Guide (2026)
- Using Local High to Spot Breakouts
- Oversold in Uptrend
- Strong Uptrend
- The Relative Volume (RVOL) Indicator
- New Local High
- Buying Coins at an All-Time-High (ATH)
- Crypto Volume Tracker: Spot Unusual Volume and Momentum with altFINS
- What is ATR Indicator and How to Find It on altFINS?
- Combining fundamentals with TA
- What Is the 200-Day Simple Moving Average and How to Find It on altFINS
- The Complete Guide to altFINS Preset Screener Filters
- Show all articles ( 19 ) Collapse Articles
- How To Trade Symmetrical Triangle Pattern? | Crypto Chart Pattern
- New Local High
- New Local Low
- Three White Soldiers Candlestick Pattern: A Comprehensive Guide
- Crypto Volume Tracker: Spot Unusual Volume and Momentum with altFINS
- What is ATR Indicator and How to Find It on altFINS?
- What Is the 200-Day Simple Moving Average and How to Find It on altFINS
- Crypto Breakouts Explained: How to Spot Winning Trades with altFINS
- Getting Started with altFINS! Your Complete Step-by-Step Guide to Crypto Trading Success
- 11 Best Crypto Screeners in 2026: Comparison, Pricing & Features
-
-
Trade Crypto
-
- Initiating a trade
- Market vs. Limit order
- Refreshing tables
- Are derivatives such as futures, options and perpetual swaps supported?
- Does altFINS charge trading fees?
- Balances
- Open Orders
- Transaction History
- Orderbook in Crypto: How to Read It, Spot Liquidity, and Trade Smarter (2026 Guide)
- Connecting to Exchanges on altFINS Terminal
- How to trade cryptocurrencies?
- Trading Risk Management
- Crypto Portfolio Tracker
- Connect To Bitget
- Connect to Coinbase
-
-
Research Hub
-
Crypto Education
-
- Where To Buy And Sell Cryptocurrency?
- When Is The Best Time To Buy And Sell Cryptocurrency?
- Crypto Profits: Full Guide How to Take Profits In Cryptocurrency
- What Is Crypto Copy Trading?
- What Is Leverage Trading Cryptocurrency?
- Crypto Arbitrage Trading: Meaning, Signals And Opportunities
- Crypto Hot Wallet vs. Cold Wallet: What is the Difference
- Crypto Trading Strategies
- Difference Between Crypto Fundamental and Technical Analysis
- Best Decentralized Exchanges in 2026: Complete Ranking by Volume, Fees & Features
- What is a Crypto Prop Trading? A Complete Guide to Crypto Proprietary Trading Firms
- The Best Crypto Prop Trading Firms
- Altrady Review: How To Achieve Optimal Trade Execution
- Crypto AI Agents Explained: Top 10 AI Agent Cryptos by Market Cap to Watch in 2025
- The Ultimate Guide to Smart Money Whales in Crypto
- The Ultimate Guide to Cryptocurrency ETFs in 2025
- How to Control Your Emotions While Trading Crypto (and How altFINS Can Help)
- HyroTrader Review: A Comprehensive Analysis
- Best Crypto Trading Bots in 2025: Coinrule vs Cryptohopper vs 3Commas
- How to Automate Your Crypto Trading with Coinrule
- OneFunded Review: Pros & Cons Revealed
- The Market's X-Ray: Liquidation Heatmaps
- Can Quantum Computers Break Bitcoin? | 2026 Google Research
- CoinEx Exchange Review 2026: Features, Fees, Security & What You Should Know Before Trading
- Hyperliquid ($HYPE) Price: The On-Chain Derivatives Powerhouse Eyeing $50
- Crypto Exchange Comparison 2026: CoinEx vs MEXC vs BYDFi vs Phemex vs Margex
- Best Crypto Prop Trading Firms in 2026: The Ultimate Comparison Guide
- Best Crypto Portfolio Trackers 2026: altFINS, CoinStats & 3 More Compared
- RebelsFunding Review 2026: The No-Time-Limit Prop Firm Built for Patient Traders
- LBank Review 2026: The Complete Guide to Fees, Security, Features & Trust
- Crypto Signals on Telegram in 2026 – Complete Guide With altFINS Examples
- MiCA 2026: The July 1 Deadline Every EU Crypto Firm Must Prepare For
- Show all articles ( 17 ) Collapse Articles
-
-
About
-
AI Features
-
altFINS API
- What Is the altFINS Analytics Data API?
- Who Is the altFINS Data API For?
- Real-World Use Cases of the altFINS API
- altFINS Crypto Market & Analytical Data API
- How to Create an altFINS API Key (Step-by-Step Guide)
- The Ultimate Guide to Cryptocurrency MCP Servers in 2026: Complete Comparison for Traders, Developers & Trading Platforms
- 11 Best Crypto APIs for 2026: Comparison, Pricing & Features
- How to Connect altFINS MCP to Claude Desktop
- 8 AI-Powered Trade Strategy Prompts Using altFINS MCP
- altFINS CLI: The Complete Guide To Crypto CLI
- Find Trade Ideas | Prompts Using altFINS MCP And AI
- How to Use altFINS AI Skills with OpenAI Codex
- The Complete Guide to altFINS MCP Crypto Trading Prompts
- The Trinity Moment: When a Local AI Model, altFINS CLI, and an M1 Max Started Working Like One Tool
- altFINS Preset Filters + MCP: Find Crypto Trade Opportunities in Plain English
- What Is a Crypto API & How to Use One: 2026 Tutorial
- How to Connect altFINS MCP to Perplexity PRO
- Show all articles ( 2 ) Collapse Articles
Uptrend and Fresh Bullish Momentum Inflection
Watch a tutorial video: Explanation of a trade setup that we call Uptrend and Fresh Bullish Momentum.
TL;DR:
-
-
The Strategy: It combines trend following (trading with the overall direction) with momentum inflection (timing the entry when a price dip starts to reverse upward).
-
-
Key Indicators:
-
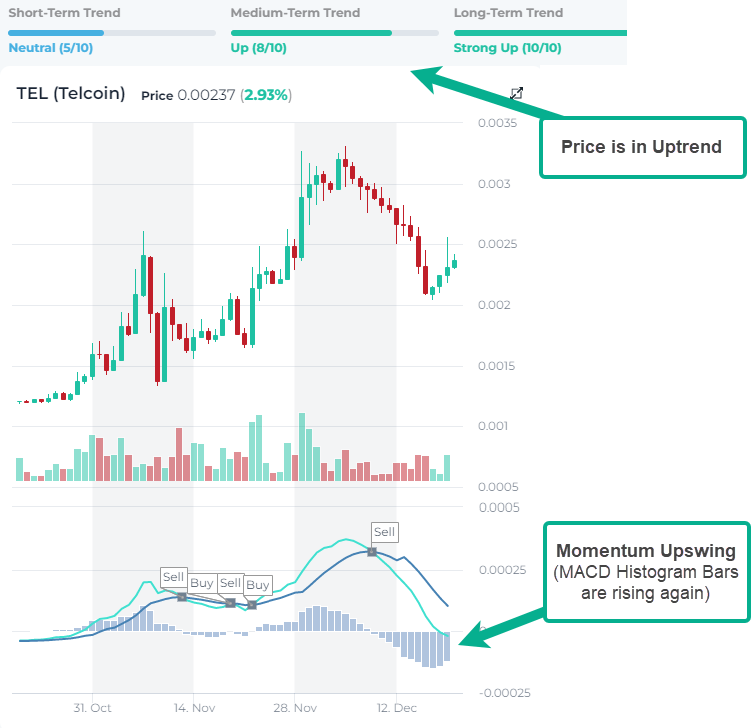
MACD Histogram: The primary signal. When the bars stop declining and start rising (even if still below zero), it indicates a “bullish momentum inflection.”
-
Trend Ratings: Uses altFINS’ proprietary ratings to ensure the asset is in a confirmed uptrend across short, medium, and long-term timeframes.
-
RSI & Volume: Often used as secondary confirmation to ensure there is enough buyer conviction and that the asset isn’t dangerously overbought.
-
-
The Goal: To “buy the dip” in a healthy uptrend. By waiting for a momentum shift (MACD rising), traders avoid “catching a falling knife” and instead enter when buyers have officially begun absorbing supply.
-
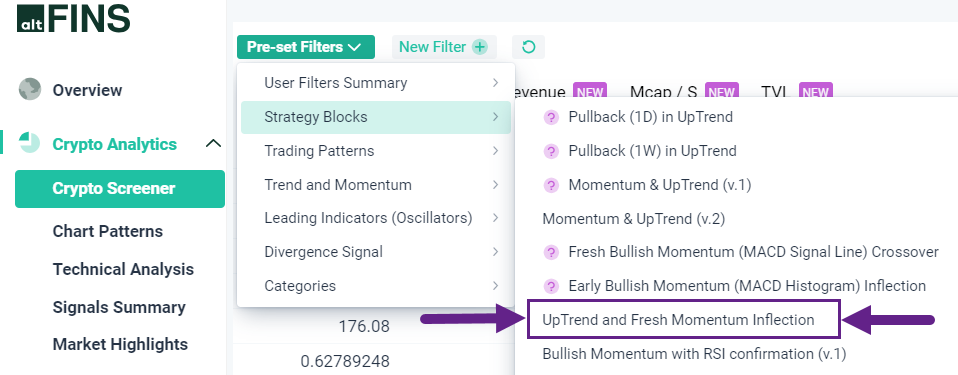
Execution: altFINS provides a pre-set filter in their Crypto Screener called “Uptrend and Fresh Momentum” to help traders find these setups instantly across thousands of coins.
This is a trend trading strategy that uses MACD Histogram indicator to time your entry and exit.
You can find an already predefined market scan right on our Pre-Set Filters on the Crypto Screneer:
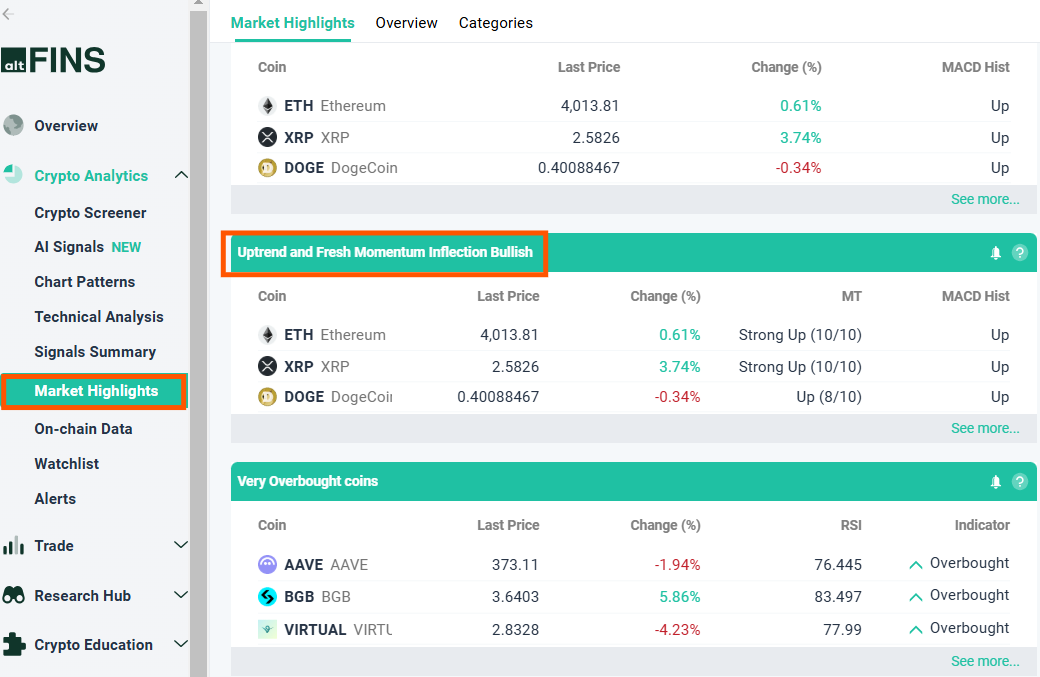
or in Market Highlights dashboard:
To identify such bullish momentum upswing early, we use the MACD Histogram indicator. It’s a great way to find such momentum inflection early on. To find out what is MACD, please check out our knowledge base for a video tutorial here.
When MACD Histogram bars stop declining and begin to rise again, that indicates a positive or bullish change in price momentum.
That’s a potentially attractive entry point for trend traders. Try this powerful trading set up now!
Pro TIP: you can create an Alert to get notifications of coins that fil this filter in the future. Here’s a tutorial. Alert notifications are delivered to the web platform, email and/or mobile app notifications. Download altFINS mobile app on either iOS or Android.
