Search Knowledge Base by Keyword
How To Trade Rising Wedge pattern? | Crypto Chart Pattern
A rising wedge pattern in crypto trading is a bearish reversal formation observed during an uptrend. It is characterized by two converging trendlines, both sloping upward, with the upper trendline typically steeper than the lower one.
As the price moves within this narrowing range, trading volume often diminishes, signaling weakening buying interest. Traders anticipate a bearish breakdown below the lower trendline, and the pattern’s target is often estimated by measuring the height of the wedge’s back and projecting it downward from the point of breakdown.
Rising Wedge Trade Setup
To practically set up a rising wedge trade in crypto, start by identifying the pattern during an uptrend on the price chart. Once you confirm the converging trendlines and decreasing volume, patiently wait for a clear breakout below the lower trendline, accompanied by increased trading volume.
When the breakout is confirmed, enter a short position just below the breakout point. To manage risk, set a stop-loss order above the upper trendline or a recent swing high. Estimate your target by measuring the height of the back of the wedge and projecting it downward.
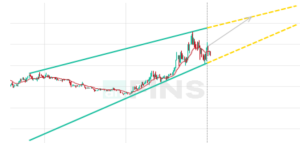
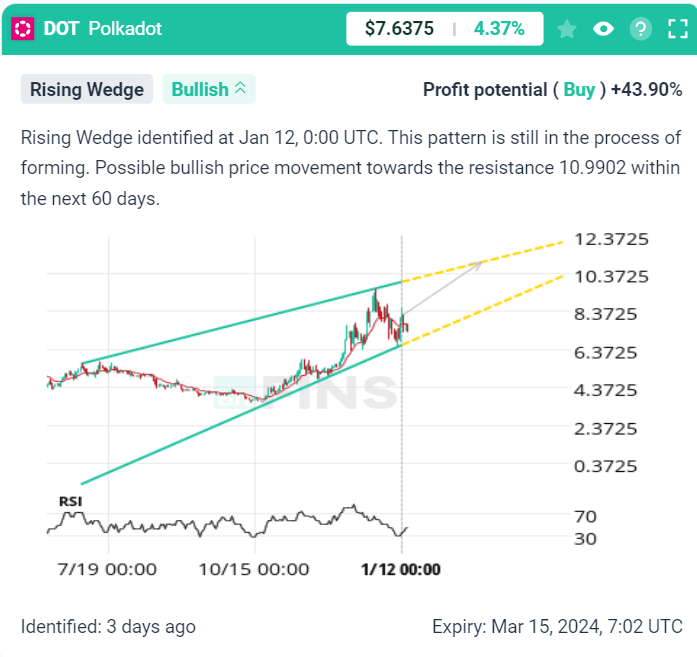
Rising Wedge – Emerging (DOT example)
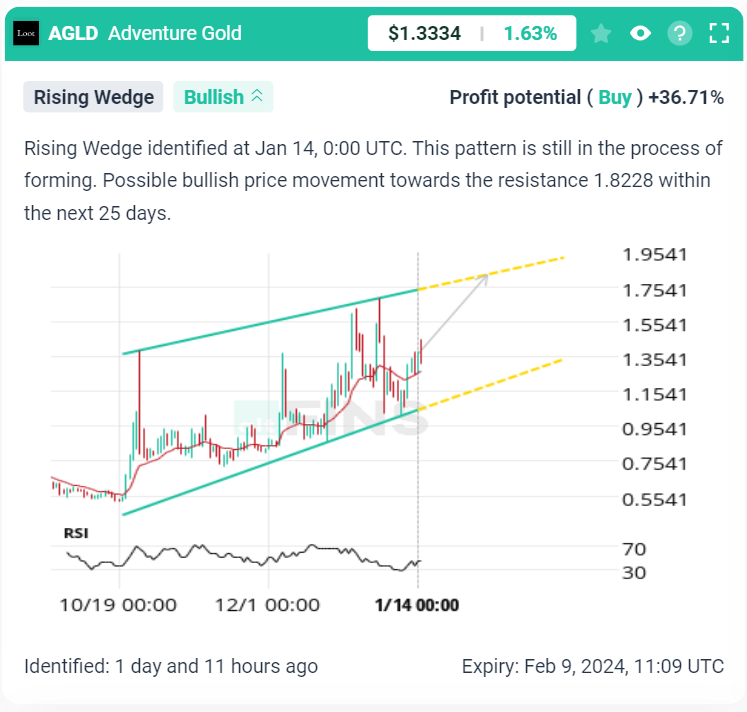
Rising Wedge – Emerging (AGLD example)
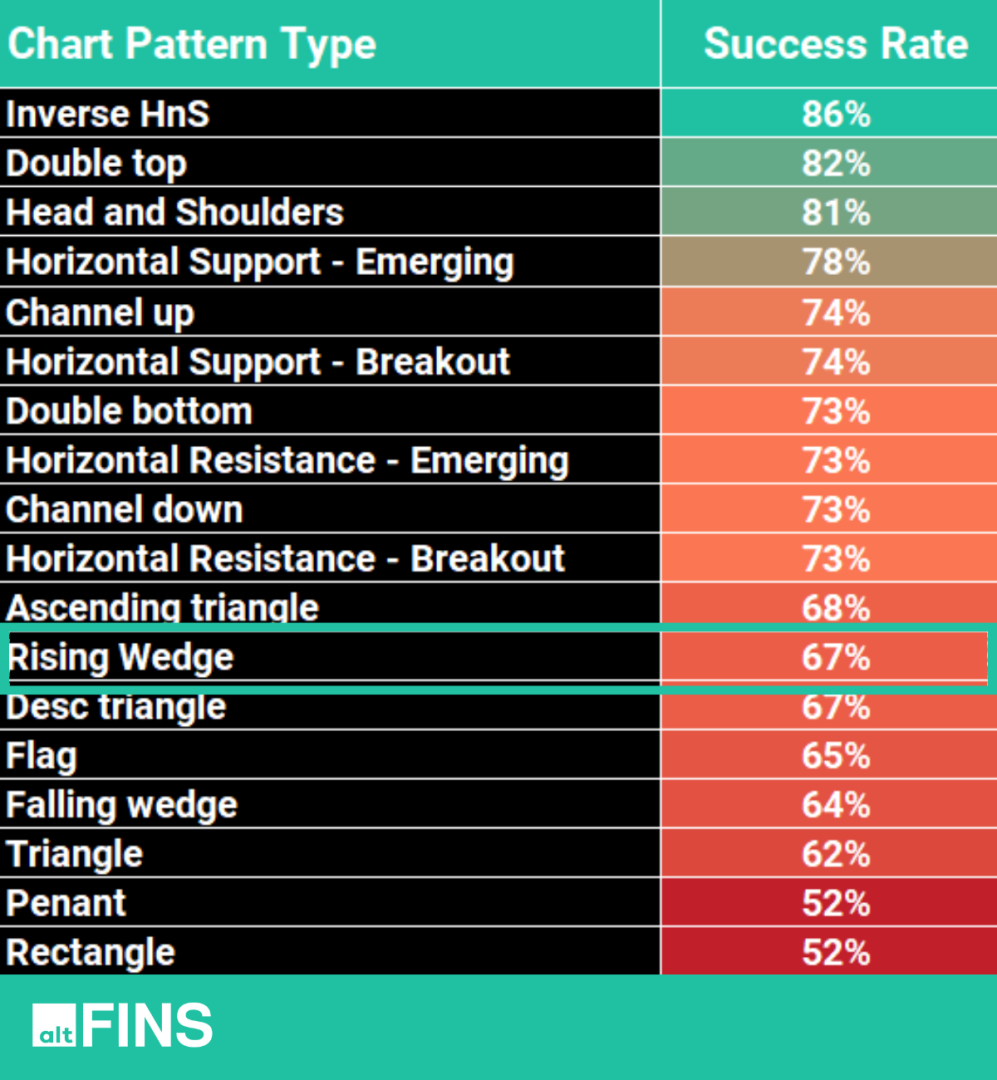
According to historical backtests conducted on the altFINS platform, the Rising Wedge pattern exhibits an impressive 67%!
Characteristics of Rising Wedge
The rising wedge pattern is characterized by several key features:
- Trend Direction: It typically forms during an uptrend, serving as a potential reversal pattern.
- Trendlines: The pattern is defined by two converging trendlines. The upper trendline connects the highs, and the lower trendline connects the lows.
- Slope: Both trendlines slope upward, with the upper trendline often being steeper than the lower one.
- Converging Shape: The trendlines gradually converge toward each other, forming a wedge-like shape.
- Volume: Trading volume often diminishes as the pattern develops, indicating a potential weakening of buying interest.
- Breakdown: The anticipated signal is a bearish breakdown below the lower trendline, suggesting a potential trend reversal.
- Duration: Rising wedges can vary in duration, but they are generally shorter-term patterns.
- Target: Traders estimate a downside target by measuring the height of the back of the wedge and projecting it downward from the breakout point.
How to Trade Rising Wedge Crypto Chart Patterns?
Trading a rising wedge pattern in crypto involves a strategy based on the anticipated bearish reversal. Here are steps you might consider when trading a rising wedge:
- Identification: Confirm the presence of a rising wedge pattern by drawing trendlines connecting the highs and lows. Ensure that the trendlines converge, forming a wedge.
- Confirmation: Wait for confirmation of the pattern, including a breakdown below the lower trendline. This breakdown should be accompanied by an increase in volume, validating the potential bearish move.
- Entry Point: Consider entering a short position (selling) once the price convincingly breaks below the lower trendline. Some traders may choose to wait for a candle to close below the trendline to confirm the breakout.
- Stop-Loss: Place a stop-loss order above the upper trendline or a recent swing high to manage risk. This helps protect your capital in case the price doesn’t follow the anticipated bearish trajectory.
- Target: Estimate the potential downside target by measuring the height of the back of the wedge and projecting it downward from the breakout point. This provides a rough target for the bearish move.
- Risk-Reward Ratio: Evaluate the risk-reward ratio to ensure that the potential reward justifies the risk. It’s common to seek trades with a favorable risk-reward profile.
- Monitoring: Continuously monitor the trade for any signs of a reversal or unexpected market developments. Adjust your strategy if necessary.
- Confirmation of Reversal: Once the price reaches the estimated target or shows signs of stabilization, consider closing the short position. Look for additional confirmation of a reversal or trend change.
How To Identify Rising Wedge Pattern on altFINS?
To identify cryptocurrencies with Rising Wedge patterns, visit these altFINS sections:
-
Chart Patterns section:
altFINS’ AI chart pattern recognition engine identifies 26 trading patterns across multiple time intervals (15 min, 1h, 4h, 1d), saving traders a ton of time.
You can filter chart patterns by type, profit potential, success rate, buy or sell direction, exchange, and more.

-
Signals Summary
Crypto signals represent a summary of pre-defined and custom filters for trading strategies. Signals Summary is a great starting point for discovering trading opportunities. Ascending triangle chart patterns can be found in the Trading Patterns category.

-
Crypto Screener – Pre-set filters
altFINS offers the best free crypto screener. It includes a wide range of pre- set filters to help find the best cryptocurrencies to invest in based on your specific trading strategy. Learn how to use crypto screener.

-
Crypto Screener – Custom filters
You can set up your own custom screens using combinations of technical indicators (SMA, EMA, RSI, MACD), variables like market cap, traded volume and price performance. You can also create price alerts for your scans.

-
Technical Analysis
altFINS’ analysts conduct technical analysis of top 60 coins. The technical analysis is simple and consistent. It follows the key concepts of Technical Analysis (TA): 1) Trend 2) Momentum 3) Volume 4) Chart Patterns 5) Support and Resistance.
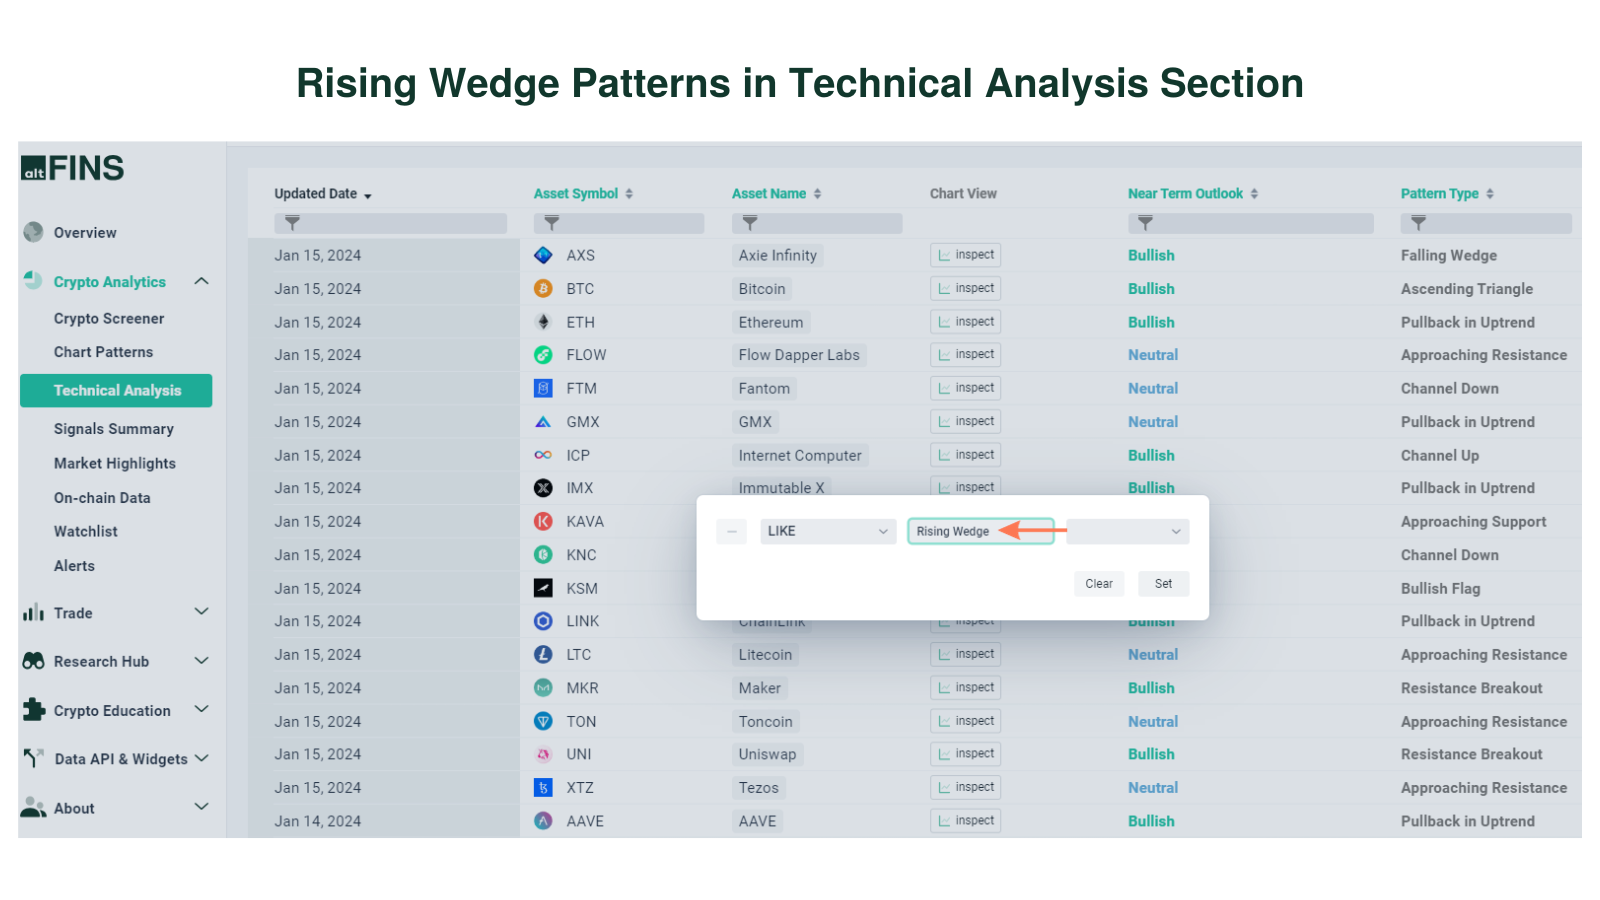
Go to Technical Analysis Section
More tips:
- Lean how to trade Chart Patterns?
- What are Crypto Chart Patterns?
- How to Trade Channel Down Pattern?
- How to Trade Channel Up Pattern?
- How to Set up Chart Pattern Alerts?
