Search Knowledge Base by Keyword
-
Overview
-
Crypto Analytics
-
- Why use it?
- Overview > Charts > Scorecards > Performance > Trend > Oscillators
- Add table columns
- Detail view
- Charts
- Create a Trading Signal or Filter
- Find SMA crossover signals
- Time intervals
- Create an alert
- Extreme Overbought coins Due for a Pullback
- Early momentum detection
- Crypto Trend Changes
- Why use it-coins screener
- Mastering Candlestick Patterns for Successful Crypto Trading
- What Are Fibonacci Retracement Levels?
- Essential Candlestick Patterns for Crypto Traders
- Using Local High to Spot Breakouts
- Oversold in Uptrend
- Strong Uptrend
- Show all articles ( 4 ) Collapse Articles
-
- Overview
- Chart Patterns
- Crypto Chart Patterns Cheat Sheet
- Emerging v. Complete
- Key Horizontal levels
- Consecutive Candles
- Big Movement
- Fibonacci Patterns
- 10 steps for how to trade crypto using Crypto Chart Patterns
- How to trade Channel Down? | Crypto Chart Pattern
- Tutorial: Using Custom Chart Pattern Filters
- How To Set Up Chart Patterns Alerts?
- How To Trade Channel Up Pattern? | Crypto Chart Pattern
- How To Trade Ascending Triangles? | Crypto Chart Pattern
- How To Trade Bullish Flag Pattern? | Crypto Chart Pattern
- How To Trade Sideways Channel pattern? | Crypto Chart Pattern
- How To Trade Rising Wedge pattern? | Crypto Chart Pattern
- How To Trade Falling Wedge pattern? | Crypto Chart Pattern
- How To Trade Descending Triangle pattern? | Crypto Chart Pattern
- How To Trade Inverse Head and Shoulders pattern? | Crypto Chart Pattern
- Show all articles ( 5 ) Collapse Articles
-
- Signals Summary Overview
- How To Find And Trade Pullbacks In Uptrend (Buying Dips)?
- Momentum & Up / Down Trend
- Range in Up/Down Trend
- Momentum
- How to trade EMA 12 / 50 crossovers?
- Moving Average Ribbons
- Strong Up / Down Trend
- Strong Up / Down Trend (Short Term)
- Strong Up / Down Trend (Medium Term)
- Strong Up / Down Trend (Long Term)
- Price / SMA Crossovers In Crypto
- What are Price / EMA Crossovers in crypto?
- SMA Crossovers
- EMA Crossovers
- Unusual Volume Gainers / Decliners
- New Up/Down trend (ADX)
- Bollinger Band - Price Broke Upper / Lower Band
- Strong Up / Down Trend and Oversold / Overbought
- Strong Up / Down Trend and Strong / Weak Ultimate Oscillator
- MACD (12,27,9) Signal Line cross
- MACD (12,27,9) Center Line cross
- Commodity Channel Index cross
- Overall Score of Oscillators (Oversold / Overbought)
- Relative Strength Index (9)
- Relative Strength Index (14)
- Relative Strength Index (25)
- Stochastic RSI Fast (3, 3, 14, 14)
- Williams Percent Range (14)
- Bull Power
- MACD line
- Relative Strength Index (RSI) Divergence: Explained
- How to Trend Trade Crypto
- Early momentum detection
- Short-Medium-Long-Term Trend
- Relative Strength Index
- Uptrend and Fresh Bullish Momentum Inflection
- Using Local High to Spot Breakouts
- Oversold in Uptrend
- Strong Uptrend
- Show all articles ( 25 ) Collapse Articles
-
- Volume
- OBV Divergence Indicator
- SMA vs. EMA
- RSI Divergence and Trading RSI
- Stochastic (14, 3, 3) (STOCH)
- What is CCI 20? (Commodity Channel Index 20)
- ADX
- MACD Line and MACD Signal Line
- Williams %R
- Stochastic RSI Fast
- Bull / Bear Power
- What is the UO: Ultimate Oscillator (7, 14, 28)
- Short Term Trend
- Medium Term Trend
- Long Term Trend
- Oscillator Rating
- Trading Multiple Time Frames
- Support and Resistance
- Polarity principle
- Early momentum detection
- Crypto Trend Changes
- MACD Histogram (H1, H2)
- What Are Fibonacci Retracement Levels?
- Using Local High to Spot Breakouts
- Oversold in Uptrend
- Strong Uptrend
- Show all articles ( 11 ) Collapse Articles
-
-
Trade Crypto
-
- Initiating a trade
- Market vs. Limit order
- Refreshing tables
- Are derivatives such as futures, options and perpetual swaps supported?
- Does altFINS charge trading fees?
- Balances
- Open Orders
- Transaction History
- Order book & Trades
- Connecting to exchanges
- How to trade cryptocurrencies?
- Trading Risk Management
-
-
Research Hub
-
Crypto Education
-
- Where To Buy And Sell Cryptocurrency?
- When Is The Best Time To Buy And Sell Cryptocurrency?
- Crypto Profits: Full Guide How to Take Profits In Cryptocurrency
- What Is Crypto Copy Trading?
- What Is Leverage Trading Cryptocurrency?
- Crypto Arbitrage Trading: Meaning, Signals And Opportunities
- Crypto Hot Wallet vs. Cold Wallet: What is the Difference
- Crypto Trading Strategies
- Difference Between Crypto Fundamental and Technical Analysis
- List of TOP Decentralized Exchanges 2024
-
-
About
-
AFINS Token
- Articles coming soon
Momentum
This screen looks for coins with momentum, regardless of trend direction.
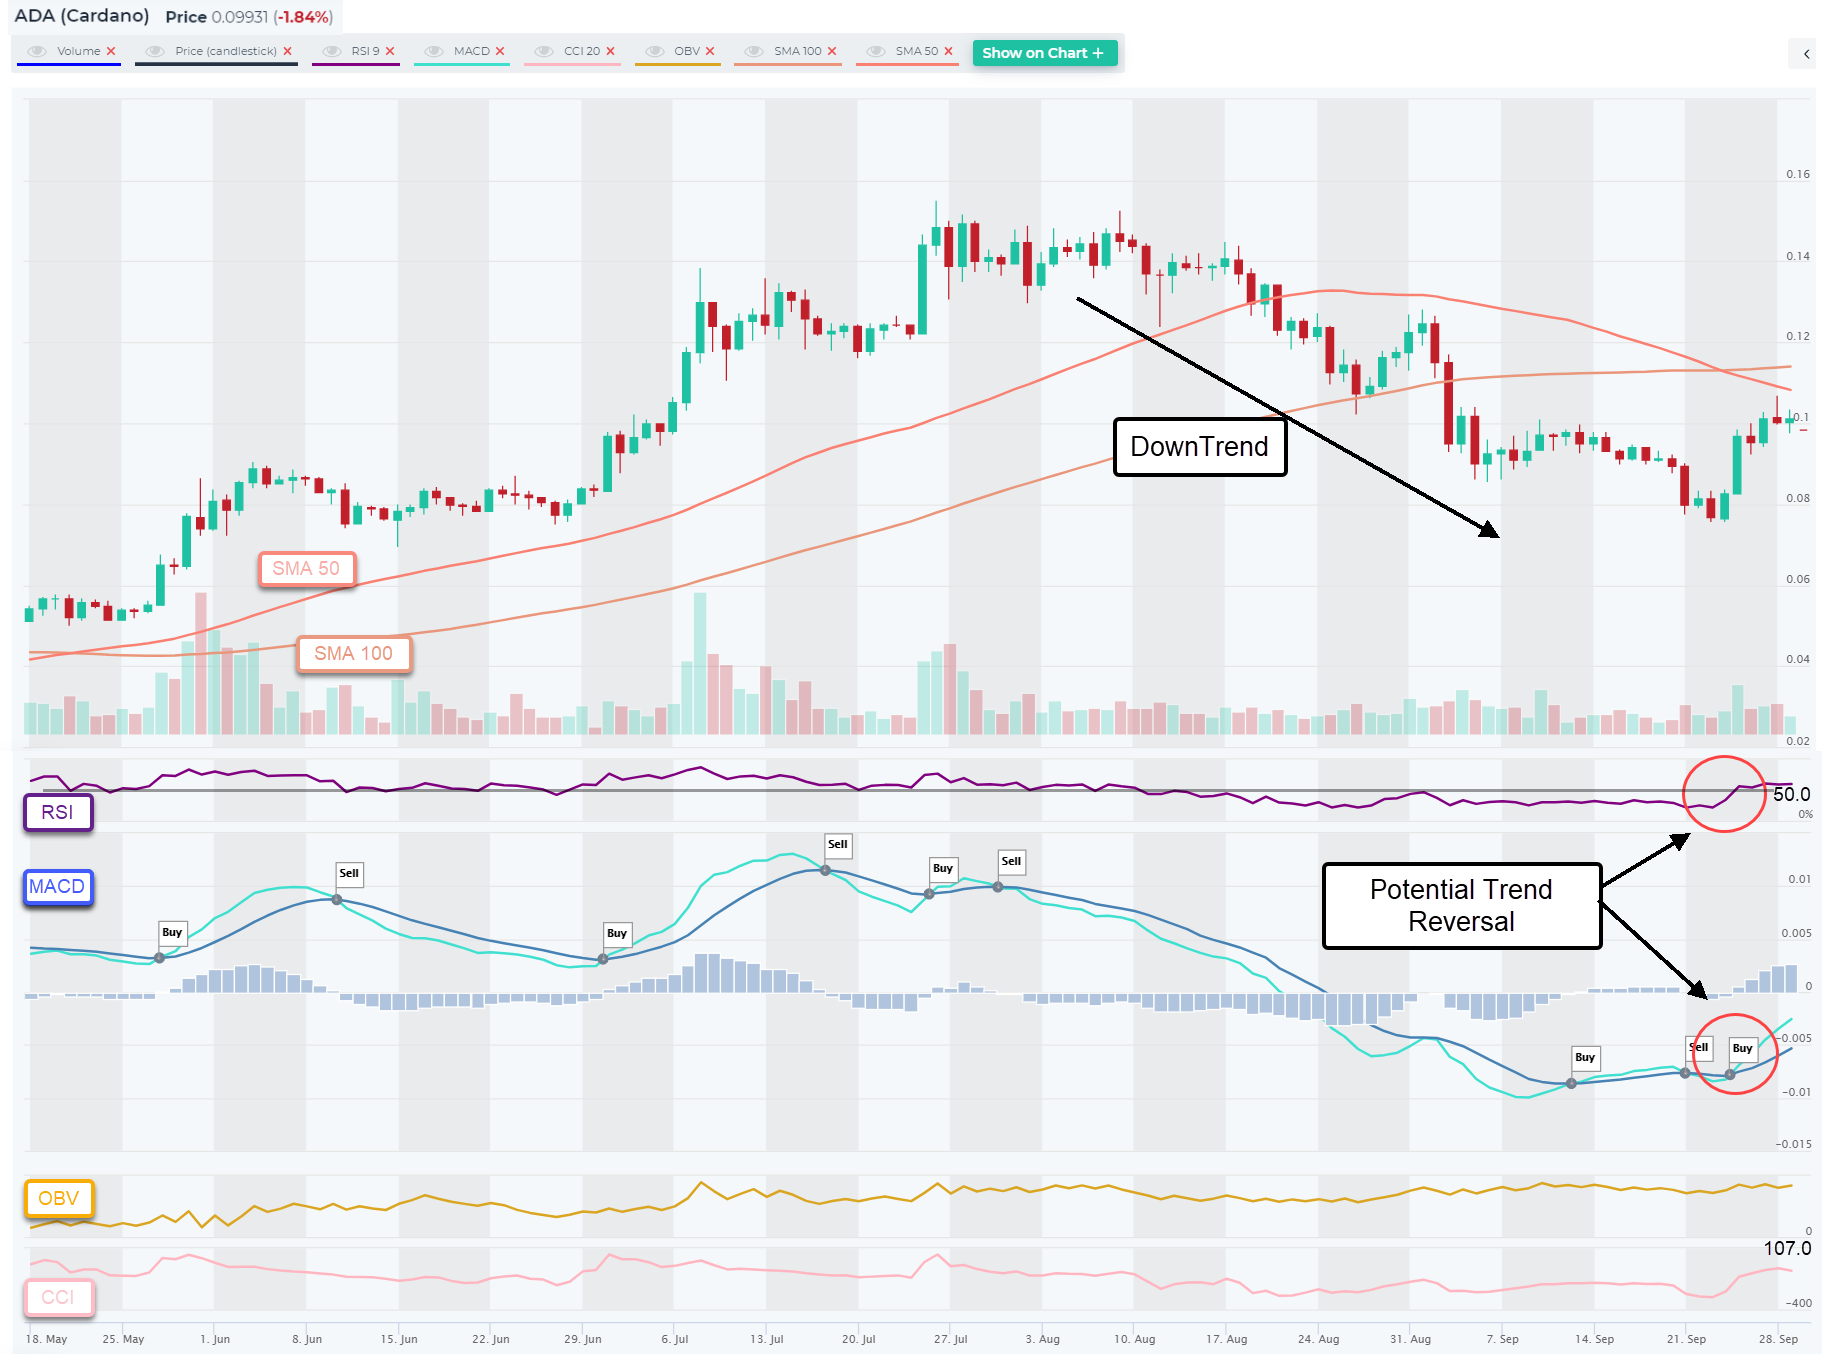
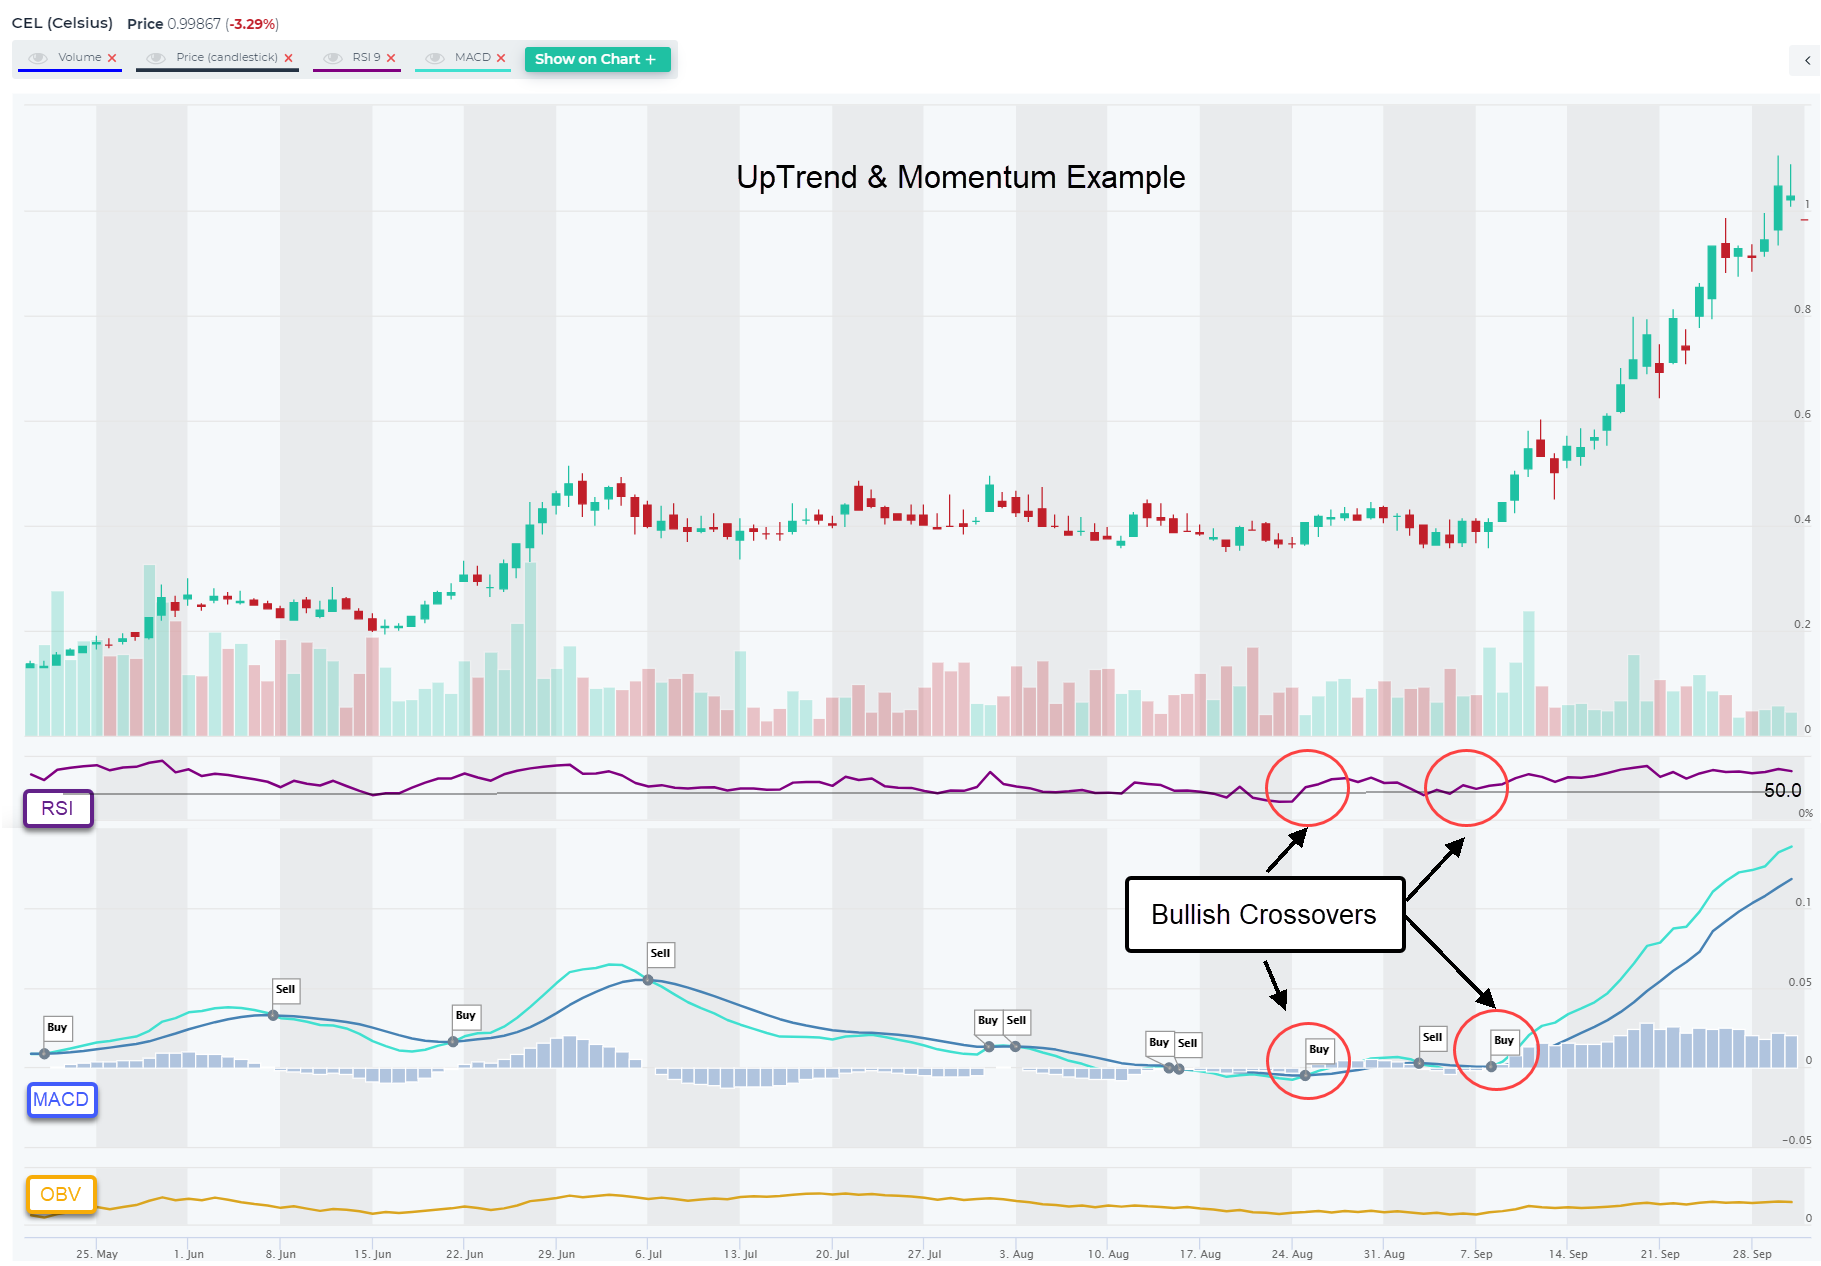
- Confirmation of a trend. If the momentum signals are bullish and the general uptrend is Up, then this can serve as a confirmation.
- Reversal indication. If the momentum signals are bullish but the general trend has been Down, then this could signal a trend reversal (from Down to Up in this case). Vice versa, if the coin has been in an UpTrend, but momentum signals turn bearish, this could indicate a correction / pullback or a trend reversal.
Momentum is captured using MACD and RSI indicators, although one could add others like CCI (cross above -100 is bullish and cross below +100 is bearish).
Screen definition (bullish):
- Bullish MACD crossover (MACD is above MACD Signal Line)
- Bullish RSI crossover (RSI is above 50)
- Volume ($) is above 200,000 (need decent liquidity)
Additionally, a trader could visually examine OBV (On Balance Volume) indicator to see if it’s rising and at or near it’s highs. This would indicate that “up” days have greater volume than “down” days, which is bullish.

Momentum & Up / Down Trend
This screen looks for coins in a long-term uptrend and a recent bullish momentum upswing.
Momentum is captured using MACD and RSI indicators, although one could add others like CCI (cross above -100 is bullish and cross below +100 is bearish).
Screen definition (bullish):
- Short Term Trend is Up
- Medium Term Trend is Up
- Long Term Trend is Up
- Bullish MACD crossover (MACD is above MACD Signal Line)
- Bullish RSI crossover (RSI is above 50)
- Volume ($) is above 200,000 (need decent liquidity)
Additionally, a trader could visually examine OBV (On Balance Volume) indicator to see if it’s rising and at or near it’s highs. This would indicate that “up” days have greater volume than “down” days, which is bullish.

