Search Knowledge Base by Keyword
How To Trade Falling Wedge pattern? | Crypto Chart Pattern
What is a Falling Wedge Pattern?
A falling wedge is a chart pattern that forms when price action is contained between two downward-sloping, converging trendlines. This structure indicates contracting price range and decreasing volatility over time.
Types of Falling Wedge Patterns
Bullish Falling Wedge (Reversal Pattern)
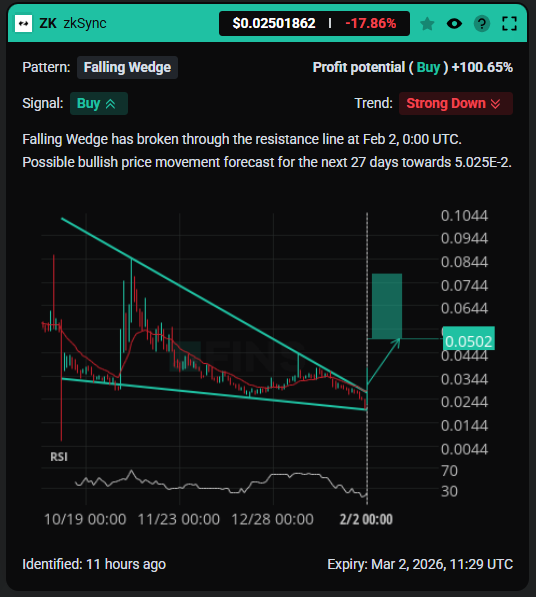
The bullish falling wedge appears during a downtrend and signals a potential reversal to the upside.
Characteristics:
- Forms during an established downtrend
- Two downward-sloping trendlines that converge
- Lower trendline connects progressively lower lows (support)
- Upper trendline connects progressively lower highs (resistance)
- Decreasing volume as the pattern develops
- Breakout occurs above the upper resistance line
- Often accompanied by volume spike on breakout
Price Target Calculation: Measure the height at the widest part of the wedge, then project that distance upward from the breakout point.
Bearish Falling Wedge (Continuation Pattern)
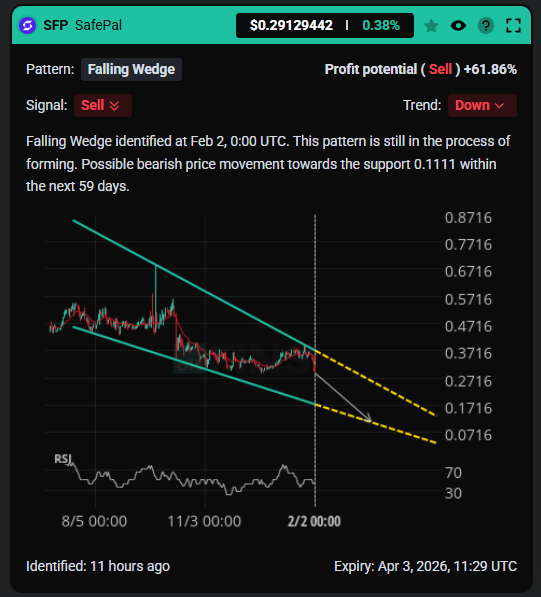
Though less common, a falling wedge can also appear during an uptrend as a continuation pattern.
Characteristics:
- Forms during an established uptrend
- Similar converging downward trendlines
- Represents a temporary pause or consolidation
- Breakdown below lower support line signals continuation of downtrend
- Decreasing volume during formation
Price Target Calculation: Measure the wedge height and project downward from the breakdown point.
How to Identify a Falling Wedge Pattern
Visual Identification
- Trendline Requirements: You need at least two touch points on both the upper and lower trendlines (ideally three or more for stronger confirmation)
- Convergence: Both trendlines must slope downward and converge toward an apex
- Duration: Patterns typically develop over 3-12 weeks (can vary by timeframe)
- Volume Profile: Look for declining volume as the pattern forms
Using Technical Tools
Manual Chart Analysis:
- Draw trendlines connecting the swing highs and swing lows
- Verify both lines are sloping downward
- Confirm convergence toward a future point
Automated Pattern Recognition:
- Use altFINS platform with AI-powered pattern detection
- Filter by chart pattern type and choose your preferred timeframe (15-min, 1-hour, 4-hour, daily charts)
- Set up alerts for falling wedge formations
Step-by-Step Trading Strategy for Falling Wedge Patterns
Entry Strategy
Step 1: Pattern Confirmation
- Verify at least 2-3 touches on each trendline
- Confirm downward slope on both lines
- Check that volume is decreasing during formation
Step 2: Wait for the Breakout
- Monitor for price breaking above the upper resistance trendline
- Look for a decisive break (not just a wick)
- Confirm with increased volume on the breakout candle (volume should be 50-100% above recent average)
Step 3: Entry Point
- Aggressive Entry: Enter immediately upon breakout above resistance
- Conservative Entry: Wait for a retest of the broken resistance line (now acting as support)
Risk Management
Stop Loss Placement:
- Place stop loss below the most recent swing low within the wedge
- Alternative: Set stop loss below the lower support trendline
- Risk typically 2-5% of position size
Take Profit Targets:
- Target 1 (Conservative): Measure the wedge height at its widest point and project upward from breakout
- Target 2 (Moderate): Previous resistance level or significant horizontal support/resistance zone
- Target 3 (Aggressive): Fibonacci extension levels (1.618 or 2.0)
Position Sizing
- Risk no more than 1-2% of your total portfolio per trade
- Consider scaling into positions (25-50% on breakout, remaining on retest)
Common Mistakes to Avoid
- Entering Too Early: Don’t trade the pattern before a confirmed breakout—false breakouts are common
- Ignoring Volume: A breakout without increased volume often fails
- Poor Stop Loss Placement: Stops that are too tight get triggered by normal volatility
- Missing Context: Always consider the broader trend and market conditions
- Overtrading the Pattern: Not every falling wedge completes successfully—wait for high-probability setups
Combining Falling Wedge with Other Indicators
Complementary Technical Indicators
RSI (Relative Strength Index):
- Look for bullish divergence (price making lower lows while RSI makes higher lows)
- RSI crossing above 50 on breakout adds confirmation
MACD (Moving Average Convergence Divergence):
- Watch for MACD line crossing above signal line
- Positive histogram expansion confirms momentum
Volume Analysis:
- Volume should decrease during pattern formation
- Volume should spike (50-100% above average) on breakout
- On-Balance Volume (OBV) trending upward signals accumulation
Moving Averages:
- Price breaking above 50-day or 200-day moving average adds strength
- Moving average convergence can signal trend change
How To Identify Falling Wedge Pattern on altFINS?
To identify cryptocurrencies with Falling Wedge patterns, visit these altFINS sections:
-
Chart Patterns section:
altFINS’ AI chart pattern recognition engine identifies 26 trading patterns across multiple time intervals (15 min, 1h, 4h, 1d), saving traders a ton of time.
You can filter chart patterns by type, profit potential, success rate, buy or sell direction, exchange, and more.
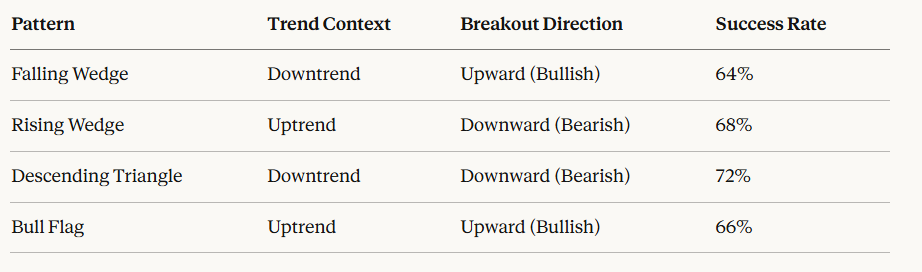
Success Rate of Falling Wedge Pattern
Best Cryptocurrencies for Trading Falling Wedge Patterns
The falling wedge pattern works across all cryptocurrency pairs, but tends to be most reliable in:
- Large-cap coins: BTC, ETH (higher liquidity, less manipulation)
- Mid-cap altcoins: SOL, AVAX, MATIC (good balance of volatility and volume)
- Trending tokens: Coins with strong fundamentals and active communities
Timeframes: The pattern works on all timeframes, but higher reliability on 4-hour and daily charts.
Advanced Tips for Professional Traders
- Multi-Timeframe Analysis: Confirm the pattern exists on both your trading timeframe and one timeframe higher
- Market Context: Falling wedges are more reliable in overall bullish market conditions
- News Catalysts: Combine pattern trading with fundamental analysis and upcoming events
- Partial Profit Taking: Scale out at multiple targets rather than all-or-nothing exits
- Pattern Failure Recognition: If price breaks below the lower trendline, exit immediately—the pattern has failed
How To Find Cryptocurrencies With Falling Wedge Pattern on altFINS?
To find coins with falling wedge pattern in seconds with Chart Patterns section and choose “Falling Wedge” in Chart Pattern Types.

-
Signals Summary
Crypto signals represent a summary of pre-defined and custom filters for trading strategies. Signals Summary is a great starting point for discovering trading opportunities. Ascending triangle chart patterns can be found in the Trading Patterns category.

-
Crypto Screener – Pre-set filters
altFINS offers the best free crypto screener. It includes a wide range of pre- set filters to help find the best cryptocurrencies to invest in based on your specific trading strategy. Learn how to use crypto screener.

- Technical Analysis
altFINS’ analysts conduct technical analysis of top 60 coins. The technical analysis is simple and consistent. It follows the key concepts of Technical Analysis (TA): 1) Trend 2) Momentum 3) Volume 4) Chart Patterns 5) Support and Resistance.

Go to Technical Analysis Section
Best Cryptocurrencies for Trading Falling Wedge Patterns
The falling wedge pattern works across all cryptocurrency pairs, but tends to be most reliable in:
- Large-cap coins: BTC, ETH (higher liquidity, less manipulation)
- Mid-cap altcoins: SOL, AVAX, MATIC (good balance of volatility and volume)
- Trending tokens: Coins with strong fundamentals and active communities
Timeframes: The pattern works on all timeframes, but higher reliability on 4-hour and daily charts.
Advanced Tips for Professional Traders
- Multi-Timeframe Analysis: Confirm the pattern exists on both your trading timeframe and one timeframe higher
- Market Context: Falling wedges are more reliable in overall bullish market conditions
- News Catalysts: Combine pattern trading with fundamental analysis and upcoming events
- Partial Profit Taking: Scale out at multiple targets rather than all-or-nothing exits
- Pattern Failure Recognition: If price breaks below the lower trendline, exit immediately—the pattern has failed
Screening and Alerts
- Set up automated alerts for falling wedge formations
- Use custom screeners combining pattern recognition with volume and momentum filters
Frequently Asked Questions
How reliable is the falling wedge pattern?
The falling wedge has approximately a 64% success rate based on historical cryptocurrency backtests, making it one of the more reliable chart patterns for trading.
What timeframe works best for falling wedge patterns?
While the pattern appears on all timeframes, 4-hour and daily charts tend to provide the most reliable signals with fewer false breakouts.
Should I wait for a retest before entering?
Conservative traders should wait for a retest of the broken resistance (now support). Aggressive traders can enter on the initial breakout with tighter stop losses.
How long does a falling wedge take to form?
Typically 3-12 weeks on daily charts, but this varies significantly based on the timeframe and asset volatility.
Can falling wedges fail?
Yes, approximately 36% of falling wedges fail to reach their projected targets. Always use stop losses and proper risk management.
Conclusion: Mastering the Falling Wedge Pattern
The falling wedge is a powerful technical pattern that signals potential trend reversals in cryptocurrency markets. By combining proper pattern identification, volume confirmation, complementary technical indicators, and disciplined risk management, traders can capitalize on high-probability setups.
Key Takeaways:
- Falling wedges are bullish reversal patterns with 64% success rates
- Wait for confirmed breakouts above resistance with increased volume
- Always use stop losses below recent swing lows
- Calculate targets using wedge height measurements
- Combine with RSI, MACD, and volume analysis for higher conviction
- Practice pattern recognition and backtest before trading with real capital
Next Steps:
- Add falling wedge pattern alerts to your watchlist
- Practice identifying patterns on historical charts
- Paper trade the strategy before using real funds
- Keep a trading journal to track pattern performance
- Continuously refine your entry and exit criteria
More tips:
- Lean how to trade Chart Patterns?
- What are Crypto Chart Patterns?
- How to Trade Channel Down Pattern?
- How to Trade Channel Up Pattern?
- How to Set up Chart Pattern Alerts?
- How To Trade Rising Wedge pattern?
