Search Knowledge Base by Keyword
Trading RSI and RSI Divergence
Introduction
The Relative Strength Index (RSI) is one of the most popular indicators in crypto trading. It helps traders identify when a cryptocurrency may be overbought or oversold, spot momentum shifts, and anticipate potential price reversals. In this guide, you’ll learn how RSI works and how traders use it in simple, practical strategies—from basic overbought/oversold signals to trend-based setups and RSI divergence.
This article describes how to calculate RSI, how to trade RSI and RSI divergence, including overbought/oversold levels, and divergences.
There are several crypto trading strategies that effectively utilize this powerful indicator:
(1) Classic RSI Mean Reversion (simple, most common)
(2) RSI + Support/Resistance (higher probability)
(3) RSI + Trend Filter (more advanced version)
(4) RSI Momentum Breakout
(5) RSI Divergence
Crypto Relative Strength Index (RSI) explained:
Relative Strength Index (RSI) is used in crypto trading as a momentum indicator that measures the magnitude of recent price changes to analyze overbought or oversold conditions.
RSI values range from 0 to 100.
How to calculate RSI Indicator:
The relative strength index (RSI) is calculated using the following formula: RSI = 100 – 100 / (1 + RS) where RS = Average gain of up periods during the specified time frame / Average loss of down periods during the specified time frame.
(1) Simple RSI Trading Signals: Overbought vs. Oversold
Rules
-
Buy when RSI < 30 (oversold price)
-
Sell when RSI > 70 (overbought price)
Works best
-
Ranging markets
-
Lower timeframes
Fails
-
Strong trends (RSI can stay overbought/oversold)
Coin price is considered overbought (due for a pullback) when RSI is above 70, and oversold (due for a rebound) when it is below 30. Some traders use more extreme levels (75/25) or even (80/20) to reduce false readings.
Here’s an example of an asset that is oversold (RSI < 30). Notice how every time it got oversold on RSI, price bounced up briefly.
Oversold (RSI <30) example:

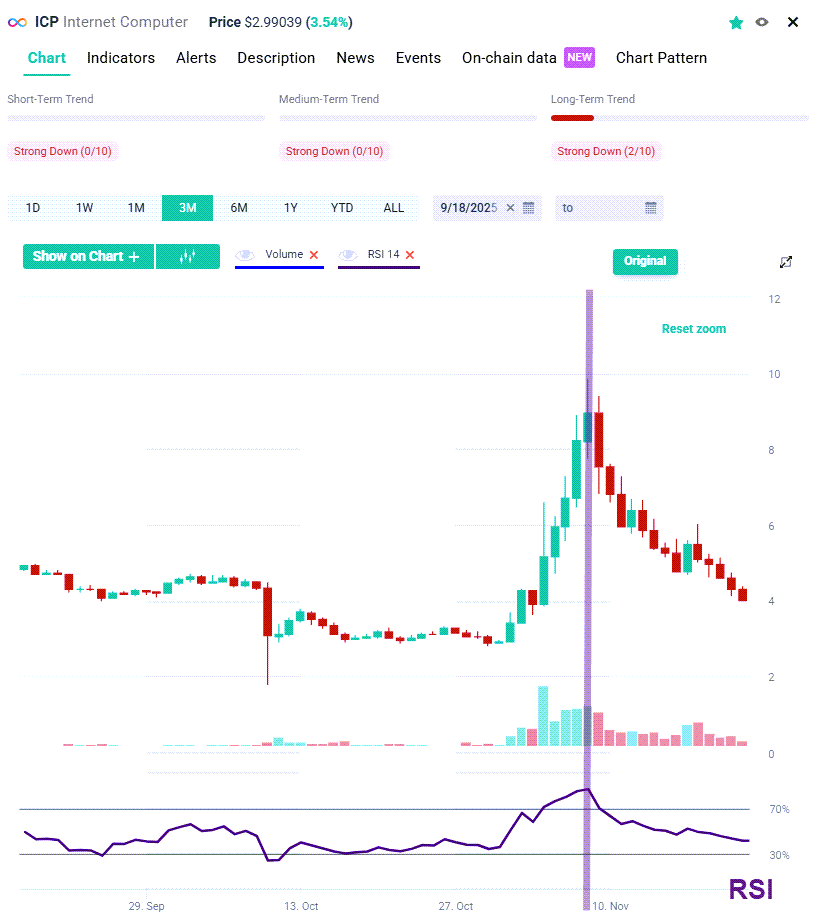
Overbought (RSI > 70) example:
The following example, ICP (Internet Computer Protocol), shot up in November 2025 but got way overbought (RSI > 85!!) and reversed afterwards as traders took profits.
When coin prices get so extremely overbought, traders need to take profits or use trailing take profit orders to lock in their profits.
WARNING: In a strong uptrend, RSI will often reach 70 and beyond for sustained periods. And during downtrends, price can stay at 30 or below for a long time. While general overbought and oversold levels can be accurate, they may not provide the most timely signals for trend traders.
(2) RSI + Support/Resistance (higher probability strategy)
Oversold (RSI < 30) at Support and Overbought (RSI > 70) at Resistance
Rules
-
Only take RSI signals at:
-
key horizontal levels
-
VWAP
-
trendlines
-
Effect
-
Dramatically reduces false signals
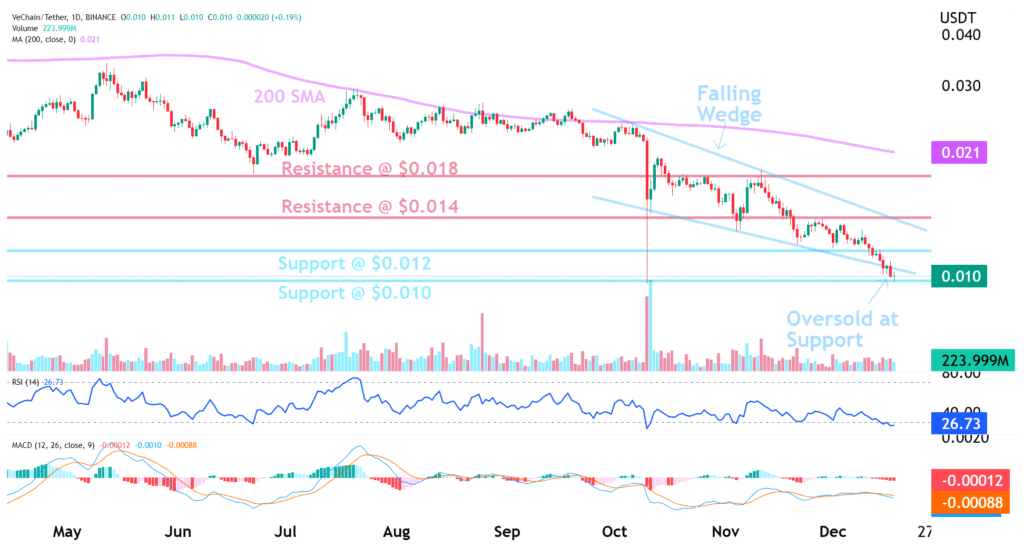
To increase the success of trade setups using RSI, crypto traders pay attention to Support and Resistance.
When a coin is oversold (RSI < 30) AND is near Support, there’s a higher chance of a bounce up.
Here’s an example: VET (VeChain) price is oversold (RSI = 26.7) AND price is at $0.010 support. There’s a good chance it will bounce up in the near-term.
(3) RSI + Trend Filter
Rules
-
Identify trend using altFINS trend ratings
-
Uptrend: only buy RSI dips to 30–40
-
Downtrend: only sell RSI rallies to 60–70
Why it works
-
Avoids fading strong trends
To increase success rates even more when trading RSI, traders can also layer on another condition: trend.
Hence, it’s best to trade with the trend. Buy in Uptrend and Sell in Downtrend.
So with RSI, a trader would either
- Buy when cryptocurrency is in an Uptrend AND is Oversold (RSI< 30) AND is near Support. Sometimes, traders use RSI < 40 instead.
- Short Sell when cryptocurrency is in a Downtrend AND is Overbougth (RSI > 70) AND is near Resistance. Sometimes, traders use RSI > 60 instead.
altFINS platform constantly calculates and refreshes trend ratings for over 2,000 cryptocurrencies. This makes it very easy for traders to find assets in a Uptrend or Downtrend.
(4) RSI Momentum Breakout
ules
-
RSI breaks above 50 → bullish momentum
-
RSI breaks below 50 → bearish momentum
Use case
-
Trend continuation
-
Early trend confirmation
This again is best if combined with trend: a BUY signal occurs when the RSI breaks above 50 AND price is in an Uptrend.. A SELL signal occurs when RSI breaks below 50 AND price is in a Downtrend.
(5) RSI Divergence Crypto Trading Strategy
Bullish divergence
-
Price: lower low
-
RSI: higher low → buy
Bearish divergence
-
Price: higher high
-
RSI: lower high → sell
Best
-
Near support/resistance
-
On higher timeframes
Watching for a divergence between price and the RSI is another way to use it in your crypto trading strategy.
Bullish divergence, which is interpreted as a buy signal, occurs when price makes a Lower Low, but the RSI value does not (makes a Higher Low).
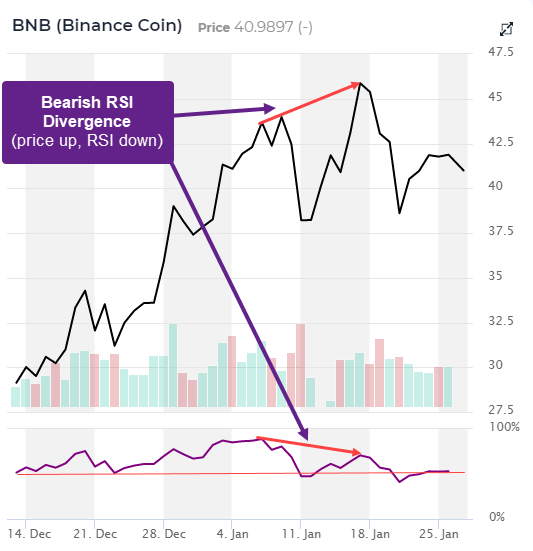
A bearish divergence forms when a coin price records a Higher High but RSI forms a Lower High. Hence, the RSI does not confirm the new price high and this shows weakening momentum.
RSI divergence signals tend to be more accurate on the longer time frames (min 1-hour charts). You get fewer false signals
Benefits and Drawbacks of RSI Divergence
RSI divergence is a strong indication, although it is not always accurate. Divergences can occasionally show up too soon, and prices may keep rising before turning around. For this reason, a lot of traders mix RSI divergence with other indicators including candlestick patterns, support/resistance levels, and chart patterns (such falling wedges). Traders can boost the likelihood of successful entrances and exits by combining numerous signals.
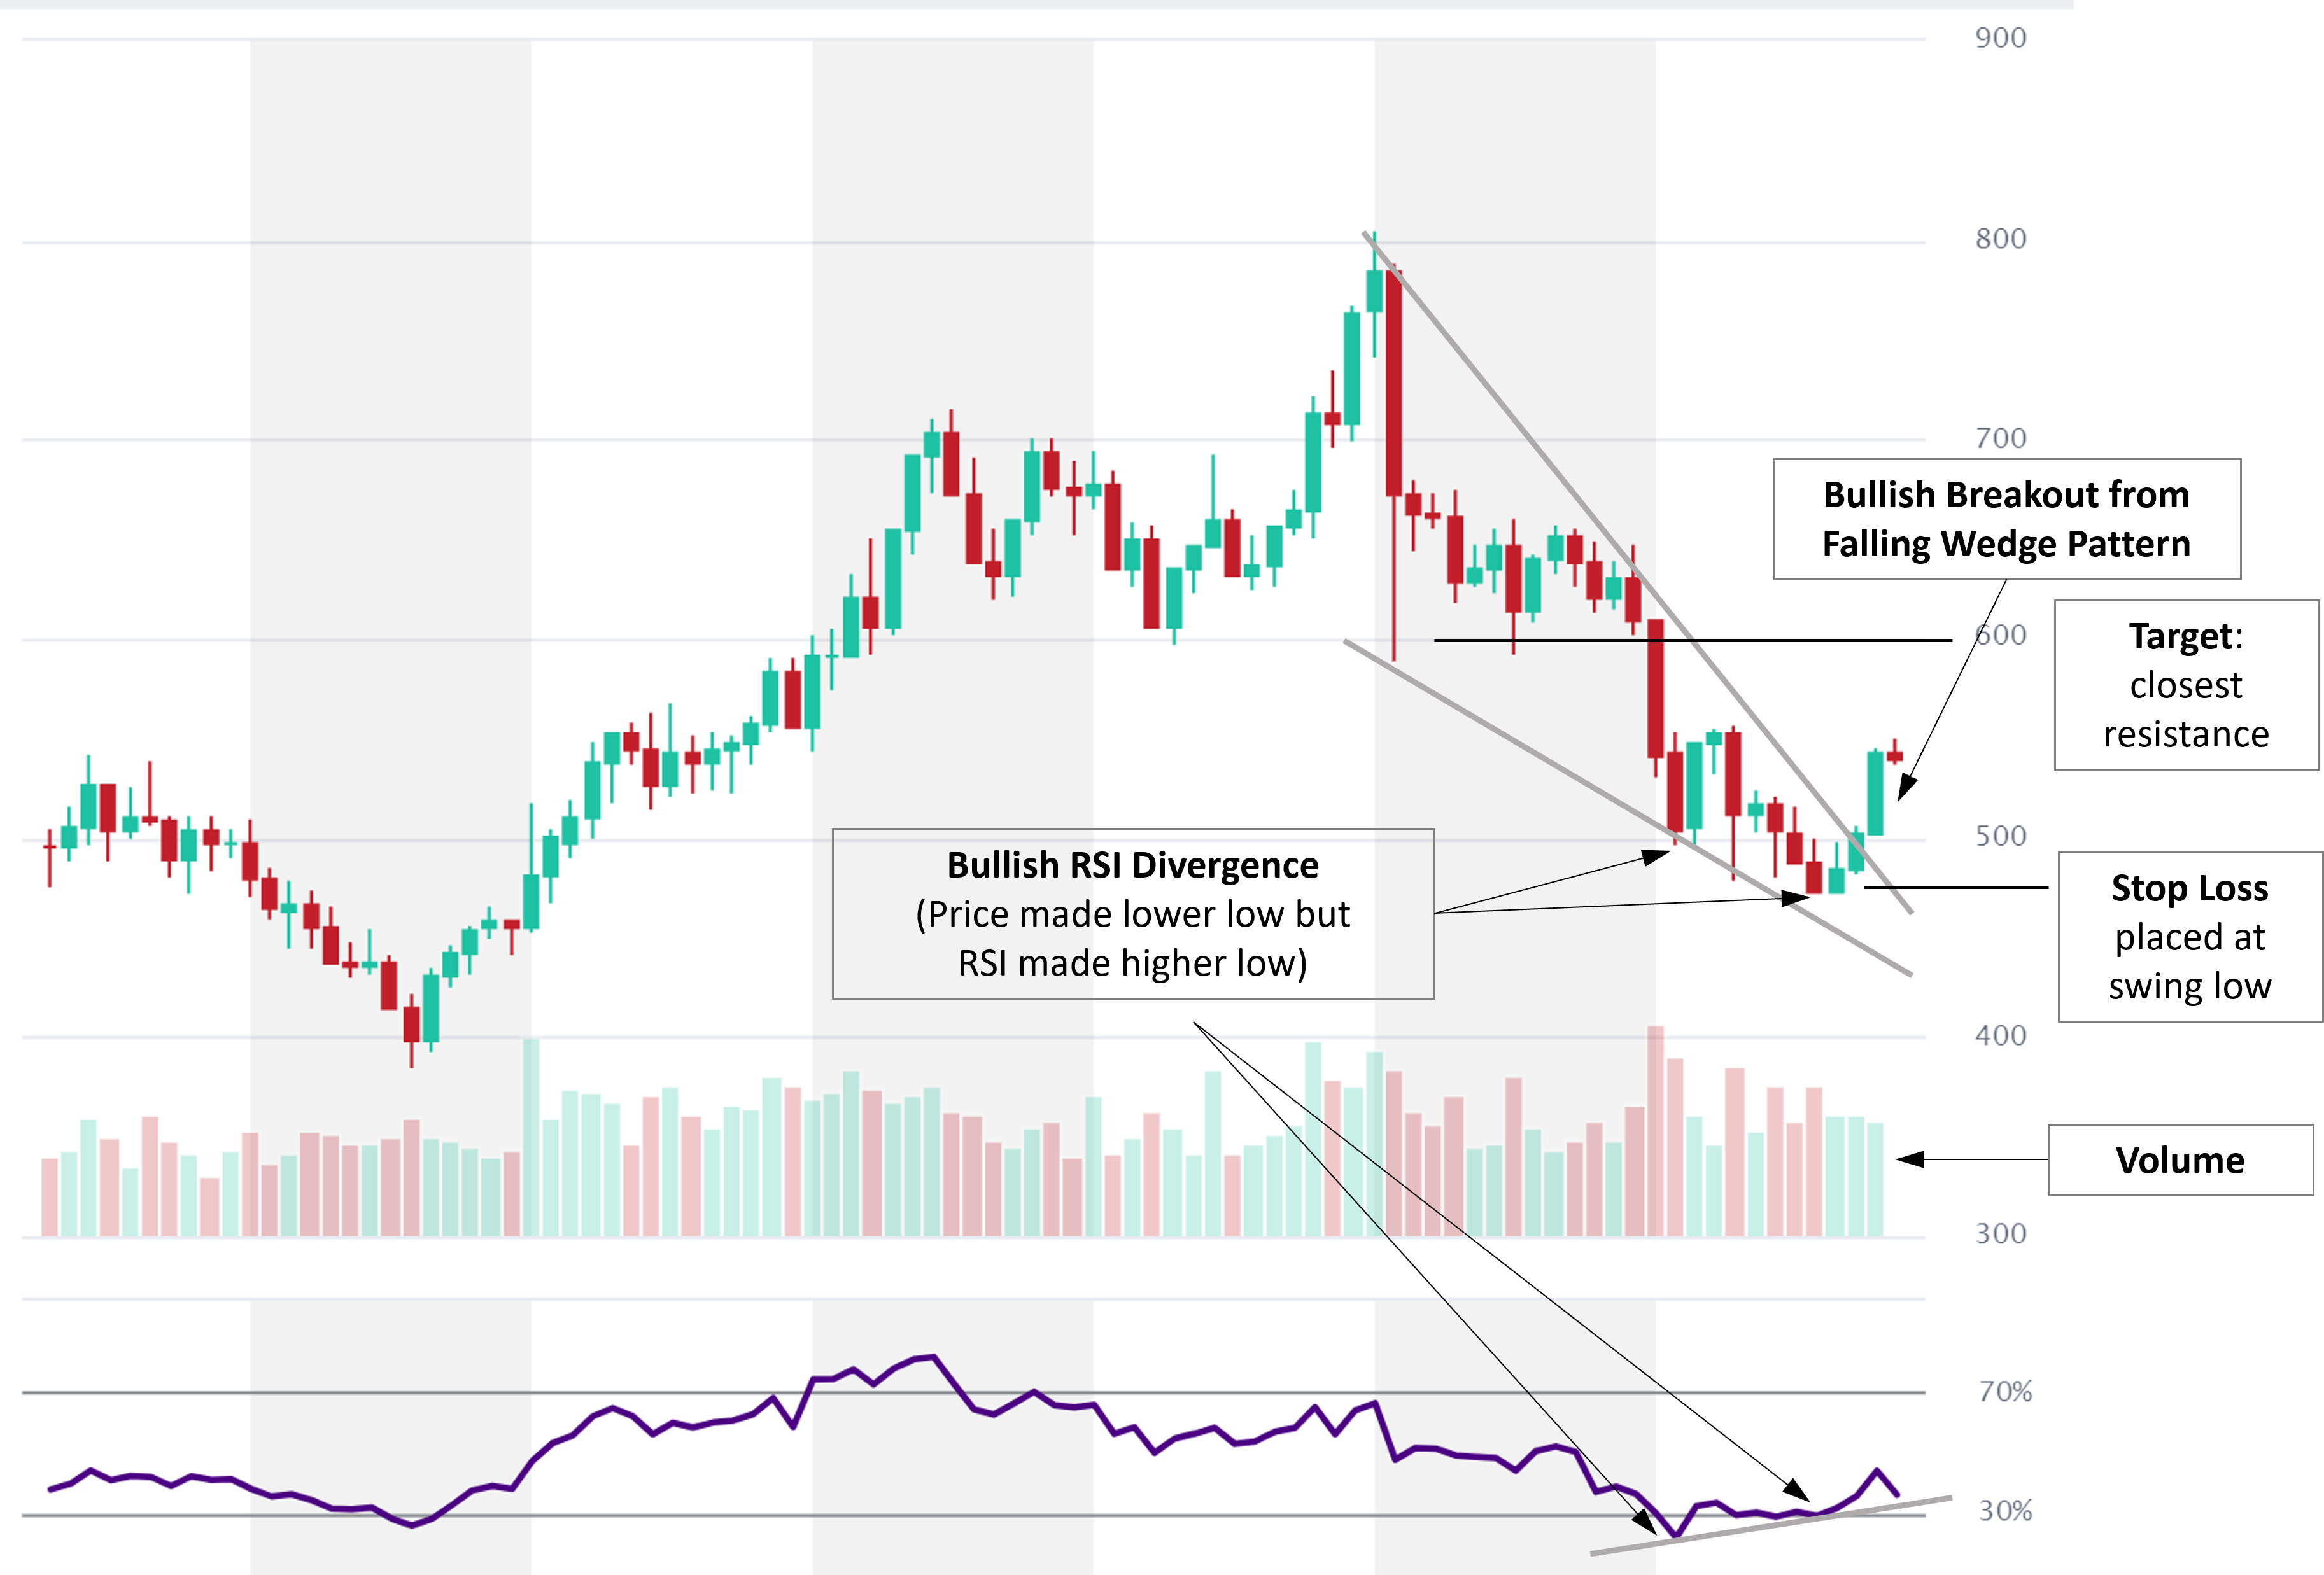
Reading RSI Divergence Indicator Can Also Be Used As a Confirmation of a Breakout!
Here’s an example of how Bullish RSI Divergence preceded a bullish breakout from Falling Wedge pattern. Together, these two signals create a strong case:
What other Candlestick Patterns or Indicators could be used to Strengthen the RSI Divergence Signal?
Combining RSI divergence with other confirmation signals is a smart way to reduce false entries and increase confidence. Here’s a short list of top candlestick patterns and indicators that work well with RSI divergence:
✅ Top Candlestick Patterns for Confirmation
Pattern Signal Type Why It Helps:
- Bullish Engulfing Bullish Strong reversal after a downtrend — confirms bullish divergence.
- Bearish Engulfing Bearish Strong reversal after an uptrend — confirms bearish divergence.
- Hammer / Inverted Hammer Bullish Shows buyer rejection at lows — good near bullish divergence.
- Shooting Star / Hanging Man Bearish Shows seller rejection at highs — useful for bearish divergence.
- Doji Indecision Can mark a turning point, especially with volume shift.
📊 Indicators That Strengthen Divergence Signals
Indicator Usage How It Helps:
- MACD Trend/momentum Confirm divergence if MACD shows cross or histogram shift.
- Volume Strength of move Look for volume increase during divergence resolution.
- Moving Averages (e.g. 50/200 EMA) Trend filter Only trade divergence in direction of major trend.
- Stochastic RSI Extra momentum filter If both RSI divergence & Stoch RSI show reversal → strong.
- Bollinger Bands Overextension Divergence near band extremes adds conviction.
- Support/Resistance Zones Context Divergence near key levels = more likely reversal.
- Chart Patterns (e.g. wedge, triangle) Structure Breakout + divergence = powerful combo (e.g., falling wedge + bullish divergence).
🔁 Example Combo (Real Use):
Bullish Setup:
- Price makes lower low
- RSI makes higher low (bullish divergence)
- At horizontal support level
- Hammer candle appears
- Volume increases on breakout
✅ = High-confidence entry
How To Find RSI Divergence and Trading RSI on altFINS
Crypto traders on altFINS can easily filter over 3,000 cryptocurrencies to find RSI oversold or overbought situations by checking our Signal Summary page or Pre-set filters on altFINS Crypto Screener. Alternatively, traders can also build their own custom filter using altFINS Screener. Or select bullish or bearish RSI Divergence in Trade Setups. See how to use our Screener here.
You can also ask altFINS AI Copilot
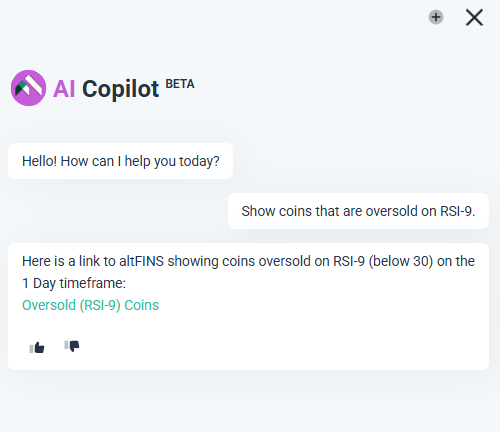
Ask AI Copilot to have fresh data
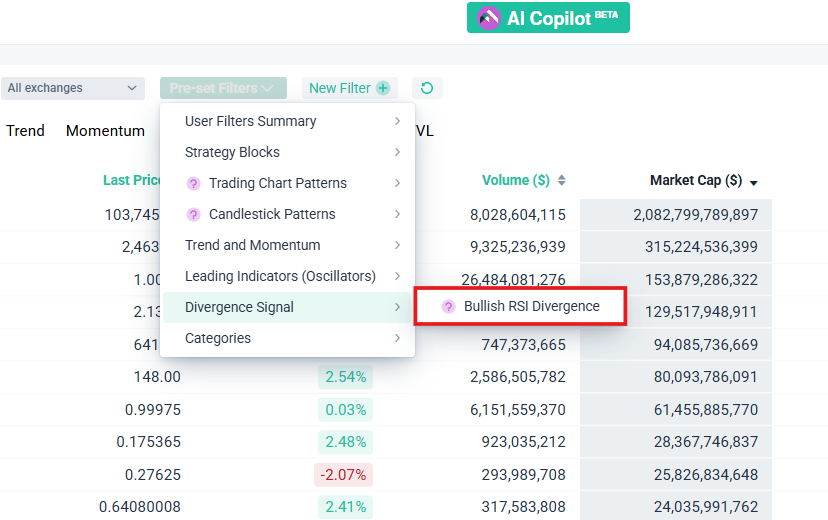
Quickly Scan For RSI RSI Divergence and Trading RSI on altFINS Crypto Screener
Bullish RSI Divergence in Pre-set Filters`
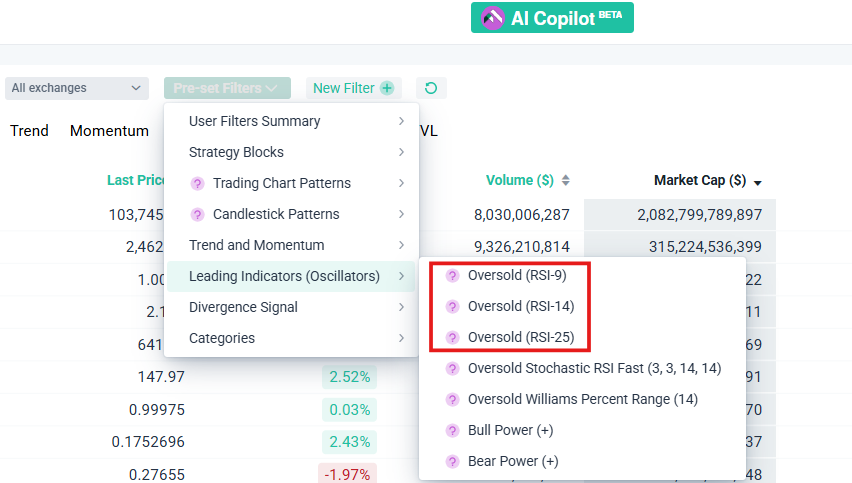
Trading RSI in Pre-set Filters
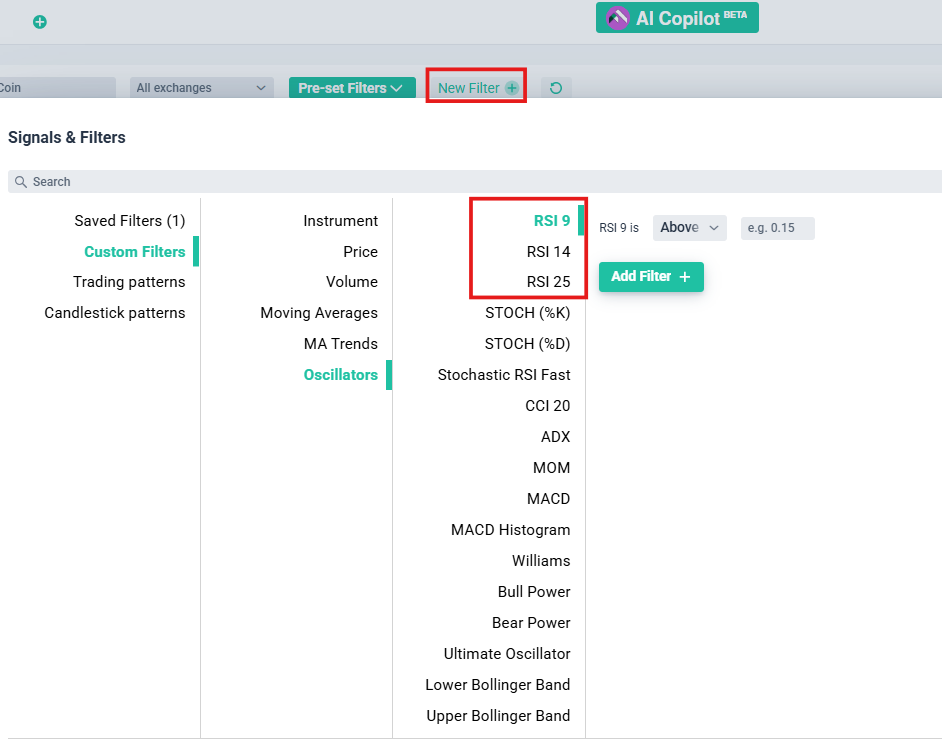
Create a Custom filter on Crypto Screener
Go to Signals Summary and Find Bullish and Bearish Coins with RSI Divergence or Trading RSI
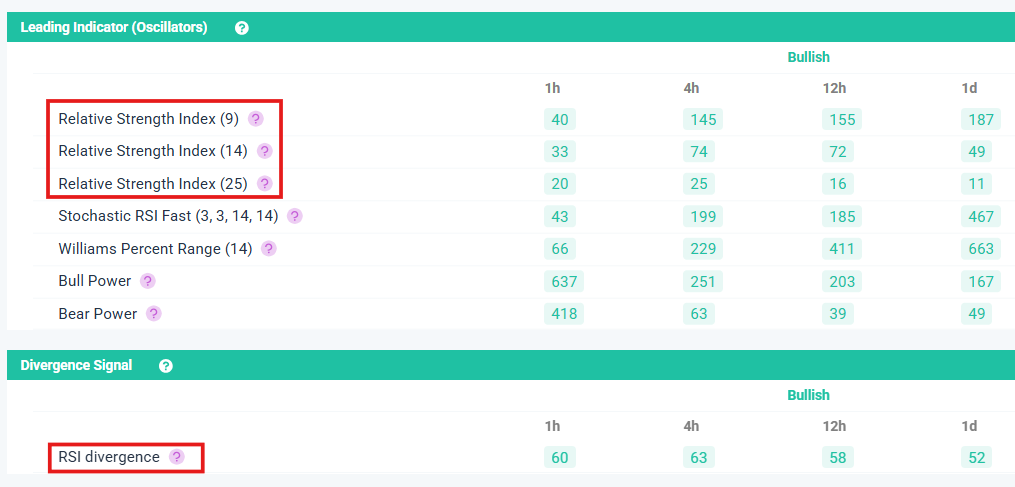
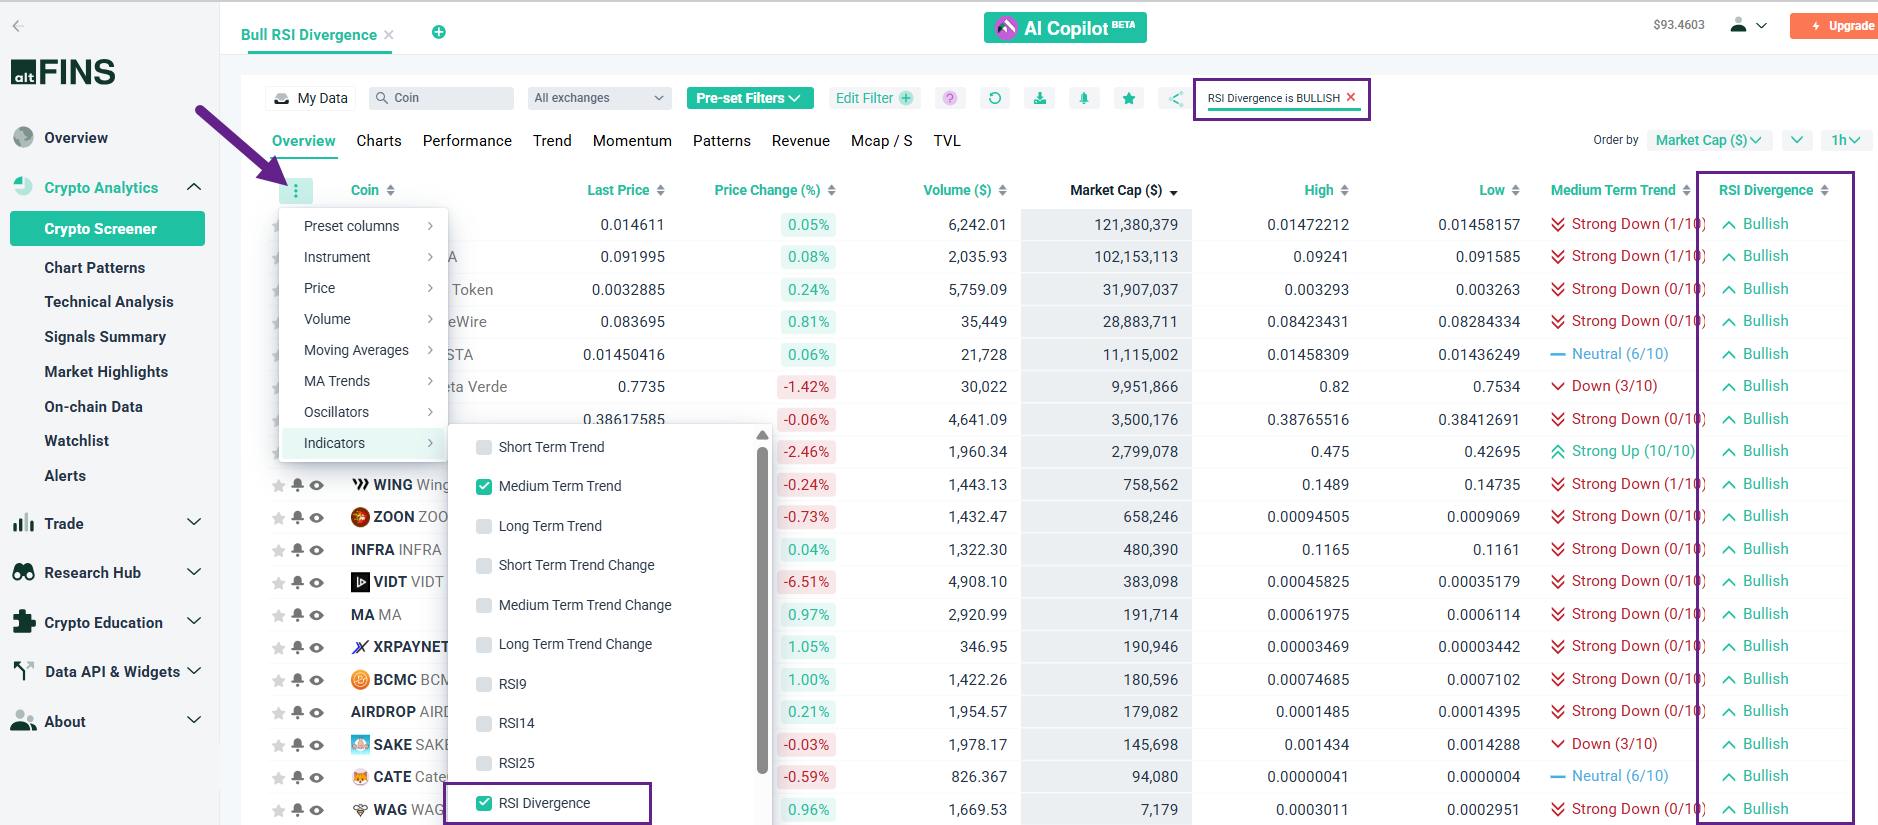
And after running the Pre-set Filter, you can add the RSI Divergence indicators to the Screener.
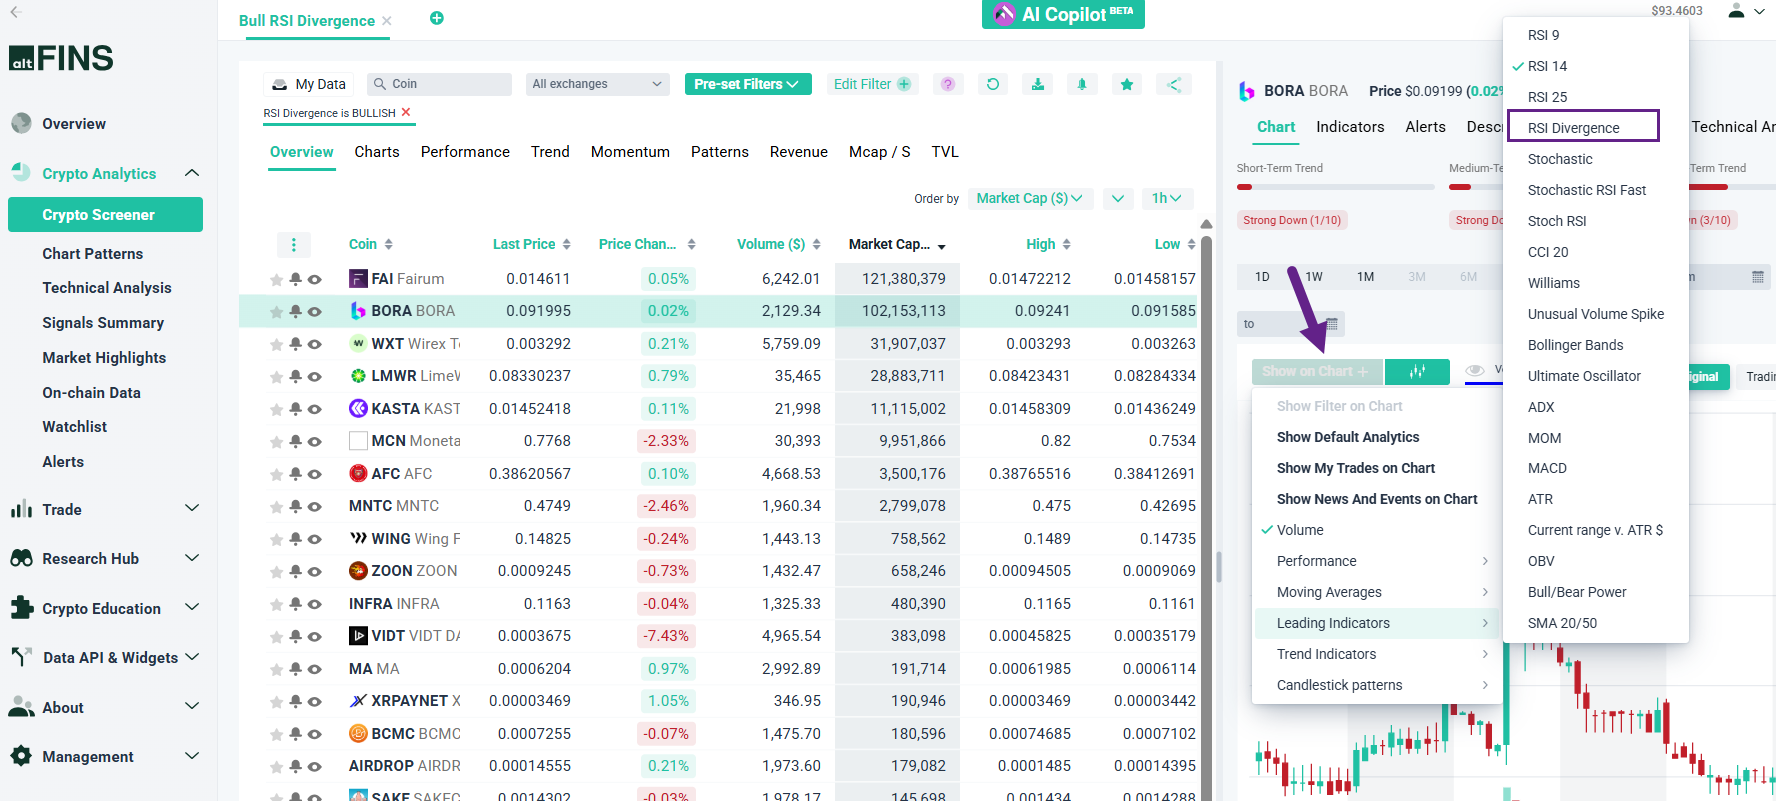
Aldo add RSI Divergence to the charts. Open Detail View for a selected coin. Add RSI (14-period). Draw trendlines on price and RSI to confirm divergence visually.
Select RSI Divergence on Trade Setups Section
Identify Divergence Patterns:
🔹 Bullish Divergence: Price makes a lower low, RSI makes a higher low.
🔹 Bearish Divergence: Price makes a higher high, RSI makes a lower high.
Summary
1. Use altFINS tools to find divergence.
2. Confirm visually on the chart.
3. Combine with other technical signals.
4. Apply strong risk management.
