Using Bullish RSI Divergence to Confirm a Breakout
Yesterday, we saw several bullish breakouts from Falling Wedge and Down Channel patterns (see blog).
Today we’ll show you how to confirm such breakouts, meaning, what other indicators can increase our confidence level. Still no guarantee that it won’t be a breakout failure, but tilts the odds in your favor.
To confirm a breakout from Falling Wedge, traders can look for:
1) Increased volume (buyers stepping up big)
2) Bullish RSI Divergence
The former is obvious. Typically, breakouts that occur with increased volume have greater level of conviction.
The latter probably needs some explaining. RSI Divergence happens when price and RSI indicator move in opposite direction. It happens occasionally and when it does, it’s a good time to pay attention. Now, by itself, RSI Divergence is not signal to follow, usually, but when it occurs in conjuction with a breakout, it can validate it, strengthening the conviction. It adds weight to the evidence.
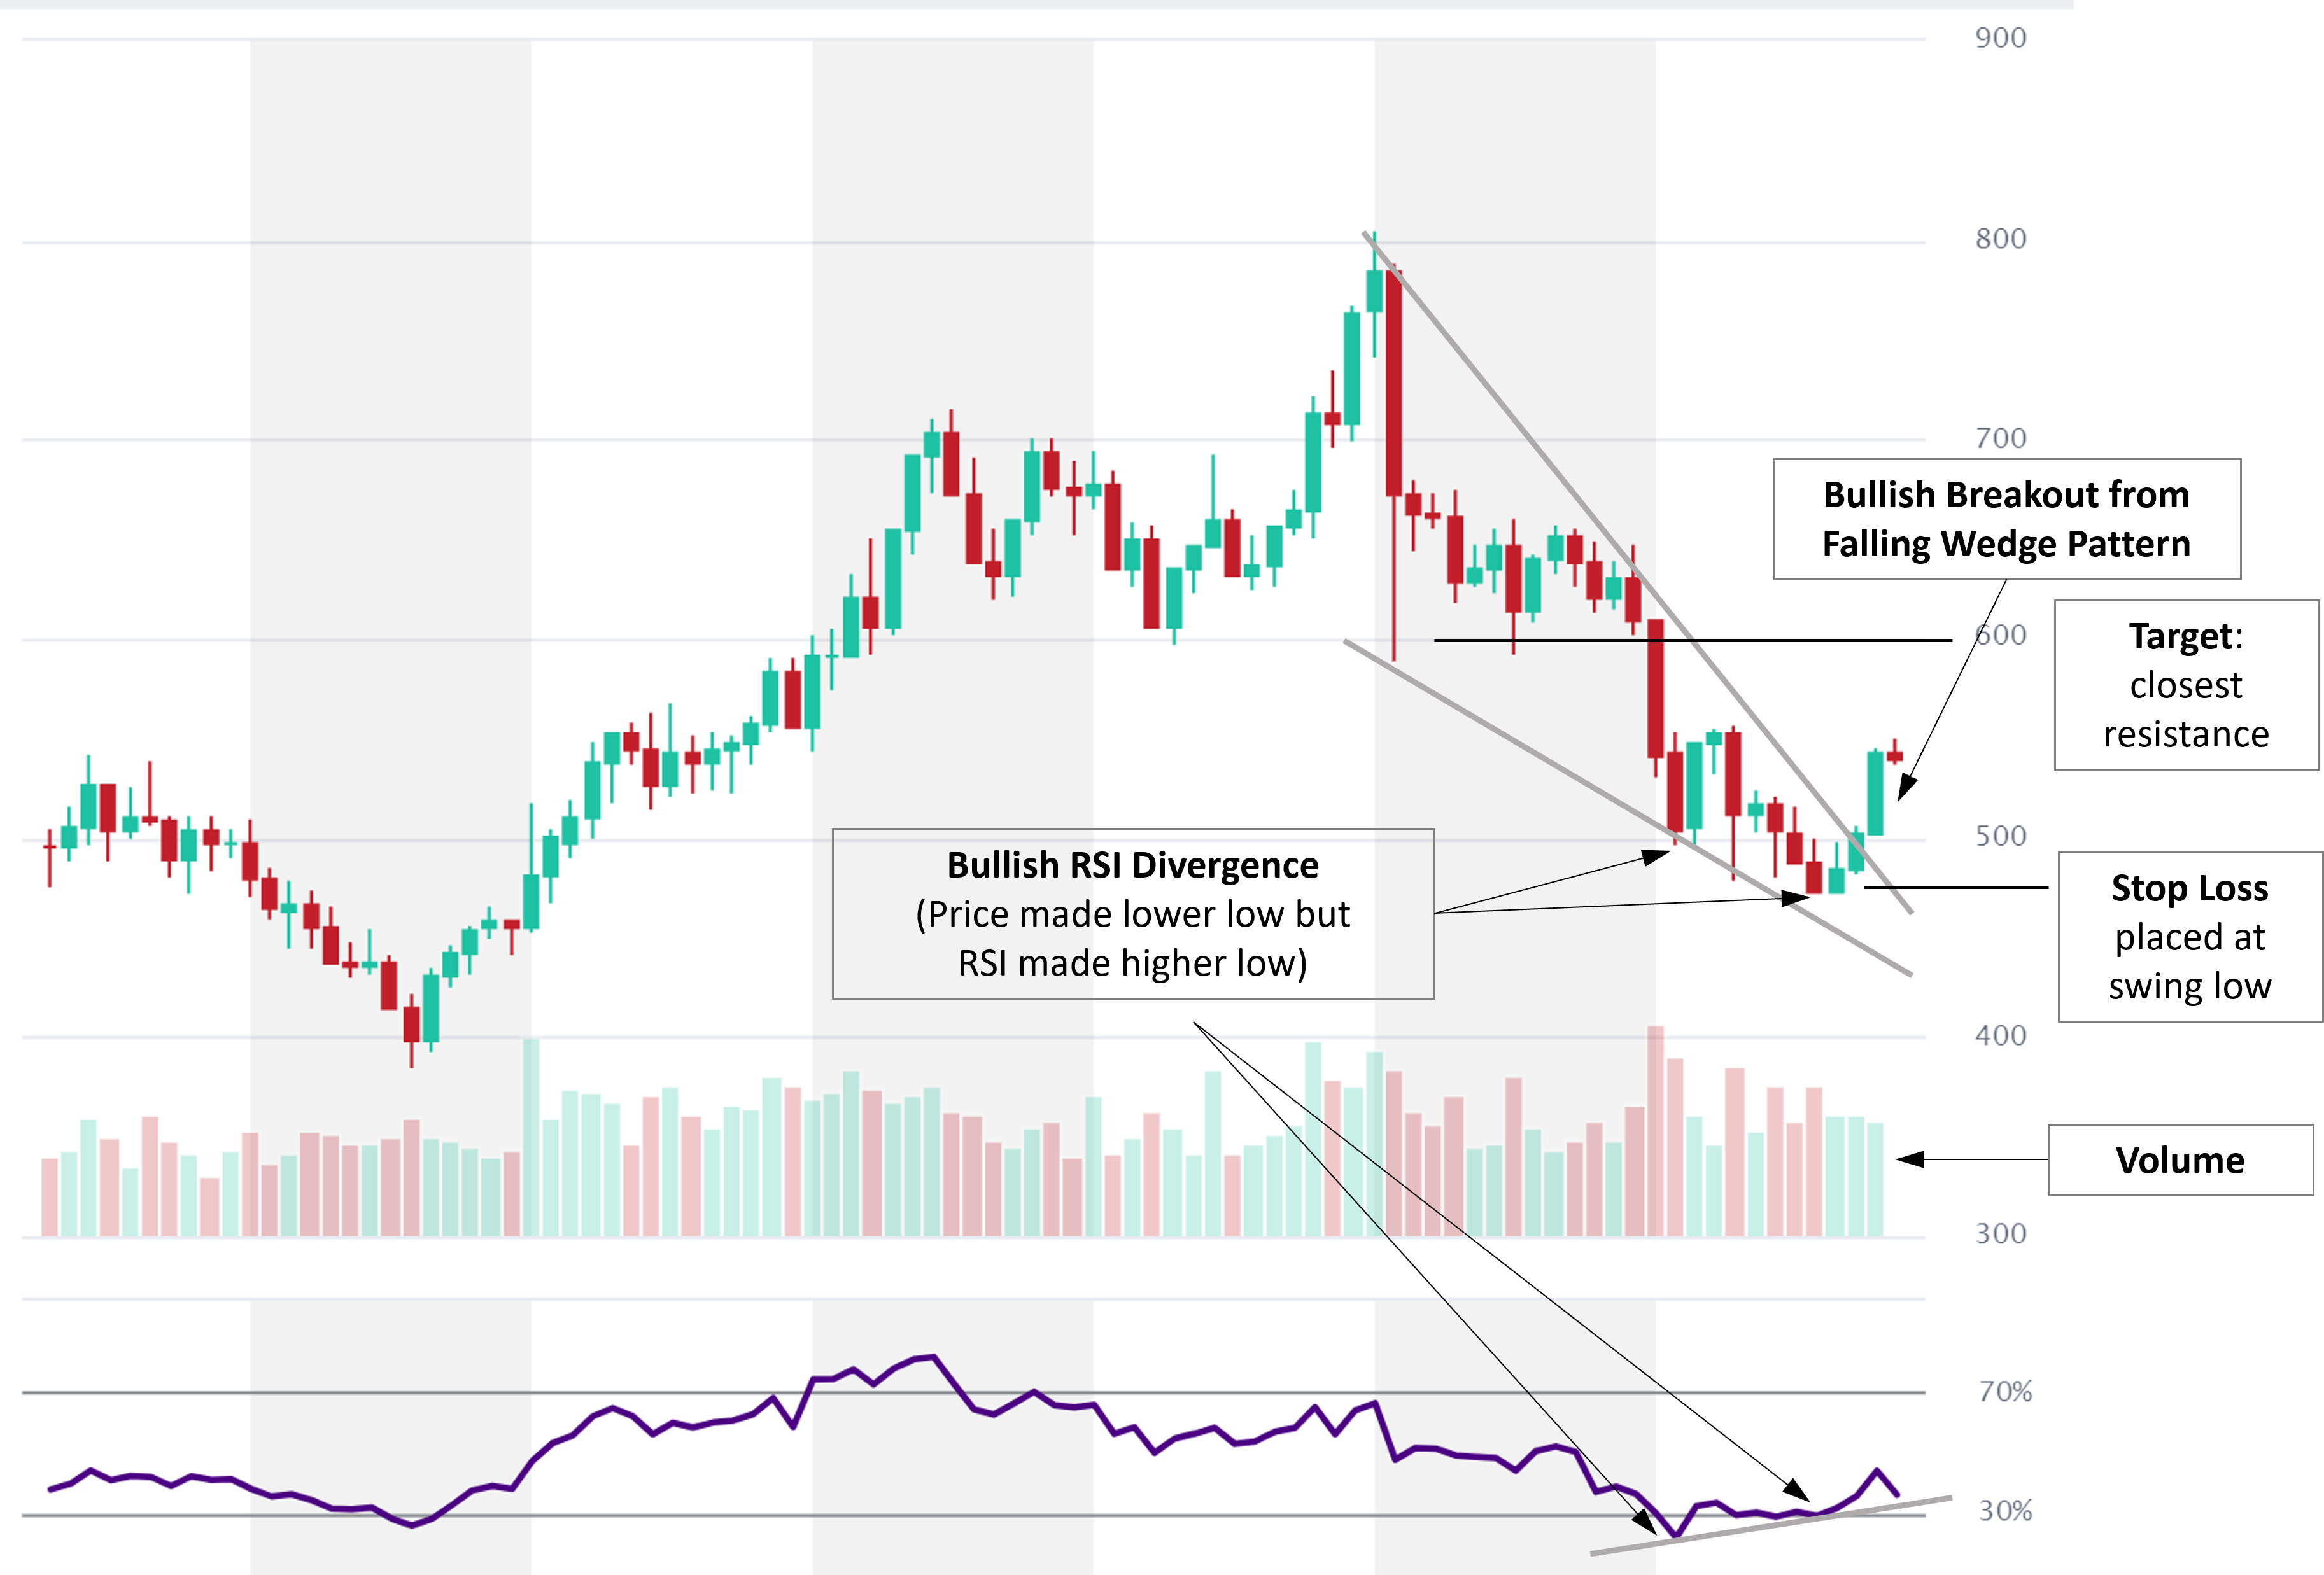
Bullish RSI Divergence occurs when Price makes a lower low but RSI makes a higher low. One goes down, the other goes up! It shows that sellers are easing up.
Let’s look at an example: Bitcoin Cash (BCH)
Price was in a downtrend but the swing lows have been flatlining recently, indicating seller exhaustion, which formed a Falling Wedge, which can often result in a bullish reversal. Yesterday, price broke out of the pattern, to the upside.
The volume was average, not convincing. But preceding the breakout was a bullish RSI Divergence as price made a lower low but RSI made a higher low (see chart). This signal alone was not actionable but when followed by a bullish breakout from Falling Wedge, it gives it further credence.
Find more examples in our Curated Charts section.
TRADING EDUCATION WEBINARS: If you’re interested in learning the basics of technical analysis and how to apply it using altFINS platform, check out our upcoming series of education webinars.
Falling Wedge pattern typically resolves in a bullish breakout. The pattern can appear in an Uptrend or Downtrend, the latter is our case. See Pattern Cheat sheet for more info.
The way to trade it, like with most patterns, is to wait for a breakout. Read more in our knowledge base.
You can find Falling Wedge patterns in our Curated Charts but also in the Patterns section.
Quick tip: search Patterns for Breakouts from Inverse Head and Shoulders, Resistance, Ascending Triangles, Channels and Wedges, which are patterns with the highest success rates.