THETA: Bullish Triangle Breakout!
THETA: Bullish Triangle Breakout!
Our analysts have identified a potential upside opportunity for THETA.
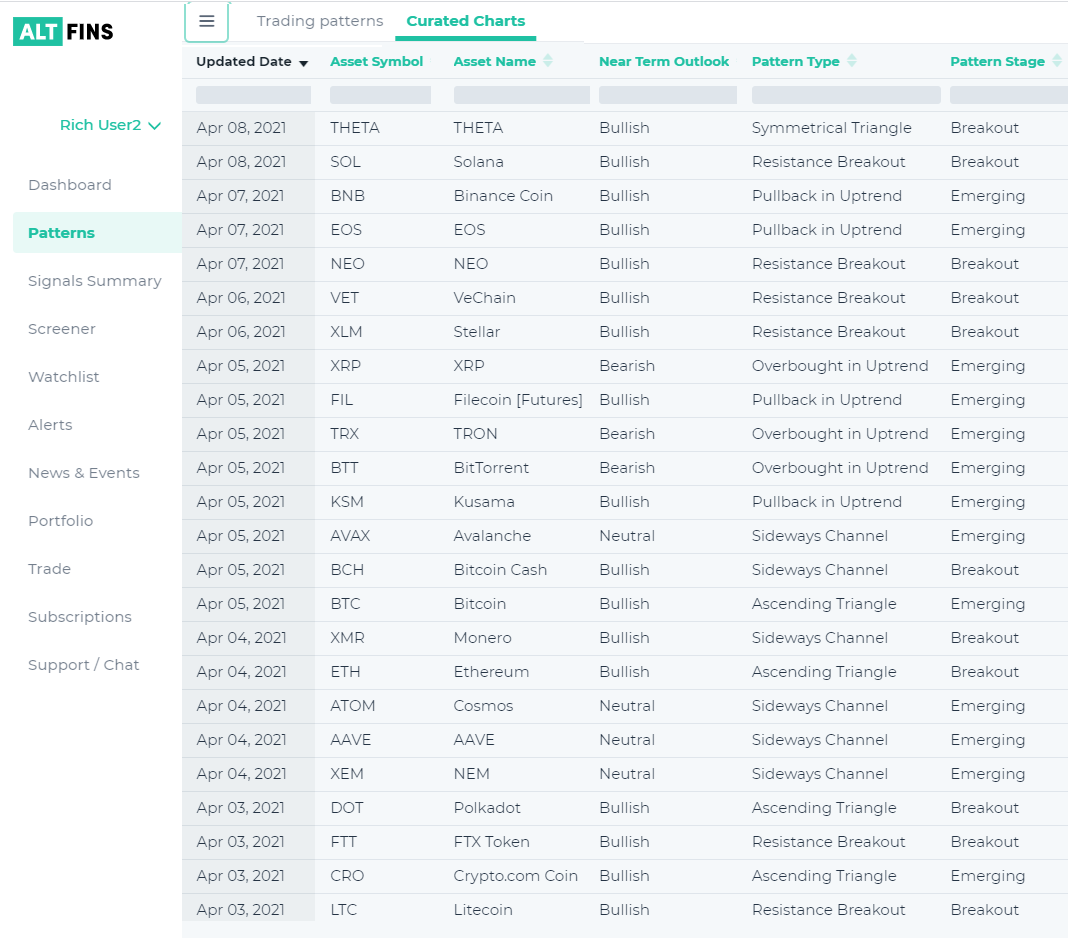
Find this and other fresh trading ideas in our Curated Charts section for top 30 altcoins including ETH, ADA, SOL, BNB, EOS, NEO, XLM, XEM, VET, ATOM, DOT, DOGE and others.<
Curated Charts are done by inhouse analysts using basic TA principles outlined here. Follow their work and learn TA yourself!
THETA Technical Analysis:
Trade setup: Trend Traders get another chance at an Uptrend during a pullback). Following a major move from $8 to $15, RSI reached extreme overbought levels (RSI ~ 90) and that is usually followed by some consolidation.
THETA consolidated briefly in a Symmetrical Triangle, which is a neutral pattern, suggesting indecision in the market. Although it could break either up or down, it usually breaks in the direction of the prevailing trend (i.e. continuation not reversal). It appears to have done just that (bullish breakout).
The upside from a breakout would be about $5 (width of the triangle’s base) to $17.50 level (+40%).
Also, MACD Histogram has likely reached a trough, which could signal another upswing in momentum is in the wings.
Trend: is in a Strong Uptrend across all time horizons (Short-, Medium- and Long-Term). This textbook uptrend is characterized by a series of Higher Highs and Higher Lows.
Momentum: is bearish (MACD Line is below MACD Signal Line) although RSI is still above 50 (bullish). However, MACD Histogram appears to have troughed, which signals momentum could swing back up again.
OBV (On Balance Volume): is rising, indicating that volume on Up days exceeds volume on Down days. Hence, demand (buyers) is greater than supply (sellers).
Support and Resistance: Nearest Support Zone is around $12.50, then $10.00, and the nearest Resistance is at $15.00 (ATH).
Other altcoins analyzed in our Curated Charts section include:
Check our unique automated chart pattern recognition for fresh trading ideas. Also, during market corrections, it’s always good to revisit coins in an Uptrend but with a pullback. Our Signals Summary has this and other pre-defined filters ready for action.
Download altFINS Mobile App
Follow us on:
✅ Telegram: https://t.me/altfinsofficialchat
✅ Twitter: https://twitter.com/AltfinsA
✅ Discord: https://t.co/uBvlTWgRgP
✅ Facebook: https://www.facebook.com/altFINS
✅ YouTube: https://t.co/QCvKBODSKH
✅ Reddit: https://www.reddit.com/user/altFINS_official
✅ Instagram: https://www.instagram.com/altfins_altcoins/
✅ LinkedIn: https://www.linkedin.com/company/altfins
Disclaimer: This content is for informational purposes only, you should not construe any such information or other material as investment, financial, or other advice. There are risks associated with investing in cryptocurrencies. Loss of principal is possible.