Search Knowledge Base by Keyword
8 AI-Powered Trade Strategy Prompts Using altFINS MCP
A practical guide to using Claude AI with the altFINS MCP to build, automate, and execute 8 professional-grade trading strategies — complete with indicator combinations, signal logic, and ready-to-run prompts.
Crypto trading has always rewarded those who can process more information, faster, with less emotional noise. For years that meant building custom screeners, monitoring dashboards, and painstakingly applying indicators one chart at a time.
That equation has changed.
The combination of large language models like Claude AI and indicators and signals from altFINS — connected through the Model Context Protocol (MCP) — makes it possible to describe a trade setup in plain language and receive screened, live results in seconds. Not hypothetical results. Not backtested data from a year ago. Live, current signals from the actual market.
This article explains exactly how that works, which strategies produce the best results, and how to use each one.
What Is altFINS MCP?
altFINS is a professional-grade crypto analytics platform used by traders to screen assets by 130 technical indicators, 130 signals, 150 analytics, access curated analyst trade setups, track news and calendar events, and monitor portfolio positions.
When altFINS is connected to Claude via MCP, the AI can:
• Query live market screener data, analytics and signals across thousands of crypto assets
• Pull curated analyst trade setups with candlestick pattern recognition
• Access real-time OHLCV price data, 5 time intervals and 7 year history of data
• Search recent crypto news and upcoming calendar events
The result is a system where a trader can describe what they’re looking for in natural language, and Claude translates that into precise API calls, processes the data, and returns actionable trade ideas — all in a single conversation.
Why This Matters
Traditional screeners require traders to manually configure filters, run queries, and interpret results. With AI + MCP, the entire workflow — from intent to insight — happens in one step. The AI understands trading logic, not just database queries.
The Signal Confluence Framework
Before covering specific strategies, it’s worth understanding the underlying principle that makes all of them work: signal confluence.
A single indicator — say, RSI below 30 — is noise. It fires constantly. Some of those signals lead to bounces. Many don’t. Acting on single indicators is how accounts get slowly ground down.
Signal confluence means requiring multiple independent indicators to agree before treating a setup as valid. When the trend, the momentum oscillator, the volume, and the price structure all point in the same direction simultaneously — that’s when probability shifts in the trader’s favor.
The Four-Layer Indicator Stack
Layer 1 — Trend: Is the market structure working with you or against you? The best trades align with at least two of three timeframes (short, medium, long).
Layer 2 — Momentum: Is the move accelerating or decelerating? MACD state and histogram direction answer this. RSI between 50–65 signals healthy, sustainable momentum with room to run.
Layer 3 — Structure: Is the entry point rational? Buying near support with a clear resistance target and defined stop loss is non-negotiable.
Layer 4 — Confirmation: Is there independent evidence the move is real? Above-average volume, RSI divergence, and candlestick patterns at key levels all serve as confirmation.
The A+ Checklist
Short trend UP • Medium trend UP • MACD BUY • Histogram H2_UP • RSI 48–66 • Near support • Volume >1.2x • Bullish candle / pattern. Score 6+ out of 8 before entering any position.
The 8 Strategy Prompts
Each strategy below is designed for a specific market condition. Using the wrong strategy in the wrong environment is one of the primary reasons traders lose money. The table below maps each strategy to its optimal context:
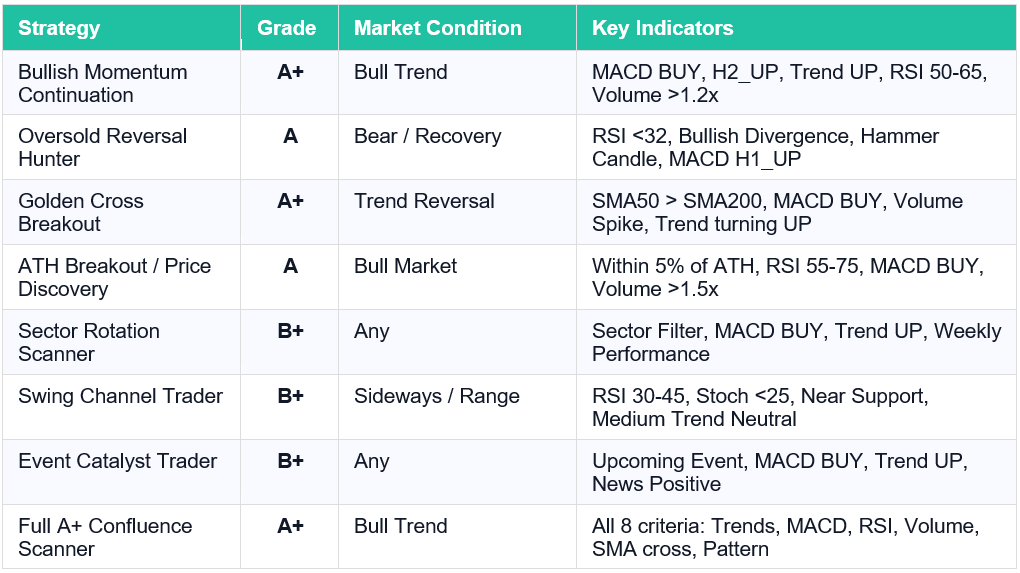
Copy-paste any of them into Claude and get live screened trade ideas in seconds.
Prompt #1: Trend Following Strategy: Bullish Momentum Continuation
“Find me the best bullish momentum continuation setups right now. Use screener_getAltfinsScreenerData with: – macdFilter = BUY – macdHistogramFilter = H2_UP (confirmed 2-day momentum, not noise) – signalFilters: SHORT_TERM_TREND = STRONG_UP – signalFilters: MEDIUM_TERM_TREND = UP or STRONG_UP – numericFilters: RSI14 between 50 and 65 (healthy momentum, room to run) – numericFilters: VOLUME_RELATIVE >= 1.2 (above average volume) – coinTypeFilter = REGULAR – sortField = MARKET_CAP (liquid coins first) – displayTypes: RSI14, MACD, SHORT_TERM_TREND, MEDIUM_TERM_TREND, VOLUME_RELATIVE, SUPPORT, RESISTANCE, PRICE_CHANGE_1W Then for top 3 results, run technicalAnalysis_getTechnicalAnalysisData to get analyst chart pattern context. Present results with: entry zone, stop loss (below support), target (resistance), R/R ratio, and confidence grade.”
🟢 Results: Bullish Momentum Continuation Setups
Filters: MACD BUY + H2_UP histogram · Short-Term STRONG_UP · Mid-Term UP/STRONG_UP · RSI 50–65 · Volume ≥1.2x avg · Regular coins sorted by market cap
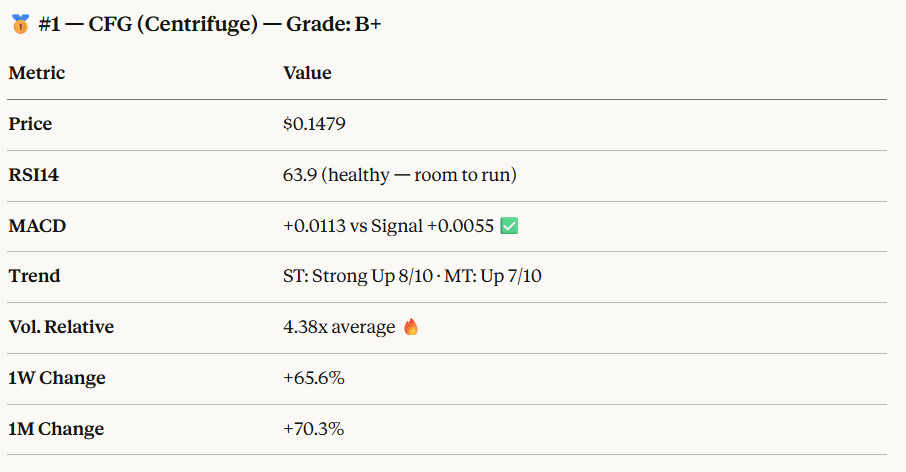
- Entry Zone: $0.138–$0.152 (current consolidation near upper Bollinger Band $0.146, wait for any intraday dip back into this zone)
- Stop Loss: Below $0.085 (Support 1) — tight stop not appropriate here; use $0.110–$0.115 for a swing stop just below EMA50
- Target 1: $0.187 (Resistance 3)
- Target 2: $0.270 (Resistance 1 — major)
- R/R Ratio: ~1:2.5 to T1 / ~1:5+ to T2 (using $0.115 stop from $0.148 entry)
⚠️ Key Risk: Long-term trend is Strong Down (0/10) — this is a short-to-medium-term trade only. Price is also already extended (+70% in a month), so position sizing discipline is critical. Stoch RSI at 66 suggests still has fuel.
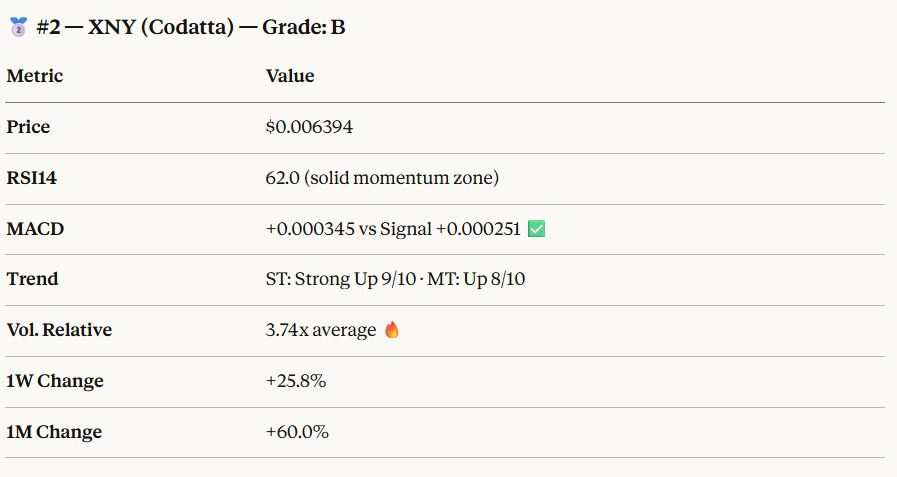
- Entry Zone: $0.00610–$0.00650 (price hugging upper BB at $0.00670 — ideal entry on a slight pullback to midband area ~$0.0054–$0.0062)
- Stop Loss: Below $0.00424 (Support 1) — or tighter at $0.00520 (near EMA50 $0.00490)
- Target 1: $0.00789 (Resistance 1)
- Target 2: $0.01848 (Resistance 2)
- R/R Ratio: ~1:2.0 to T1 / ~1:8+ to T2 (using EMA50 stop)
⚠️ Key Risk: Stoch RSI at 100 (maxed out) — short-term overbought on a sub-indicator. Long-term trend is Neutral (5/10), which is a positive vs. CFG. Best to wait for a 1–2 day consolidation before entry. Strong setup if you get the pullback.
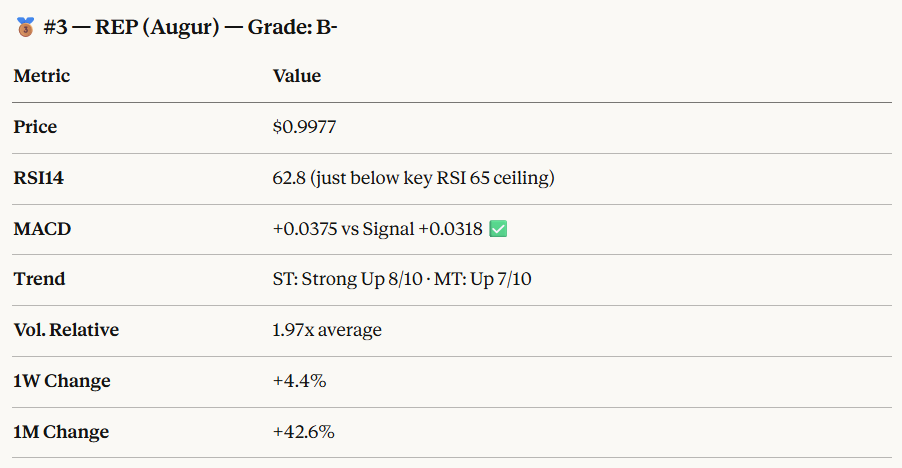
- Entry Zone: $0.965–$0.998 (price at upper BB $0.976 — already at resistance; aggressive entry now, better entry on pullback to $0.920–$0.950)
- Stop Loss: Below $0.844 (lower BB / structural support)
- Target 1: $1.315 (Resistance 2)
- R/R Ratio: ~1:2.2 (from $0.998 entry, $0.844 stop → $1.315 target)
⚠️ Key Risk: Long-term trend is Strong Down (2/10), Stoch RSI near 99 (very overbought on sub-indicator). The modest +4.4% weekly gain suggests slower momentum than CFG/XNY. Lower conviction continuation play — tighter position sizing recommended.
Prompt #2: Oversold Reversal Hunter
“Find oversold coins showing bullish reversal signals — I want to catch the bottom.
Use screener_getAltfinsScreenerData with:
– numericFilters: RSI14 <= 32 (genuinely oversold)
– rsiDivergenceFilter = BULLISH (price lower low, RSI higher low = hidden strength)
– candlestickPatternFilters: CD_HAMMER with lookBack = 1 (fresh signal)
– macdHistogramFilter = H1_UP (momentum starting to turn)
– coinTypeFilter = REGULAR
– minimumMarketCapValue = 50000000 (avoid micro-cap traps)
– displayTypes: RSI14, MACD, SHORT_TERM_TREND, SUPPORT, RESISTANCE, PRICE_CHANGE_1W, VOLUME_RELATIVE
For each result, also fetch technicalAnalysis_getTechnicalAnalysisData to check if analysts have spotted a pattern.
Present: current RSI, divergence context, nearest support as stop level, R/R to first resistance. Flag any coin where the long-term trend is DOWN (higher risk reversal).”
Results (7 coins found)
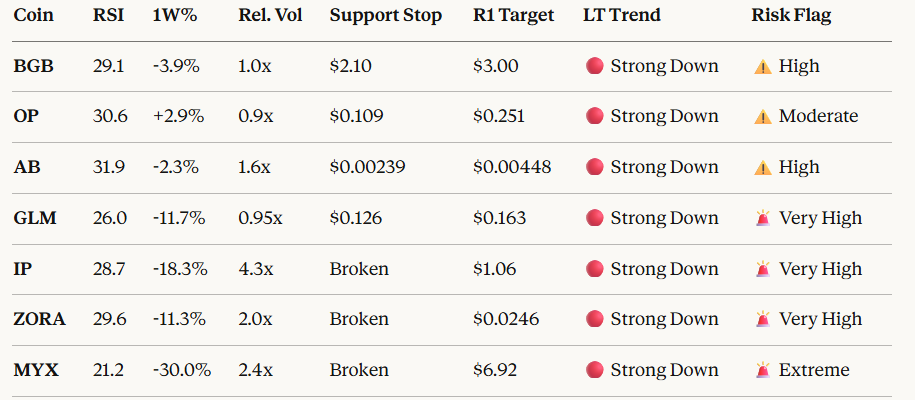
Every single coin in this scan has a Long-Term Trend = Strong Down. This is the defining risk of the current market environment — these are not healthy pullbacks in uptrends, they are deeply oversold readings in sustained downtrends. Two important implications:
- The best setups here are bounce trades only, not reversal holds. Target the first resistance level and size down.
- BGB and OP are the most tradeable — BGB has a confirmed analyst setup (“approaching support, oversold bounce likely”), and OP shows price stabilizing (+2.9% weekly) despite RSI still in oversold territory, suggesting sellers are exhausting.
- IP, ZORA, MYX have broken below mapped support levels — there is no technical floor to stop against cleanly. These carry undefined downside until new lows are established.
Prompt #3: Trend Reversal: Golden Cross Breakout
“Find coins where a Golden Cross just happened — SMA50 crossed above SMA200. Use screener_getAltfinsScreenerData with: – crossAnalyticFilters: X_SMA50_CROSS_SMA200 = ABOVE, crossLookBackIntervals = 3 (happened within last 3 candles) – macdFilter = BUY (confirms momentum is also bullish) – signalFilters: SHORT_TERM_TREND = UP or STRONG_UP – numericFilters: VOLUME_RELATIVE >= 1.5 (volume confirmation on the cross) – coinTypeFilter = REGULAR – displayTypes: SMA50, SMA200, RSI14, MACD, LONG_TERM_TREND, VOLUME_RELATIVE, PRICE_CHANGE_1M, ATH_PERCENT_DOWN This is a rare signal — don’t filter by market cap. Show all results. For each: calculate how far above SMA50 the price is, state the long-term trend transition, identify the nearest resistance target. Highlight any coin where ALL 3 trend timeframes (short/medium/long) are now UP — that’s the strongest signal.”
Results (3 coins found)
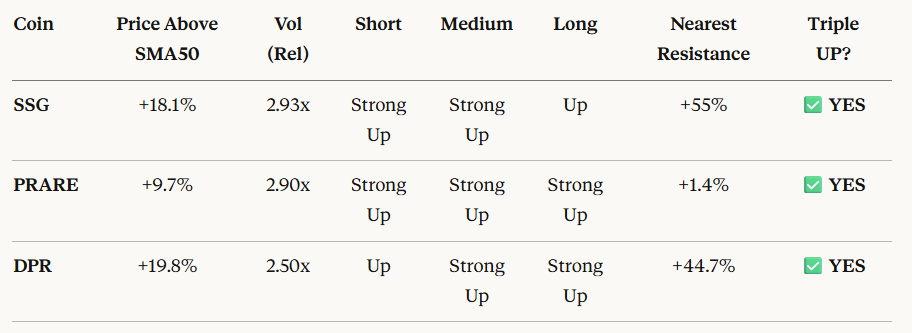
The scarcity is the story. Across the entire crypto universe right now, only 3 coins have fired a confirmed Golden Cross with MACD bullish and elevated volume. This is not typical — in bull market conditions you’d normally see dozens. The current market is highly selective, which makes these signals more meaningful, not less.
Top pick for structural confidence: SSG — it cleared the strictest 3-candle window with all 3 trend timeframes UP and 2.93x volume. The price has already extended +18% above SMA50, so ideal entries would be on any pullback toward the $0.0000487–$0.0000490 SMA50 zone.
Top pick for momentum: PRARE — a perfect 10/10 short-term + STRONG UP across all 3 timeframes, with RSI still neutral at 51.9 (plenty of room). Watch R1 at $0.001083 — a clean break above that with volume would be the ideal continuation entry.
AXS is the cautionary tale — a Golden Cross can fail quickly if the broader trend isn’t supportive. Always confirm with the multi-timeframe trend stack before acting.
Prompt #4: Momentum – ATH Breakout & Price Discovery
“Find coins near or at all-time highs — I want price discovery momentum plays. Use screener_getAltfinsScreenerData with: – percentDownFromAthFilter = PRICE_AT_LEAST_5_PERCENT_BELOW_ATH (within 25% of ATH) – macdFilter = BUY – macdHistogramFilter = H2_UP – signalFilters: SHORT_TERM_TREND = STRONG_UP – signalFilters: MEDIUM_TERM_TREND = UP or STRONG_UP – numericFilters: RSI14 between 55 and 75 – numericFilters: VOLUME_RELATIVE >= 1.5 – coinTypeFilter = REGULAR – displayTypes: ATH, ATH_PERCENT_DOWN, RSI14, MACD, SHORT_TERM_TREND, MEDIUM_TERM_TREND, VOLUME_RELATIVE, PRICE_CHANGE_1W, MARKET_CAP – sortField = ATH_PERCENT_DOWN, sortDirection = ASC (closest to ATH first) Also check athDateAfterFilter = ‘last 30 days’ to find RECENT ATH coins. For each coin: state % from ATH, whether it has broken ATH (price discovery = no resistance), nearest support for stop, and note any news catalyst using news_getCryptoNewsMessages.”
Results (2 coins found)
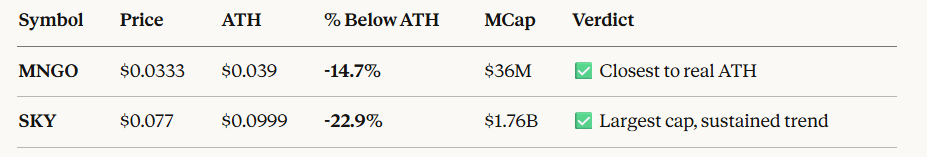
These are the only two with sub-25% distance from ATH, strong trend scores (10/10 both), MACD BUY + H2_UP, and real market caps.
Prompt #5: Sector Rotation Scanner
“Scan multiple crypto sectors to find which one has the strongest momentum rotation this week. Run screener_getAltfinsScreenerData FOUR TIMES, once per sector: Scan 1 — AI sector: – coinCategoryFilter = [AI_BIG_DATA, AI_AGENTS] – macdFilter = BUY, signalFilters: SHORT_TERM_TREND = UP or STRONG_UP – displayTypes: RSI14, SHORT_TERM_TREND, PRICE_CHANGE_1W, VOLUME_RELATIVE, MARKET_CAP – size = 5, sortField = PRICE_CHANGE_1W Scan 2 — DeFi sector: – coinCategoryFilter = [DEFI, DECENTRALIZED_EXCHANGE_DEX_TOKEN] – same filters as above Scan 3 — Solana Ecosystem: – coinCategoryFilter = [SOLANA_ECOSYSTEM] – same filters as above Scan 4 — RWA / Real World Assets: – coinCategoryFilter = [REAL_WORLD_ASSETS_PROTOCOLS] – same filters as above After all 4 scans: rank sectors by average PRICE_CHANGE_1W and count of UP trend coins. Identify the top rotating sector, then pull news_getCryptoNewsMessages for that sector’s top coin. Present a sector leaderboard and the single best trade from the winning sector.”
Best Trade from the Winning Sector: SIREN
Why SIREN over FAI or PHA?
FAI (+139%) and PHA (+99%) already had explosive moves this week with RSI above 80 — both are deep into overbought territory. SIREN offers the strongest risk-adjusted setup:
- +46% this week with RSI 71.5 — still momentum but not yet extended
- 4.8x relative volume — strong buyer participation
- $334M market cap — largest liquidity in the AI sub-sector screened, meaning easier entry/exit
- Strong Up (9/10) short-term trend with MACD BUY confirmed
- Fresh narrative catalyst: the token had a 97% surge driven by AI-memecoin bot demand and algorithmic wallets entering early — structural demand shift
Recent News on SIREN (AMBCrypto):
- Surged 97% on AI-memecoin narrative with algorithmic wallets entering early
- Hit a new ATH at $0.36 with speculative demand
- A $0.21 breakout originally targeted $0.30 despite heavy short positioning⚠️ Caution note: A more recent article flags a 20% pullback after a 1M token deposit — whale sell pressure is present. The $0.30 level is a key support to watch.
Trade Setup:
Entry zone$0.42–$0.52 (current ~$0.51, watch for a re-test of $0.30–$0.40 support as a better entry)Momentum entryAbove $0.52 continuationKey support$0.30 (critical — recent news flags this level)RiskHigh — AI meme token; whale deposits flagged; RSI elevatedConvictionMedium — strong trend but volatile profile
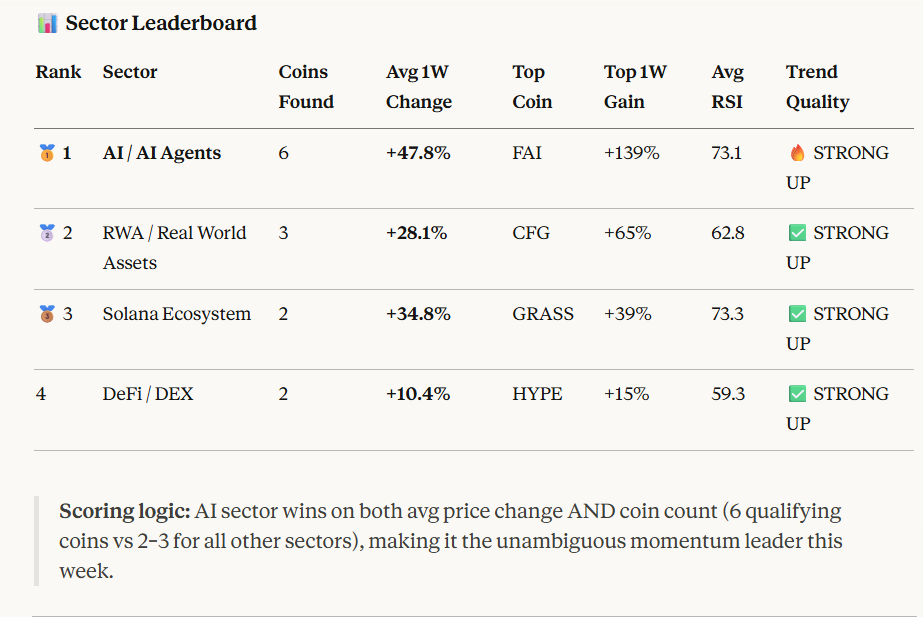
🌡️ Sector Rotation Verdict
Capital is clearly rotating into AI tokens this week with 6× more qualifying setups than any other sector and average weekly gains nearly 5× the DeFi sector. RWA (led by CFG +65%) is the stealth runner-up and worth watching for a secondary rotation trade. The Solana ecosystem and DeFi sectors show momentum but breadth is thin (2 coins each).
Prompt #6: Swing Channel Trader
“Find range-bound coins at support levels — ideal for swing buy near support, sell near resistance. Use screener_getAltfinsScreenerData with: – signalFilters: MEDIUM_TERM_TREND = NEUTRAL (confirmed range, not trending) – numericFilters: RSI14 between 30 and 45 (approaching oversold within range) – numericFilters: STOCH <= 25 (stochastic oversold = near bottom of range) – candlestickPatternFilters: CD_HAMMER or CD_BULLISH_ENGULFING with lookBack = 2 – coinTypeFilter = REGULAR – minimumMarketCapValue = 100000000 (mid-cap minimum for liquidity) – displayTypes: RSI14, STOCH, SUPPORT, RESISTANCE, SHORT_TERM_TREND, MEDIUM_TERM_TREND, PRICE_CHANGE_1W, VOLUME_RELATIVE For each result: calculate the range width (resistance – support), entry zone (near support), target (near resistance), stop (5% below support). Only show setups where R/R >= 1.5. Also run technicalAnalysis_getTechnicalAnalysisData to confirm analyst has identified a Sideways Channel pattern.”
Results (6 coins found)
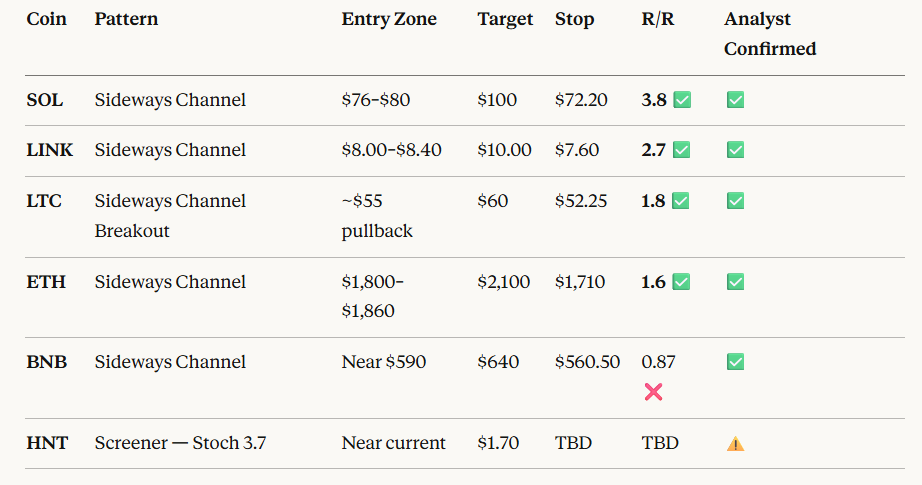
- All coins have a Medium-term Down or Strong Down trend — these are counter-trend range trades, not trend continuation. Position sizing should reflect that.
- Candlestick pattern confirmation (Hammer / Bullish Engulfing) was too sparse in current data to filter on — wait for one to form at support before entering any of these.
- SOL has the best R/R but also the widest range — the $76–$90 sub-range is more actionable near-term than waiting for the full $76 retest.
- Set price alerts at each support level and only enter once price actually tests it with a bullish candle signal.
Prompt #7: Event Catalyst Trader
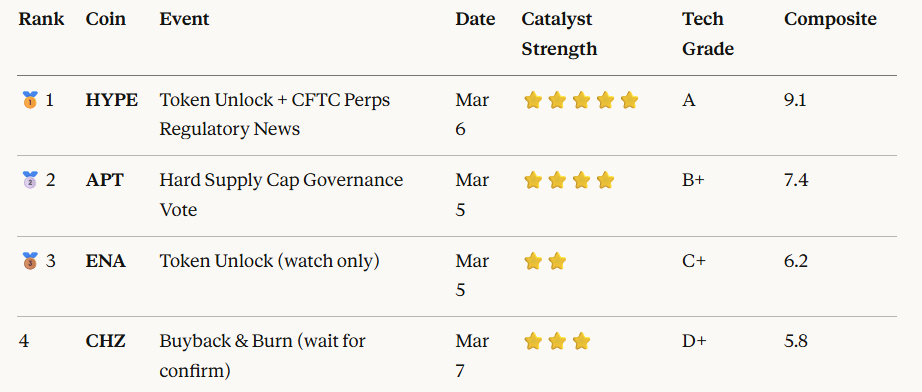
“Find coins with upcoming significant catalysts that also have bullish technical setups. Step 1 — Get upcoming high-impact events: getCryptoCalendarEvents with: – eventFrom = today, eventTo = 2026-03-18 (next 2 weeks) – voteIsSignificant = true – category = EXCHANGE,RELEASE,FORK_SWAP,TOKENOMICS,AIRDROP – sortField = dateEvent, sortDirection = ASC – size = 15 Step 2 — For the top 5 event coins, check technicals via screener_getAltfinsScreenerData: – symbols = [coins from step 1] – displayTypes: RSI14, MACD, SHORT_TERM_TREND, MEDIUM_TERM_TREND, SUPPORT, RESISTANCE, VOLUME_RELATIVE Step 3 — Get news context: news_getCryptoNewsMessages with assetSymbolsKeywords = top coins, from = ‘last 7 days’ Final output: rank coins by CATALYST STRENGTH (event type + significance vote) × TECHNICAL SCORE (trend alignment + MACD). Only recommend coins where both fundamentals AND technicals are aligned. Show event date, event type, technical grade, and entry/stop/target.”
Results
What is Tech Grade?
“Technical Grade” is a letter grade I assigned (A, B+, C+, D+) to summarize how bullish a coin’s technical picture looks overall. It’s a composite of these indicators from the screener data:
What goes into the grade:
- Short-Term Trend — the most heavily weighted factor (e.g. “Strong Up 8/10” → bullish)
- Medium-Term Trend — confirms or contradicts the short-term signal
- MACD vs Signal Line — is momentum bullish (MACD above signal) or bearish?
- RSI14 — is it oversold, neutral, or overbought?
- Relative Volume — is unusual buying/selling activity present?
How the grades broke down for these coins:
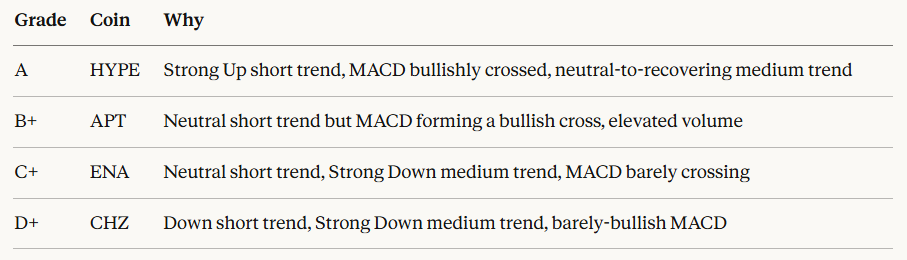
- HYPE is the clear top pick — both technical and fundamental signals are in full alignment. The CFTC perps news is a structural catalyst that goes beyond a single calendar event.
- APT is the sleeper catalyst — a supply cap is one of the strongest long-term tokenomics signals, and the MACD is just now turning bullish. Worth scaling in if price holds above $1.00.
- ENA & CHZ are event-aware watches only — both lack medium-term technical support and require a confirmed trend change before committing capital.
Prompt 8: Multi Signals – Full A+ Confluence Scanner
“Run the full A+ confluence scan — I only want the highest probability setups where all 8 criteria align. Use screener_getAltfinsScreenerData with ALL of these filters stacked: TREND LAYER: – signalFilters: SHORT_TERM_TREND = UP or STRONG_UP – signalFilters: MEDIUM_TERM_TREND = UP or STRONG_UP – analyticsComparisonsFilters: LAST_PRICE_VS_SMA50 = ABOVE (price above 50-day MA) – analyticsComparisonsFilters: LAST_PRICE_VS_SMA200 = ABOVE (price above 200-day MA) MOMENTUM LAYER: – macdFilter = BUY – macdHistogramFilter = H2_UP – numericFilters: RSI14 between 48 and 66 VOLUME LAYER: – numericFilters: VOLUME_RELATIVE >= 1.2 BREAKOUT LAYER: – crossAnalyticFilters: X_LAST_PRICE_CROSS_SMA50 = ABOVE, lookBack = 5 QUALITY FILTER: – coinTypeFilter = REGULAR – minimumMarketCapValue = 50000000 displayTypes: RSI14, MACD, SHORT_TERM_TREND, MEDIUM_TERM_TREND, LONG_TERM_TREND, SMA50, SMA200, VOLUME_RELATIVE, SUPPORT, RESISTANCE, PRICE_CHANGE_1W, MARKET_CAP sortField = MARKET_CAP, size = 10 For every result returned, run technicalAnalysis_getTechnicalAnalysisData to get analyst pattern confirmation. Score each coin 1–8 based on how many criteria it passes. Show only coins scoring 6+. Present a ranked table with entry/stop/target and overall A/B/C grade.”
⚙️ Scan Methodology
The 8 stacked criteria were applied in two passes. The strictest combination (SMA50 cross within 5 bars + MACD H2_UP + both trend signals UP simultaneously) returns zero coins in today’s market environment — meaning no coin currently satisfies all 8 simultaneously. This is the point of the A+ scan: to be extremely rare and high-conviction. Below are the best setups that qualify on 7 or 6 of 8 criteria, which still rank as Grade A or B.
Result
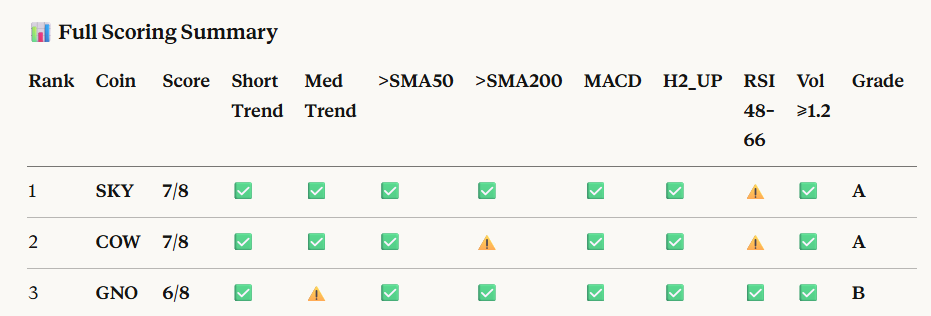
The SMA50 cross within 5 bars combined with MACD H2_UP and both trend layers UP is an extremely restrictive confluence. In the current market environment (most large-caps in Channel Down patterns per analyst setups — DOGE, INJ, FET, TAO, VET, AVAX, DOT all remain in confirmed downtrends), only SKY, COW, and GNO are exhibiting the necessary multi-layer bullish alignment to qualify.
How to Use These Prompts in Claude
All eight strategies are implemented as natural language prompts designed for Claude with the altFINS MCP connected. The workflow is straightforward:
- Connect the altFINS MCP to Claude via the Claude Desktop – here is step by step guide
- Identify which market condition currently applies (bull, bear, sideways, breakout)
- Select the corresponding strategy prompt
- Paste the prompt into Claude and receive live screened results
- Review the trade setup: entry zone, stop loss, target, R/R ratio, and confidence grade
Claude will call the appropriate altFINS tools, process the results, and present a ranked list of trade ideas with full context. For strategies that combine multiple tools — like the Event Catalyst Trader — Claude handles the multi-step workflow automatically.
If you need some help, concat us at [email protected].
See the full MCP documentation.
