

Search Knowledge Base by Keyword
Crypto Charts on altFINS: The Complete Guide to the Defined Chart (2026)
altFINS gives you crypto charts for 2,000+ coins with 150+ indicators, plus a Defined Chart on the top cryptocurrencies: an analyst-built setup with trend, momentum, volume, patterns, and clear support and resistance already drawn.
Crypto charts are the heartbeat of every trading decision, and altFINS puts them at the center of the platform. You get interactive altFINS charts and full TradingView charts, a huge indicator library, and a curated Defined Chart for the major coins so you can read a professional setup in seconds. This 2026 guide covers both: how to use crypto charts across the whole market, and how to read a Defined Chart on the coins that matter most.
Quick answer: On altFINS, crypto charts are interactive candlestick charts for 2,000+ cryptocurrencies with 150+ technical indicators and TradingView integration. A Defined Chart is the curated version: an analyst-prepared chart on the top coins that maps out trend, momentum, volume, chart patterns, and support and resistance, giving you a ready-made trade setup.
What Is a Defined Chart on altFINS?
A Defined Chart is the human-curated layer of altFINS crypto charts. While the platform charts every coin automatically, a Defined Chart is prepared by altFINS analysts who study a coin and lay out a full trade setup on it. You will also see this called a Trade Setup or curated chart. The meaning is the same: a professionally defined crypto chart that saves you hours of manual analysis.
Example of Curated chart of Solana
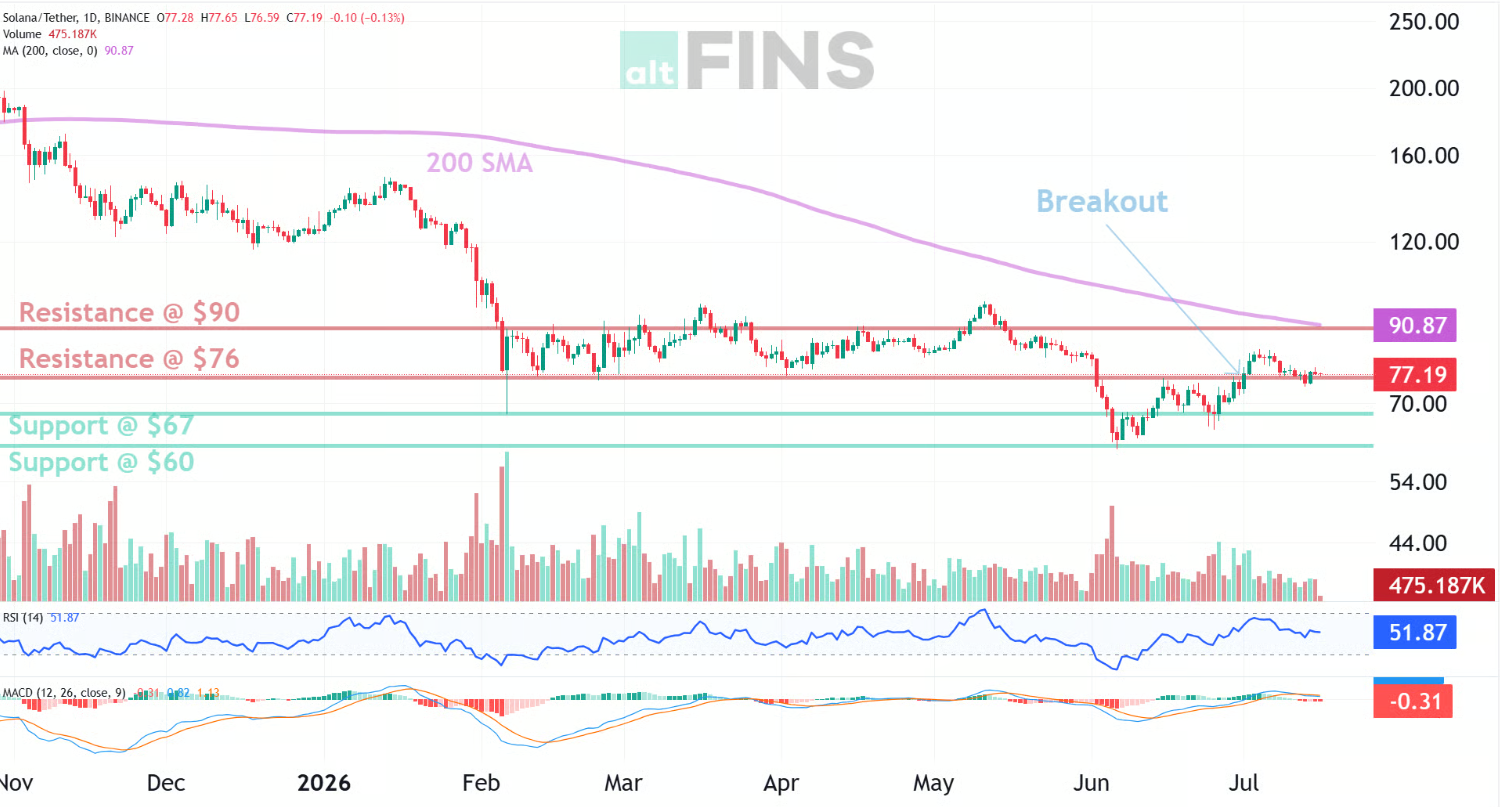
The idea is simple, and that is the strength of it. Every Defined Chart follows the same repeatable method, so once you can read one, you can read them all. altFINS describes these as “building blocks” for your trading: they give you the framework and the levels, while the final entry, exit, and position size stay your decision.
Crypto Charts on altFINS: altFINS Charts and TradingView Charts
altFINS covers 2,000+ coins with two charting engines in one place, so you never have to leave the platform to study a crypto chart.
| Chart type | What it is | Best for |
|---|---|---|
| altFINS crypto charts | Native grid charts with altFINS indicators and auto-detected levels | Fast visual scanning across many coins |
| TradingView charts | Full TradingView charting opened from any coin | Deep analysis and drawing tools on one asset |
| Defined Chart | Analyst-curated setup on the top coins | Ready-made trade ideas with levels already drawn |
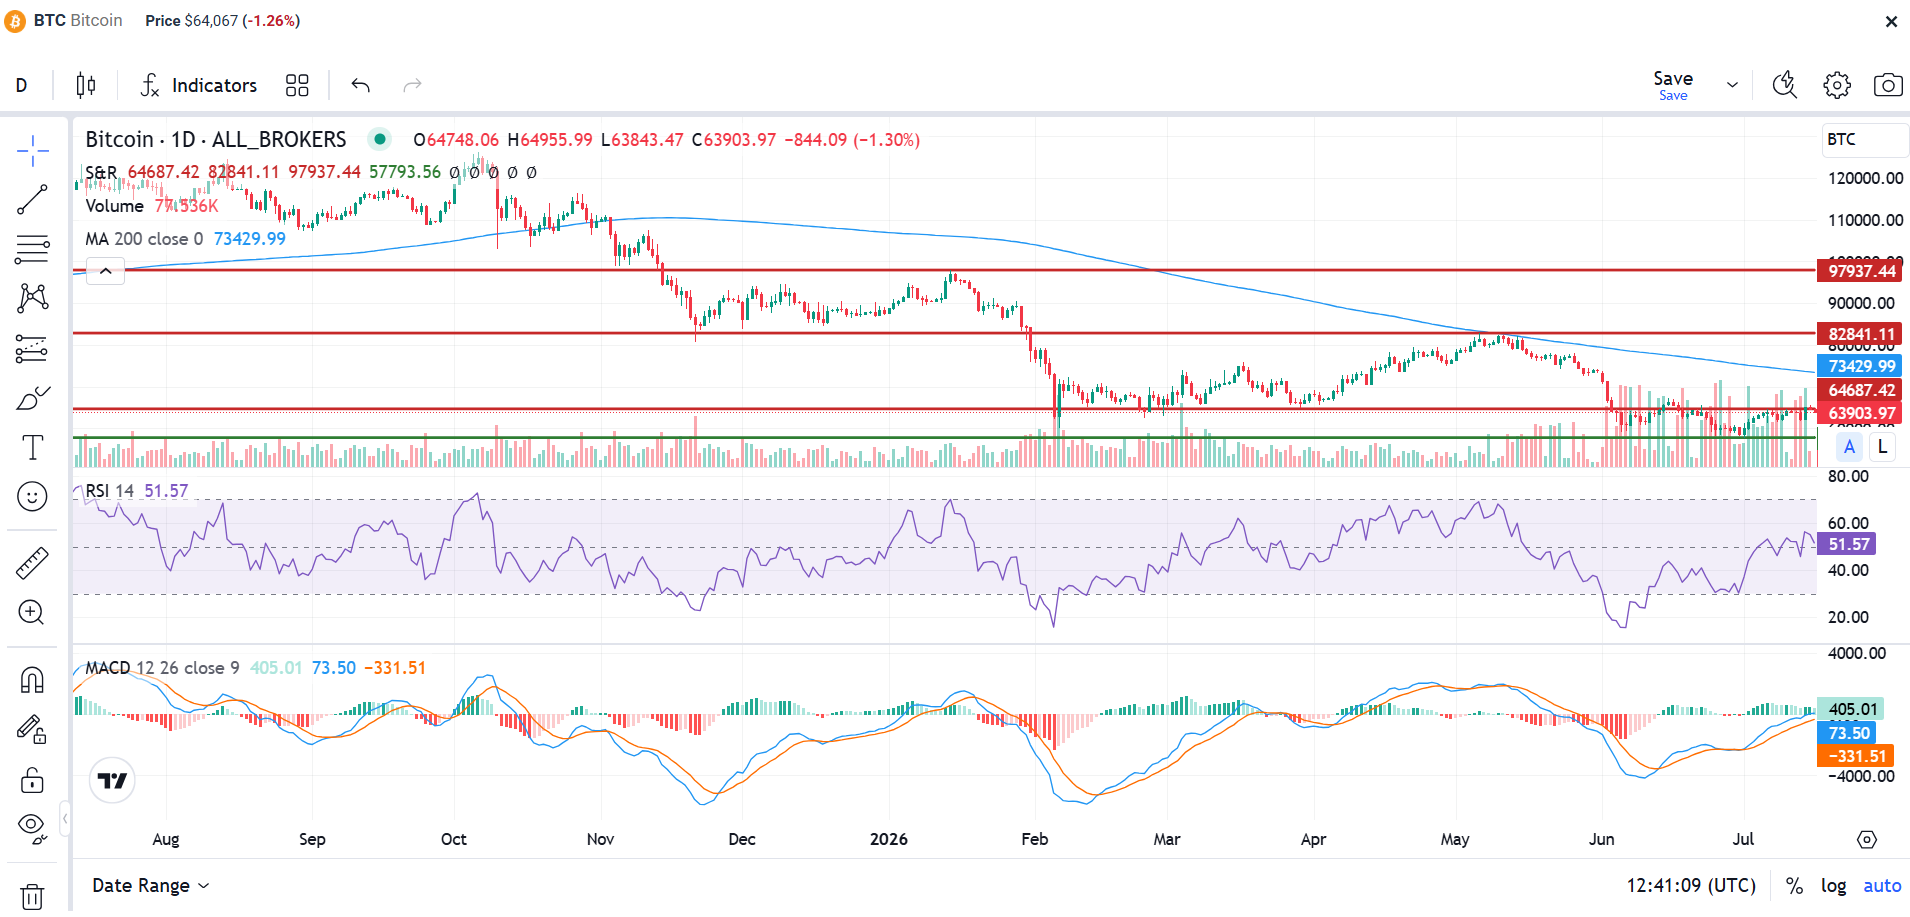
Every coin in the Crypto Screener charts view has a TradingView link. Open it for hands-on charting, then return to altFINS for screening, signals, and on-chain data that a pure charting tool does not offer.
150+ Indicators You Can Add to Any Crypto Chart
altFINS crypto charts support 150+ technical indicators across multiple timeframes. Use “Show on Chart” to layer the indicators you want directly onto price:
Example of an altFINS BTC Chart
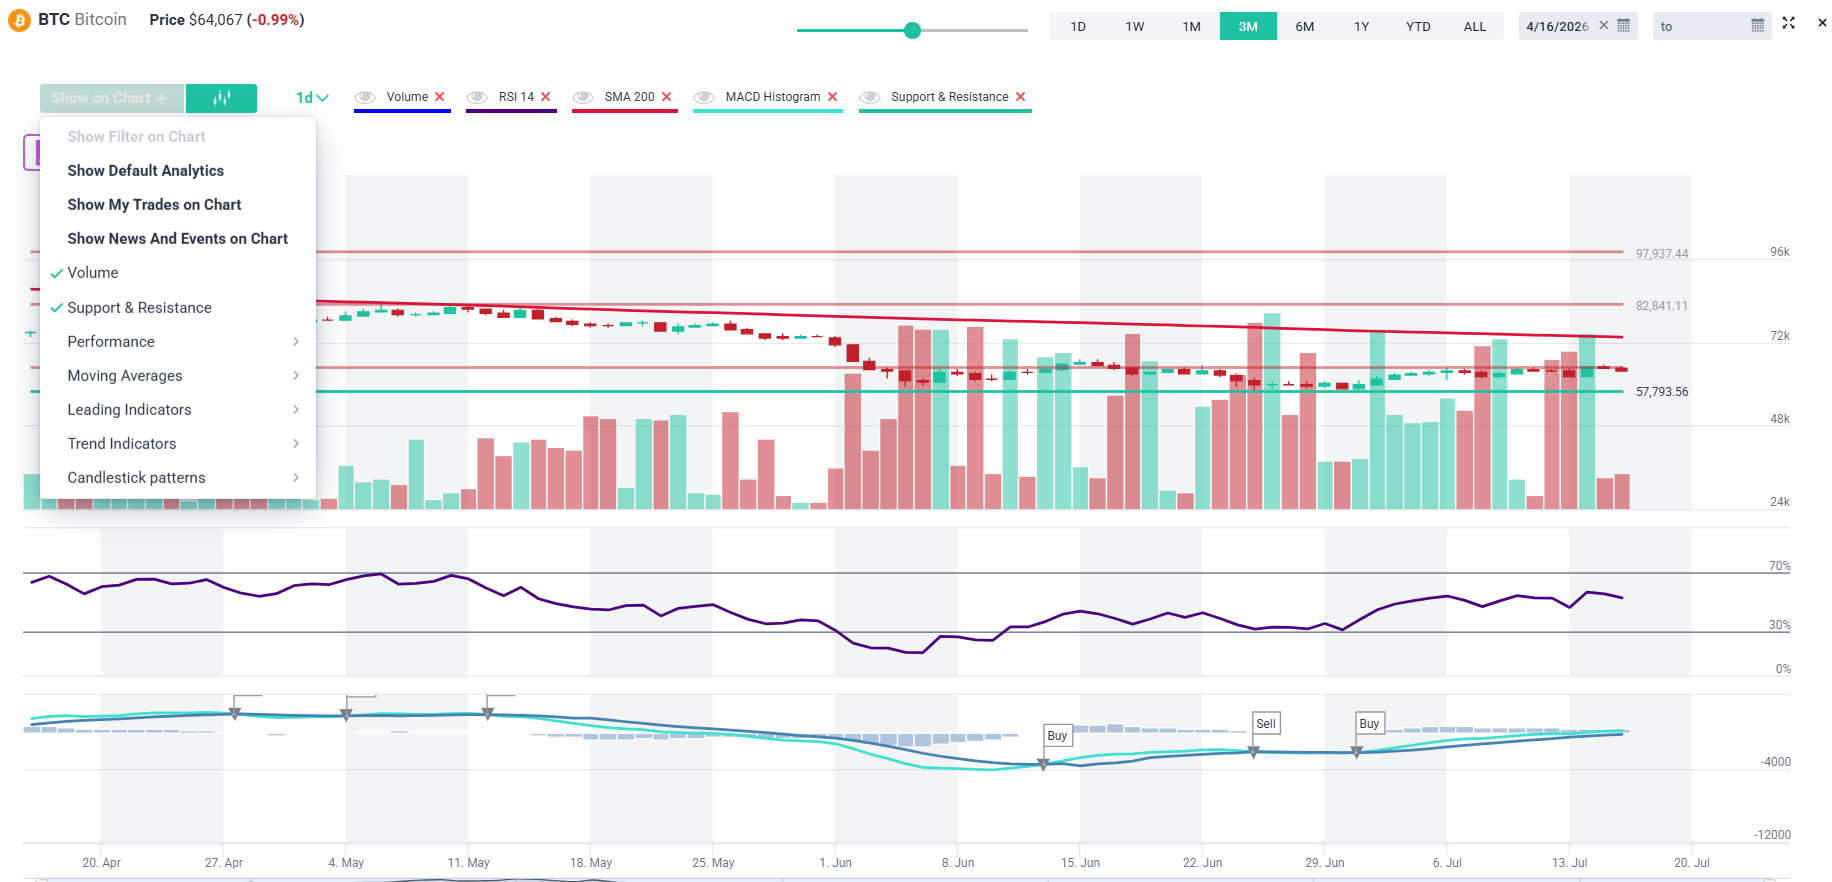
Showcasing customizable 150+ analytics and selectable time intervals:
- Support & Resistance, auto-detected zones that mark the key levels.
- RSI 14, the momentum oscillator for overbought and oversold reads.
- MACD Histogram, a fast read on shifting momentum.
- Volume, the demand and supply behind each move.
- SMA 200, the long-term trend line.
You can also add moving averages, Bollinger Bands, Stochastic, Williams %R, OBV, ATR, and more. As a registered user, altFINS remembers your setup, so every crypto chart opens the way you like it.
Example of TradingView BTC Chart on altFINS Crypto Screener
How altFINS Builds Every Defined Chart – Curated Chart
Each Defined Chart is built from five key principles of technical analysis. Together they answer the questions that matter before any trade: which way is price moving, is the move gaining strength, is real volume behind it, and where are the key levels.
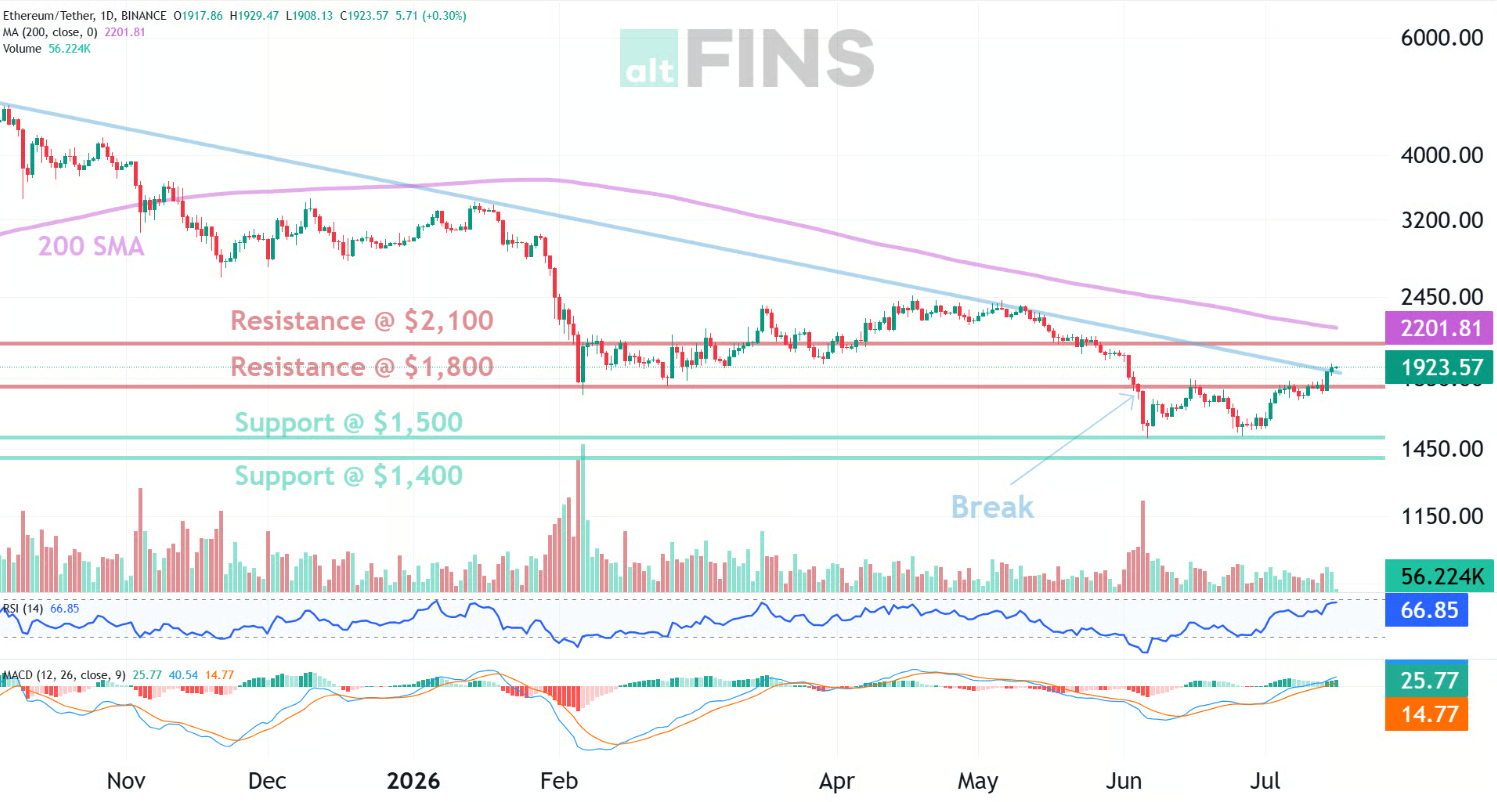
- Trend. A proprietary trend scoring system grades direction and strength.
- Momentum. MACD crossovers and RSI show if momentum is bullish or bearish.
- Volume. OBV reveals whether a move has real participation.
- Patterns. Analysts mark chart patterns such as triangles, wedges, channels, and reversals.
- Support and resistance. Clear horizontal zones become the key levels, usually labelled Buy Support and Sell Resistance.
What You See Inside a Defined Chart
Open a Defined Chart and you get a decision-ready picture rather than a blank crypto chart. A typical setup includes:
- A Buy Support zone where price is more likely to hold or bounce.
- A Sell Resistance zone or price target where the move may stall.
- The trend rating, so you trade with the dominant direction.
- The momentum read from MACD and RSI.
- A volume check via OBV.
- Any active chart pattern shaping the setup.
AI Trade Setup on Every Crypto Chart
The AI Trade Setup button sits on every crypto chart in the Screener. Launched in 2026, it reads a coin in one click, evaluating five pillars at once and turning them into a ready-to-read plan:
- Trend direction and strength
- Support and resistance levels
- Momentum from MACD and RSI
- Active chart patterns
- Volume confirmation
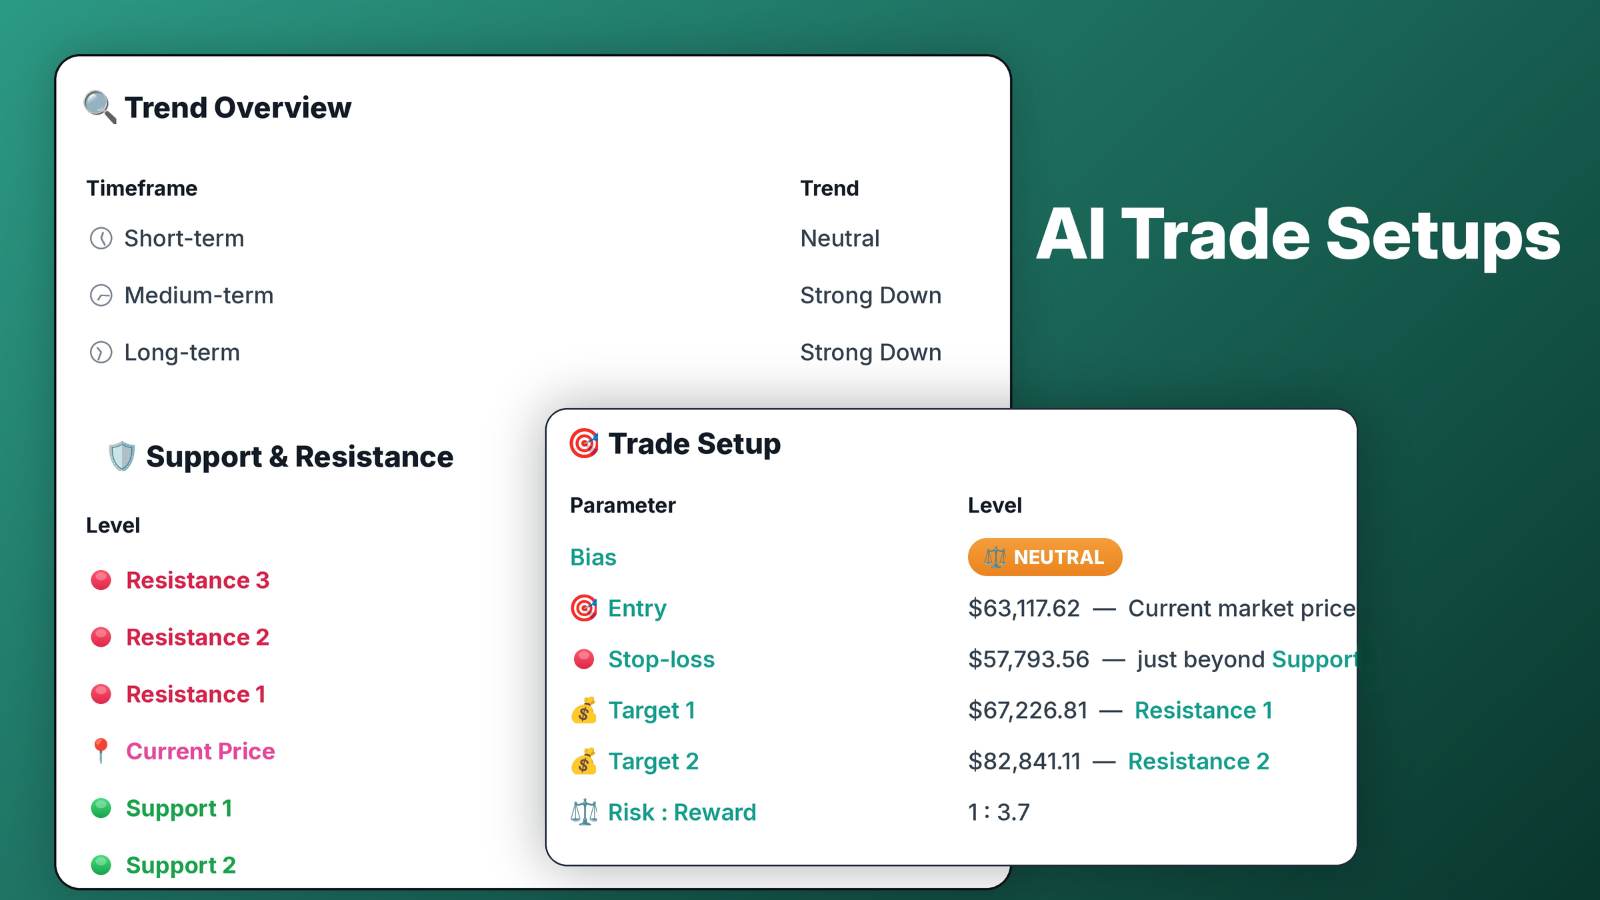
It works across four timeframes, 15-minute, 1-hour, 4-hour, and daily, so day, swing, and position traders all get a fitting setup. See the AI Trade Setup guide for details.
Copilot, Your Trade Analyst
At the top of the Screener sits the AI Copilot. Type a request like “show me oversold DeFi coins on the 4H timeframe” and it builds the scan, surfaces matching crypto charts, and explains the signals in plain language.
Defined Chart vs Screener Chart vs AI Chart Patterns
| Tool | Built by | Best for |
|---|---|---|
| Defined Chart | altFINS analysts | Ready-made setups on major coins with levels drawn |
| Screener crypto charts | You, with filters | Scanning and confirming setups across 2,000+ coins |
| AI Chart Patterns | Automated AI | Finding emerging and completed patterns market-wide |
The Defined Chart gives you conviction on the big names, the Screener crypto charts let you hunt on your own terms, and the AI Chart Patterns widen your net.
Example of VIRTUAL AI Chart Pattern
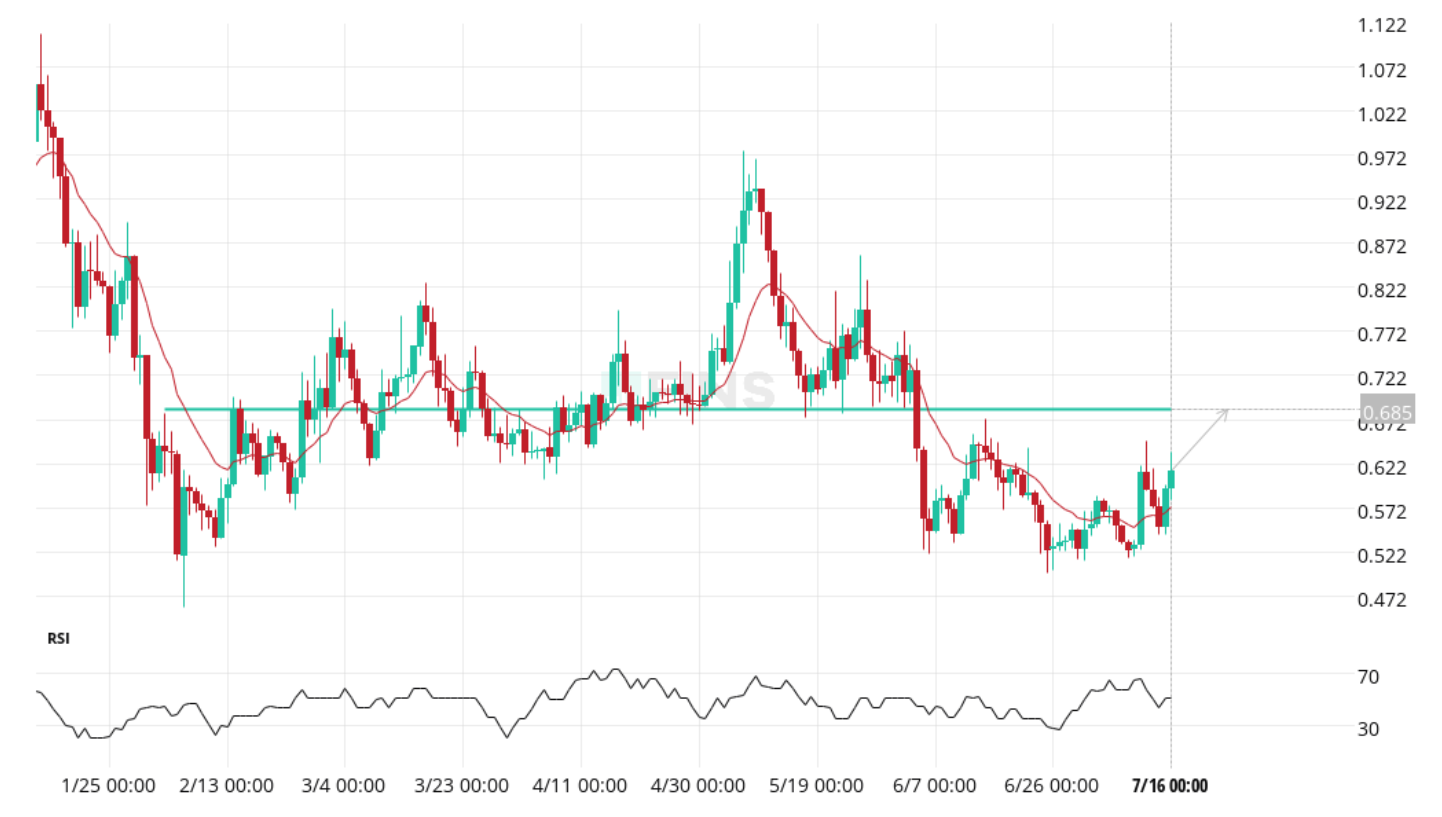
How to Find and Use Crypto Charts on altFINS
- Open the Crypto Screener and run a preset or custom filter.
- Switch to the Charts tab to see results as a grid of crypto charts.
- Use Show on Chart to add Support & Resistance, RSI, MACD, Volume, and SMA 200.
- Click AI Trade Setup for an instant five-pillar read.
- For the majors, open the curated Defined Chart in the Technical Analysis section.
- For top 500 coins visit AI Chart Patterns
- Set an alert at a key level so you never miss the entry.
Crypto Charts and Defined Chart FAQ
What is a Defined Chart?
A Defined Chart is an analyst-curated crypto chart with a complete trade setup already drawn: trend, momentum, volume, patterns, and support and resistance levels.
How many crypto charts does altFINS have?
altFINS provides crypto charts for 2,000+ cryptocurrencies, each with 150+ indicators across multiple timeframes.
Does altFINS use TradingView charts?
Yes. altFINS has native crypto charts and also links to full TradingView charts from every coin, so you get both in one workflow.
Is a Defined Chart the same as a Screener chart?
No. Screener crypto charts are interactive and built for discovery across all coins. A Defined Chart is an analyst-curated setup on the top coins with entry, exit, stop-loss, and targets.
Are altFINS crypto charts free?
altFINS offers a free plan with limited access and paid plans that unlock the full charting and analytics suite. Check current pricing on the platform for exact details.
Disclaimer: This article is for educational purposes only and is not financial advice. Cryptocurrency trading carries risk. Always do your own research and never risk more than you can afford to lose.
