Search Knowledge Base by Keyword
Stocks Near 52-Week Low: Bargains or Value Traps? (2026 Guide)
Stocks near their 52-week low are trading close to the lowest price of the past year, usually within 5% to 10% of that level. Some are genuine bargains after an overreaction, but many are falling for a reason and keep falling. The difference shows up in the chart and the fundamentals: a stock that stops making lower lows, holds support on rising volume and has stable earnings is a candidate; one still in a steep downtrend is a value trap until proven otherwise.
This guide is for value investors, contrarian swing traders and anyone who has looked at a beaten-down name and wondered, “Is this cheap now?” Crypto traders who buy dips on altcoins will recognise the same questions.
You will learn how the 52-week low works, what research says about buying near lows, how to screen for these stocks, a real October 2026 snapshot and a checklist to tell a bottom from a trap.
Quick answer: A stock near its 52-week low trades within about 5% to 10% of its lowest price in the last 52 weeks. Being near the low is not a buy signal on its own; research shows stocks near 52-week lows tend to underperform on average. Look for confirmation before buying: a higher low, a break above short-term resistance, rising volume on up days, bullish RSI divergence and no deterioration in earnings.
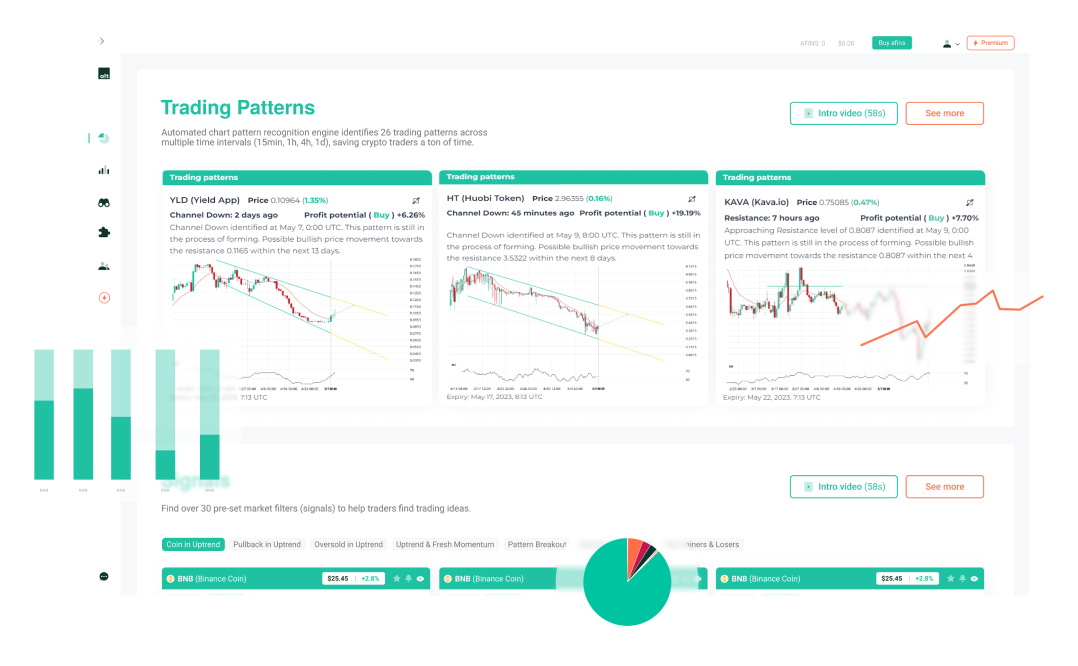
Find lows that are turning, not just falling: the altFINS screener filters for price within 5%, 10% or 20% of the 52-week low and adds trend, RSI divergence and support filters across 2,000+ coins and 200+ tokenized stocks, with full stocks coming soon. Scan for 52-week lows in altFINS.
📉 What does a 52-week low mean?
Takeaway: the 52-week low is the lowest price of the last year, and the market treats it as a key support level.
The 52-week low is the lowest traded price, or in some data sources the lowest closing price, over the last 52 weeks. Together with the 52-week high it forms the 52-week range, one of the first numbers on any quote page. Traders watch it because many buyers remember that level, and orders tend to cluster around it.
To measure how close a stock is to its low, use this formula:
Distance from 52-week low = (current price ÷ 52-week low) minus 1, shown as a percentage.
A stock at $105 with a 52-week low of $100 is 5% above its low. Screeners usually call anything within 5% to 10% “near the 52-week low”.
| Feature | Near 52-week low | Near 52-week high |
|---|---|---|
| Trend message | Weakness, sellers in control over the past year | Strength, buyers in control |
| Average forward performance (research) | Tends to lag the market | Tends to beat the market |
| Typical strategy | Contrarian or value, wait for a base | Momentum or breakout |
| Main risk | Value trap, the low breaks and the slide continues | Buying a late, extended move |
For the other side of the range, read our guide to 52-week high stocks.
Are stocks near 52-week lows a good buy? What the research says
Takeaway: on average, no; the edge comes from waiting for evidence of a turn.
A widely cited study by Thomas George and Chuan-Yang Hwang, “The 52-Week High and Momentum Investing” (Journal of Finance, 2004), found that stocks trading close to their 52-week highs tended to outperform, while stocks far from their highs tended to underperform. The authors linked this to anchoring: investors are slow to react to news when a price sits near a familiar reference point.
The practical lesson is simple. A stock near its 52-week low is cheaper than before, but “cheaper” does not mean “undervalued”. Lows are often caused by falling earnings, debt problems or a broken business model. Buying blindly at the low is a bet against the trend.
How to screen for stocks near their 52-week low
Takeaway: combine the 52-week filter with trend and quality filters, or the list is mostly losers.
- 52-week filter: price within 10% of the 52-week low.
- Liquidity: average volume above 500,000 shares and price above $5.
- Quality: positive free cash flow or stable earnings estimates, debt-to-equity below your limit.
- Momentum turn: RSI(14) rising from below 30, or a bullish RSI divergence. See our RSI divergence guide.
- Structure: no new 52-week low in the last 10 to 20 sessions, a sign that the selling is drying up.
- Volume: up days on higher volume than down days, often visible in a rising on-balance volume (OBV) line.
Do it in altFINS: in the screener, set the 52-week filter to “price within 10% of 52-week low”, add RSI14 above 30 and a bullish RSI divergence, and sort by relative volume. Save the scan and turn on alerts.
Catch the turn, not the slide. altFINS combines 52-week range filters with bullish RSI divergence, support levels and trend upgrades, so you only see lows that are showing signs of life. Build your 52-week low scan.
Stocks near 52-week lows: real data from October 2026
Takeaway: being near the low says nothing on its own; trend and momentum tell you which list to put each stock on.
Snapshot from the altFINS screener on 21 October 2026, using tokenized versions of US stocks and ETFs. Tokenized stocks track the underlying shares but trade 24/7, so prices can differ slightly from the exchange close. The 52-week low reflects the token’s own history.
| Tokenized stock | Price | 52-week low | Above low | RSI(14) | Read |
|---|---|---|---|---|---|
| Netflix (NFLXx) | 65.16 | 63.68 | 2.3% | 33.1 | 50-day SMA below 200-day SMA; still in a downtrend, no base yet |
| iShares US Aerospace and Defense ETF (ITAx) | 208.65 | 199.20 | 4.7% | 38.5 | Weak momentum; watch whether the low holds |
| McDonald’s (MCDx) | 242.89 | 226.73 | 7.1% | 50.1 | RSI recovered to neutral; testing whether a base is forming |
| PepsiCo (PEPx) | 133.72 | 124.35 | 7.5% | 52.9 | Momentum stabilising; needs a break above the 50-day SMA (134.64) |
| IREN (IRENx) | 28.16 | 25.63 | 9.9% | 28.3 | Oversold after a 40% monthly drop; high risk |
| Marathon Digital (MARAx) | 7.71 | 7.07 | 9.0% | 24.2 | Deeply oversold, down 42% in a month; falling knife until it bases |
Source: altFINS screener data, 21 October 2026. Examples for education only, not recommendations.
Bargain or value trap? The 6-point checklist
Takeaway: a real bottom shows up in price, volume and fundamentals at the same time.
| Signal | Possible bargain | Likely value trap |
|---|---|---|
| Price structure | Higher low, then a break above short-term resistance | Lower lows, every bounce sold |
| Volume | Heavy volume on up days, light on down days | Heavy volume on breakdowns |
| Momentum | Bullish RSI divergence, RSI back above 30 | RSI pinned below 30 for weeks |
| Moving averages | Price reclaims the 20-day and 50-day SMA | Price rejected at the 50-day SMA |
| Fundamentals | Earnings estimates stable, balance sheet solid | Estimates falling, rising debt or dilution |
| Catalyst | Temporary issue, sector-wide selloff | Structural problem, lost market share |
If at least four of six signals point to “bargain”, the setup is worth a closer look. Patterns such as the double bottom often mark the shift from the last column to the middle one.
How to trade a stock near its 52-week low
Takeaway: buy confirmation, put the stop under the low and size small.
Entry
Wait for the stock to hold above its 52-week low for at least two to four weeks, then buy a break above the most recent swing high on above-average volume. This often completes a double bottom or a base.
Stop-loss
Place the stop just below the 52-week low. If that level breaks, the thesis is wrong and new lows often trigger more selling.
Targets
The first target is the 50-day SMA or the nearest resistance level. The second is the 200-day SMA, which often caps the first rally from a low. Trail the stop as each level is cleared.
How altFINS helps
Takeaway: altFINS turns “near the low” into a filtered, alert-ready shortlist.
- 52-week range filters: price within 5%, 10% or 20% of the 52-week low or high.
- Bullish RSI divergence and oversold presets: find lows where momentum is already improving.
- Chart patterns: double bottoms, falling wedges and channel breakouts detected automatically.
- Signals Summary: trend upgrades and fresh bullish signals as they happen.
- Coverage: 2,000+ coins and 200+ tokenized stocks today, with full stocks coming to the screener soon.
Frequently asked questions
What does it mean when a stock is near its 52-week low?
It means the stock trades close to its lowest price of the past year, usually within 5% to 10%. It signals that sellers have been in control and that sentiment is weak. The level often acts as support, but if it breaks, selling can speed up. On its own it is a description of weakness, not a buy or sell signal.
Should I buy stocks at their 52-week low?
Not blindly. Academic research, including George and Hwang’s 2004 study, found that stocks far from their 52-week highs tend to underperform on average. A better approach is to wait for confirmation: a higher low, a break above short-term resistance on volume, a bullish RSI divergence and stable fundamentals. Then place a stop below the 52-week low.
How do I find stocks near their 52-week low?
Use a stock screener with a 52-week range filter and set it to “within 10% of the 52-week low”. Add filters for price above $5, average volume above 500,000 shares and quality measures such as positive cash flow. Then add a momentum filter, such as RSI above 30 or a bullish divergence, to remove stocks still in free fall.
What is a value trap?
A value trap is a stock that looks cheap because its price or valuation has fallen, but keeps falling because the business is deteriorating. Common signs are falling earnings estimates, rising debt, repeated share issuance and a chart with lower lows. Many stocks near 52-week lows are value traps, which is why technical and fundamental confirmation matters.
How is the 52-week low calculated?
It is the lowest price a stock traded at during the previous 52 weeks, updated every trading day. Some data providers use the lowest intraday price, while others use the lowest closing price, so figures can differ slightly between sites. Prices are usually adjusted for stock splits so that the range stays comparable over time.
Verdict
Stocks near their 52-week low are a hunting ground, not a shopping list. The research favours strength over weakness, so the edge comes from patience: let the stock prove the low with a higher low, rising volume and improving momentum, then buy with a stop under the low. Investor.gov’s investing basics are a good neutral primer on risk.
Let the screener watch the lows for you. Combine 52-week range, RSI divergence, support and trend filters in altFINS and get alerts when a beaten-down asset starts to turn. Start scanning for free or compare plans.
Disclaimer: This article is for educational purposes only and is not financial or investment advice. Trading stocks, tokenized stocks and cryptocurrencies involves substantial risk, and you can lose some or all of your capital. The tickers shown are examples from a dated data snapshot, not recommendations. Past research results do not guarantee future returns. Do your own research and consider speaking with a licensed financial professional before making investment decisions.