

Search Knowledge Base by Keyword
Golden Cross and Death Cross in Crypto: How to Trade Moving Average Crossovers
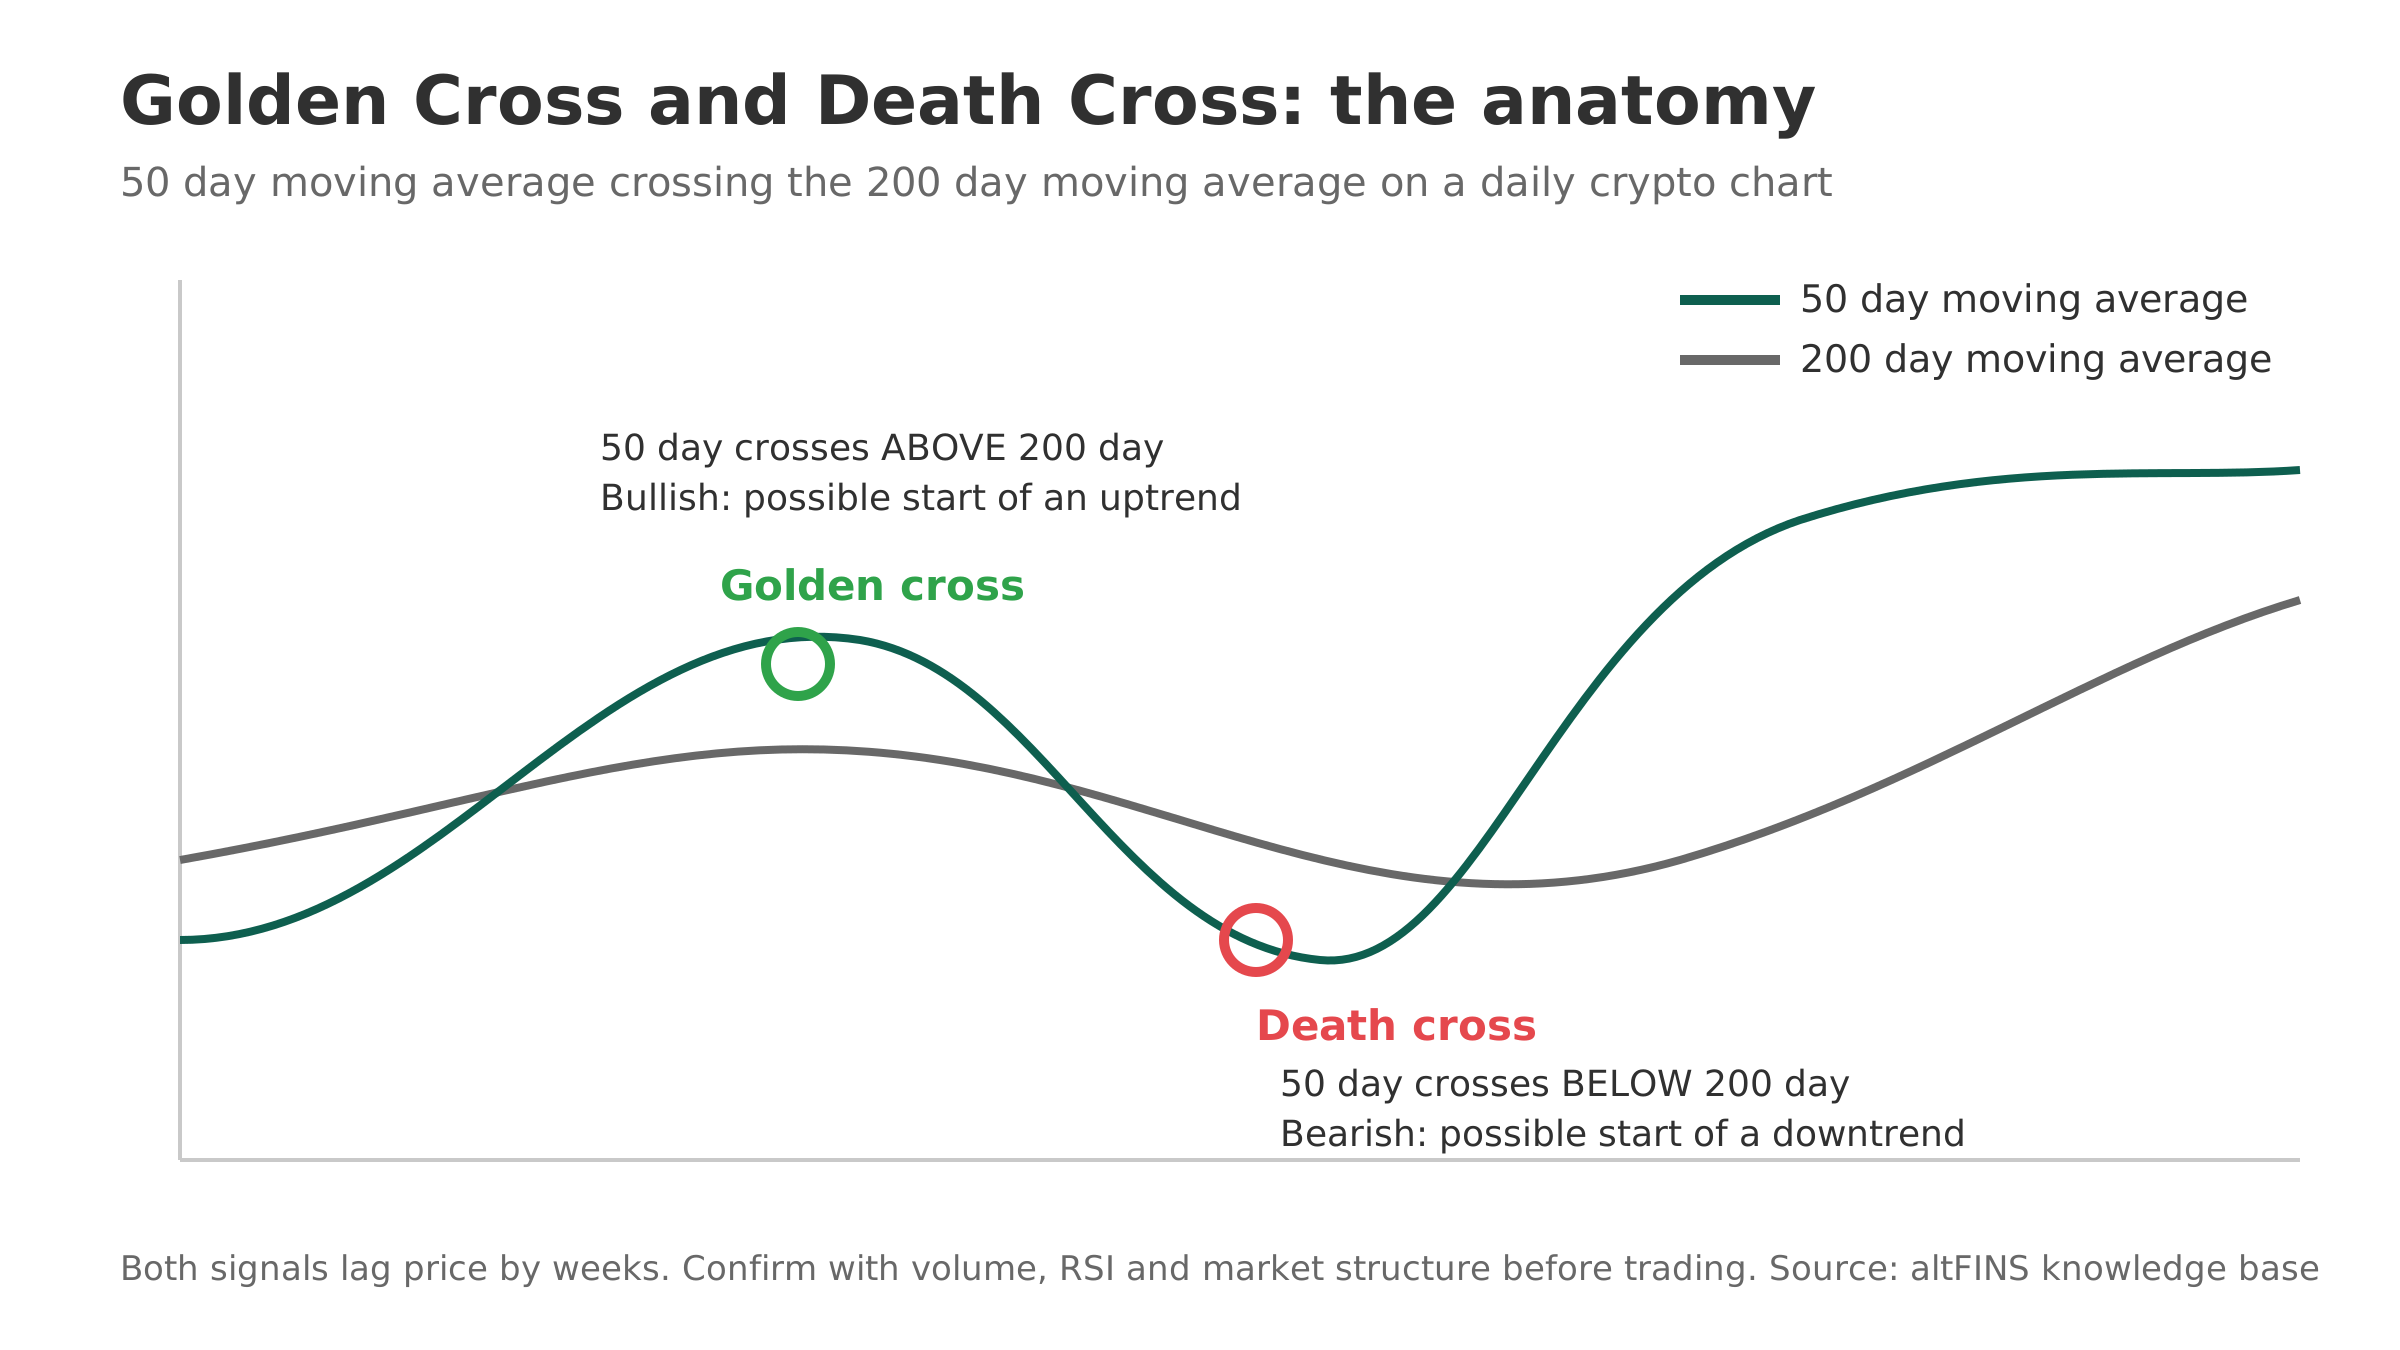
A golden cross happens when a shorter moving average, usually the 50 day, crosses above a longer moving average, usually the 200 day. It is read as a bullish trend signal. A death cross is the mirror image: the 50 day crosses below the 200 day, and traders read it as a bearish trend signal. Both are lagging signals, so they confirm a trend that has already started rather than predict a new one.
This guide is for crypto traders and investors who keep seeing “Bitcoin golden cross” headlines and want to know what the signal actually means, how reliable it is, and how to act on it without buying the top or selling the bottom. You will get clear definitions, a side by side comparison, the historical hit rate on Bitcoin, a simple trading checklist, and the current September 2026 picture.
You will also see how to scan the whole market for fresh 50 and 200 day crossovers on altFINS instead of watching charts one coin at a time.
Quick answer: A golden cross (50 day moving average crossing above the 200 day) is a bullish signal that a longer term uptrend may be starting. A death cross (50 day crossing below the 200 day) is the bearish opposite. Both lag price by weeks, so they work best as trend confirmation, not as entry triggers. On Bitcoin since 2012, golden crosses have produced an average three month gain near 25 percent, but only 3 of 12 stayed valid for a full year, per a September 2026 CoinDesk analysis. Always confirm with volume, RSI, and market structure, and size positions for the chance of a false signal.
What is a golden cross?
Takeaway: a golden cross is a momentum handoff, where the recent average price moves above the long term average price.
A golden cross forms when a short term moving average crosses from below to above a long term moving average. The standard setup uses the 50 day and the 200 day simple moving averages, measured on the daily chart. Some traders use exponential moving averages, which react faster, or shorter pairs such as the 20 and 50 for swing trades.
The logic is simple. The 50 day average reflects the last roughly two months of price. The 200 day average reflects the last roughly ten months. When the 50 day pushes above the 200 day, it means recent buying has been strong enough and sustained enough to lift the medium term trend above the long term trend. Analysts often describe a confirmed golden cross as the technical start of a bull market, though that label is only clear in hindsight.
Three stages usually play out. First, a downtrend loses steam and price stabilizes. Second, the 50 day average flattens and turns up while price trades above both averages. Third, the 50 day crosses the 200 day and the 200 day itself begins to slope upward, which is the stronger confirmation.
What is a death cross?
Takeaway: a death cross is the same mechanism in reverse and warns that a longer term downtrend may be forming.
A death cross forms when the 50 day moving average falls below the 200 day moving average. It signals that selling over the last two months has been strong enough to drag the medium term trend under the long term trend. In stock and crypto history, several major bear markets began within weeks of a death cross, which is why the name stuck.
A death cross is not a guarantee of a crash. Because it lags, price has often already fallen 10 to 15 percent from the top by the time the cross prints. In choppy, sideways markets the signal can whipsaw, printing a death cross and then a golden cross a few weeks later with little net price movement. The signal carries the most weight when the 200 day average is also turning down and volume expands on the down moves.
Golden cross vs death cross
Takeaway: they are two readings of one indicator, the 50 day versus 200 day moving average relationship.
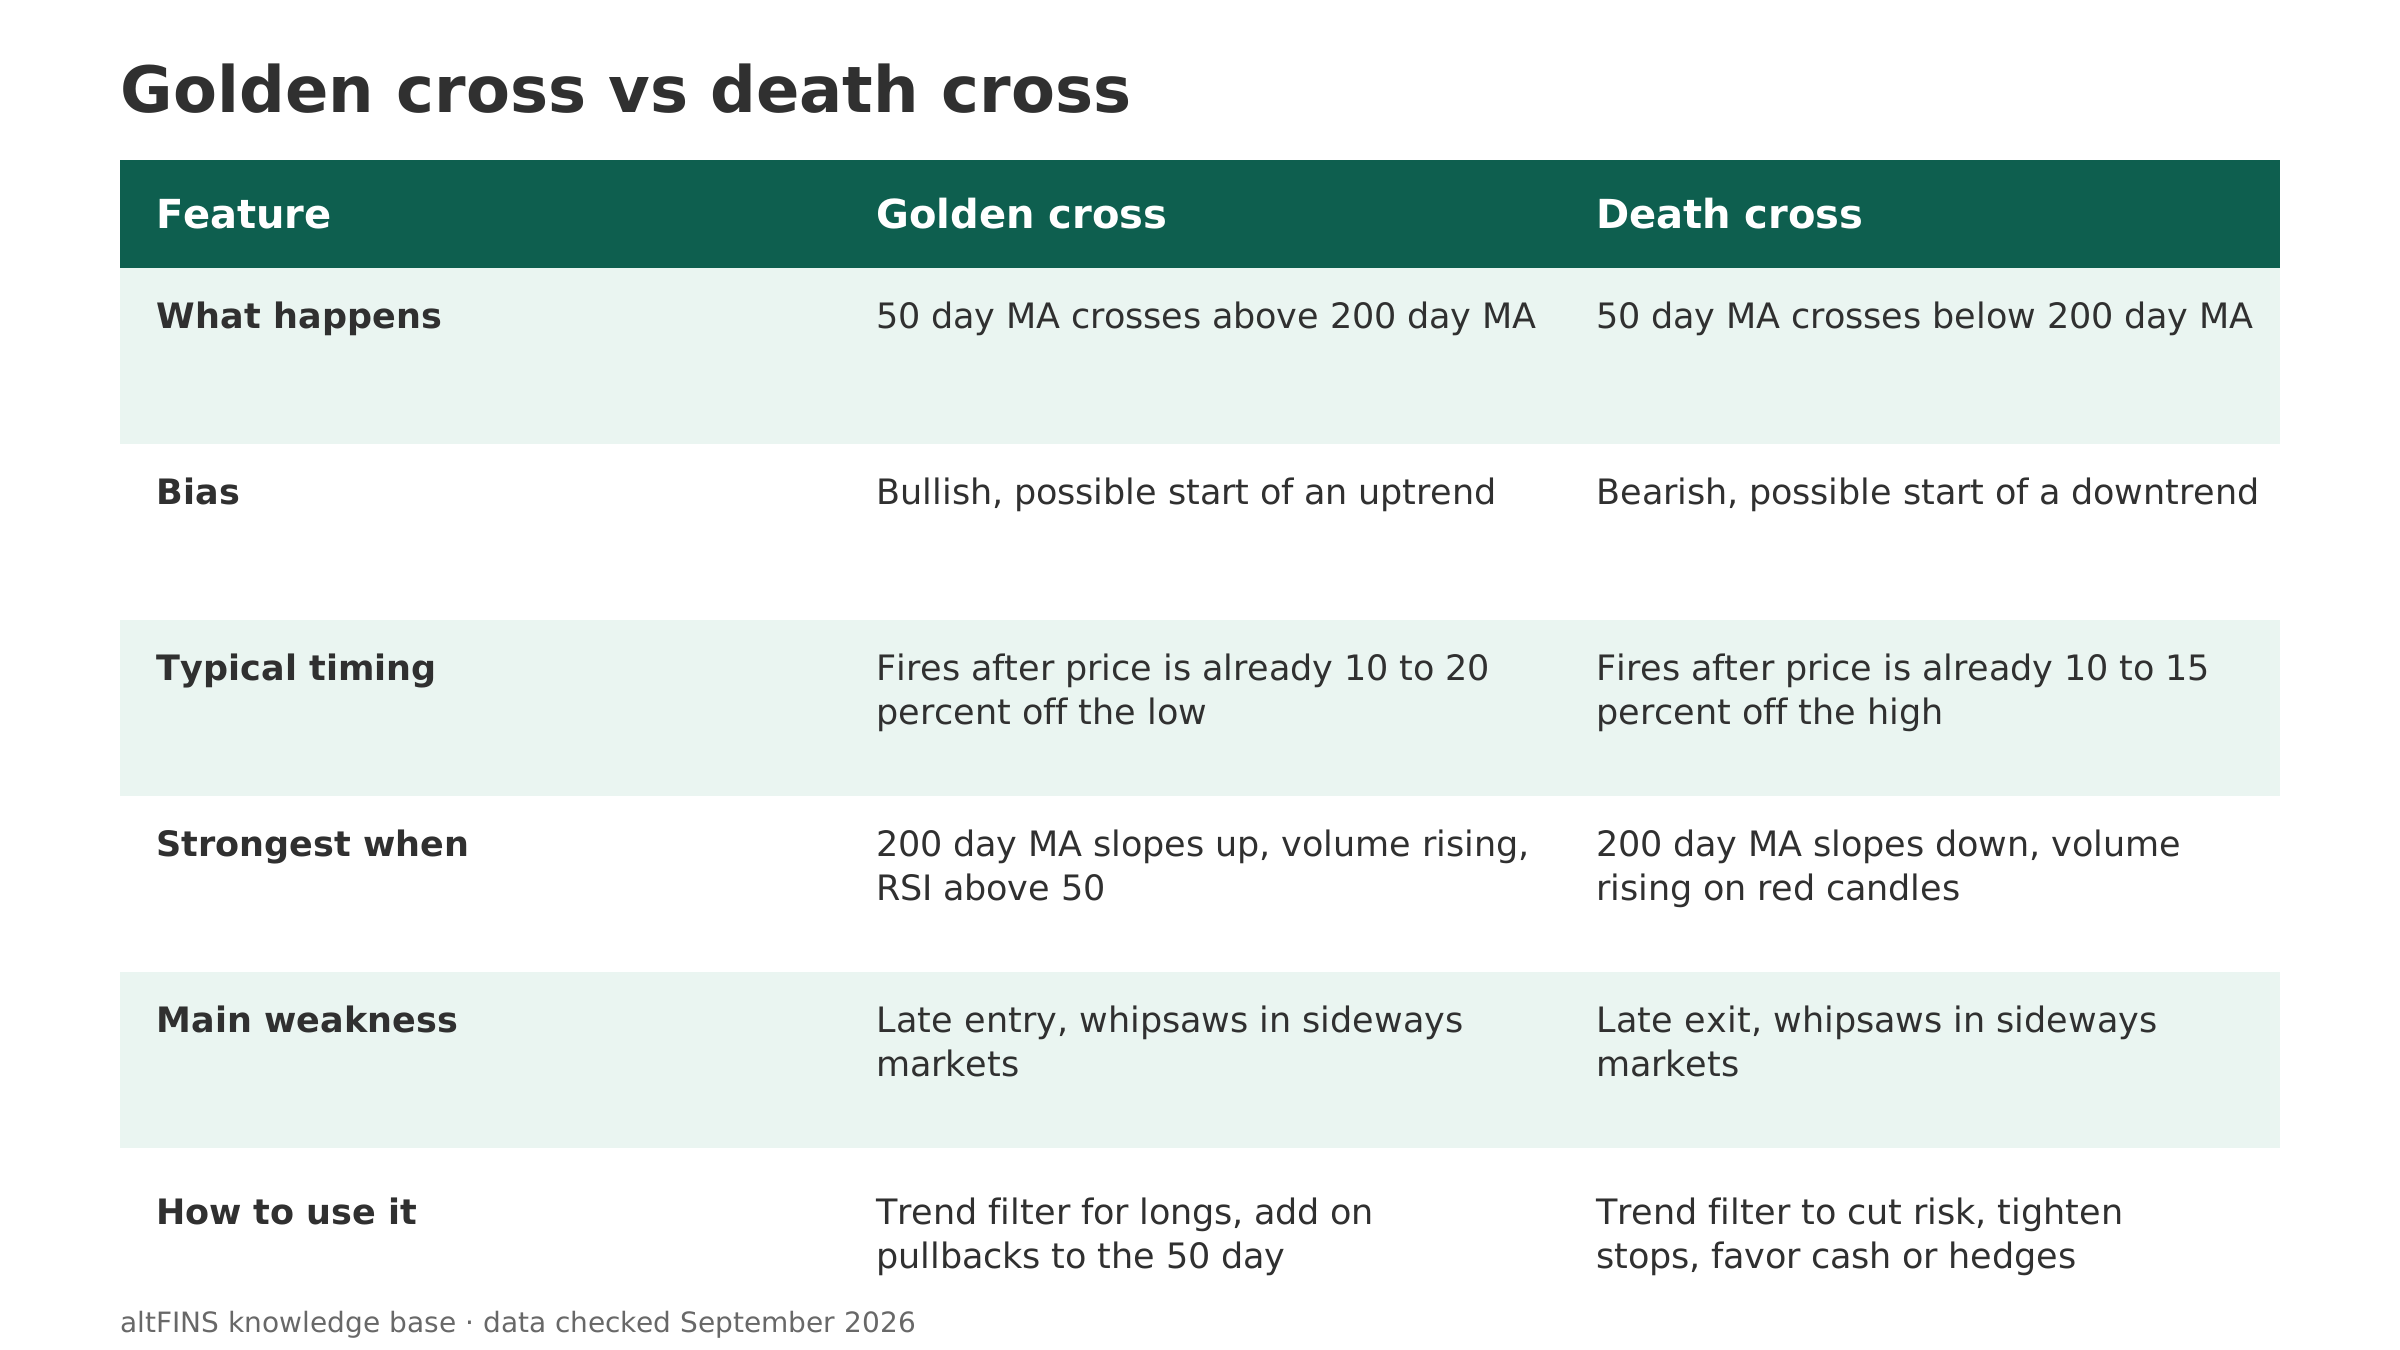
| Feature | Golden cross | Death cross |
|---|---|---|
| What happens | 50 day MA crosses above 200 day MA | 50 day MA crosses below 200 day MA |
| Bias | Bullish, possible start of an uptrend | Bearish, possible start of a downtrend |
| Typical timing | Fires after price is already 10 to 20 percent off the low | Fires after price is already 10 to 15 percent off the high |
| Strongest when | 200 day MA slopes up, volume rising, RSI above 50 | 200 day MA slopes down, volume rising on red candles |
| Main weakness | Late entry, whipsaws in sideways markets | Late exit, whipsaws in sideways markets |
| How to use it | Trend filter for longs, add on pullbacks to the 50 day | Trend filter to reduce risk, tighten stops, favor cash or hedges |
Why these signals matter in crypto
Takeaway: crypto trades 24 hours a day and moves in long trends, which makes a clean long term trend filter valuable.
Crypto markets never close, so the 50 and 200 day averages update every single day with no gaps. Bitcoin and large altcoins also tend to trend hard for months at a time, then range for months. A moving average crossover is a low effort way to answer one question that drives most portfolio decisions: is the long term trend up or down right now.
Because Bitcoin still leads most of the market, a Bitcoin golden or death cross often shapes sentiment for the entire crypto space. Traders watch it on BTC first, then look for altcoins that are printing the same signal with stronger momentum. That is a screening problem, not a charting problem, which is where a scanner earns its place.
How reliable are golden and death crosses?
Takeaway: useful as a trend filter, unreliable as a standalone trigger, and always late.
The lag problem
Both signals are built from 50 and 200 days of past data, so they are slow by design. A golden cross typically confirms only after price has already risen sharply off the bottom, and a death cross confirms after a large part of the drop is done. If you trade the cross itself with no other tools, you are often buying strength and selling weakness at the worst possible moment.
Bitcoin’s track record
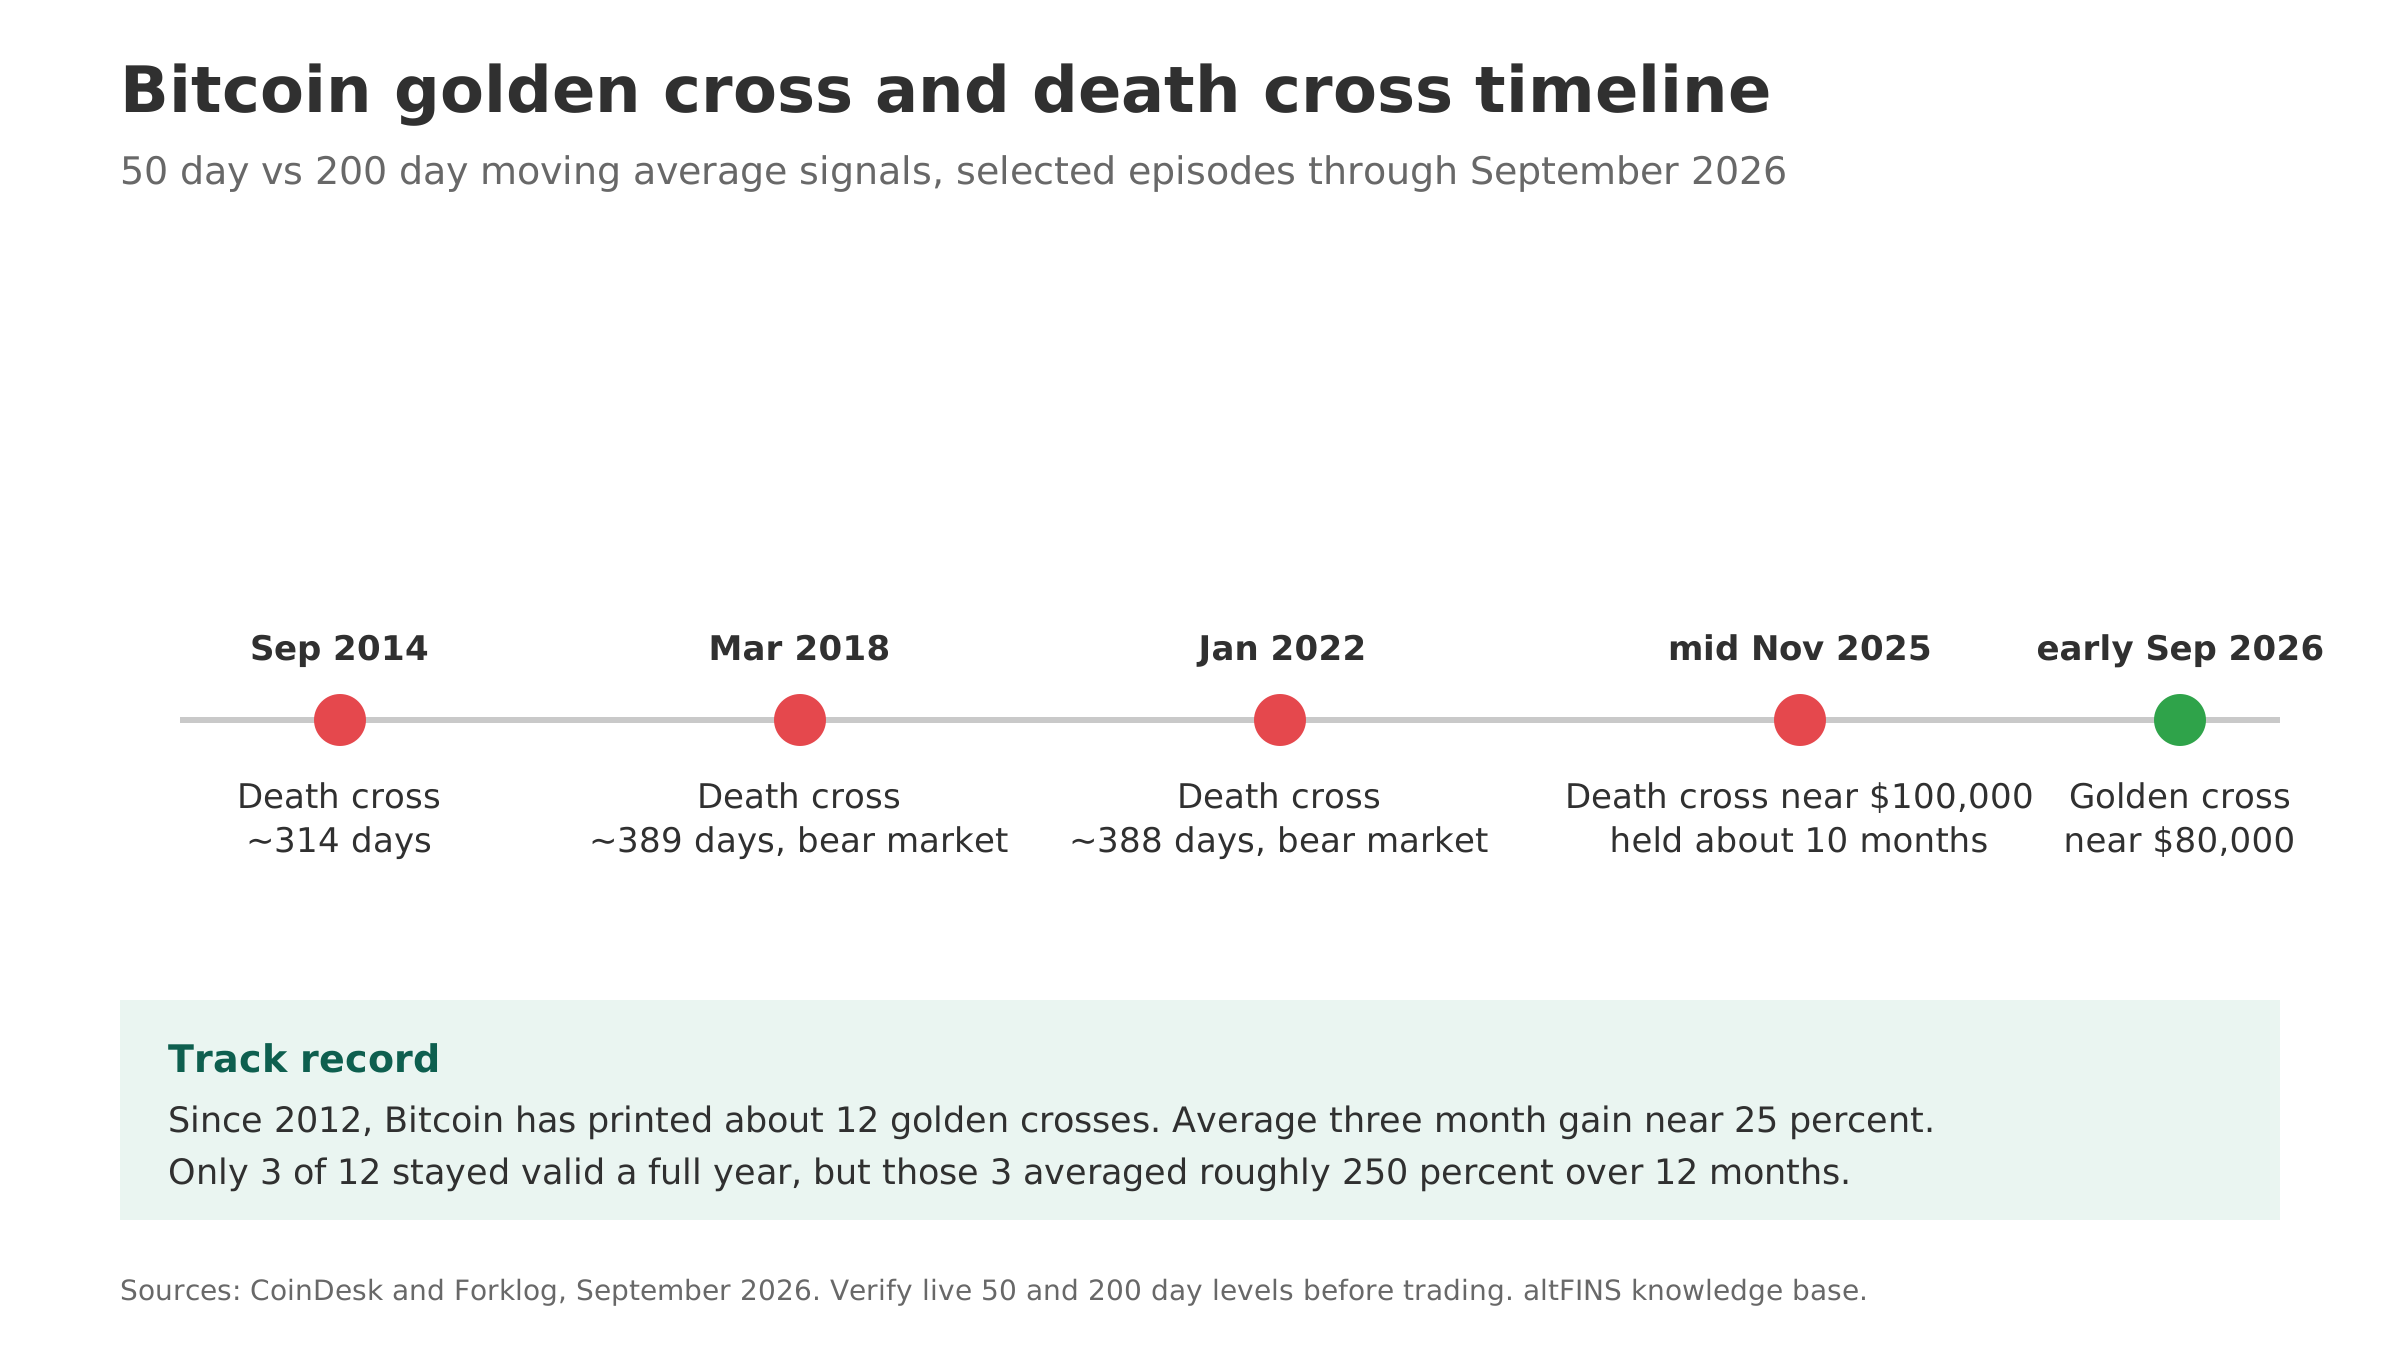
According to a September 2026 CoinDesk analysis, Bitcoin has printed about 12 golden crosses since 2012. On average they were followed by a three month gain near 25 percent. Only 3 of those 12 signals were still valid a year later, but those three were powerful, with an average 12 month gain around 250 percent. In other words, most golden crosses fizzle, and a few mark the start of a full bull market.
Death cross history is similar. Bitcoin’s longest death cross stretches followed the signals in September 2014, March 2018, and January 2022, each lasting close to a year and each overlapping a deep bear market. Shorter death crosses in range bound years produced far weaker follow through and several fake outs.
Research on stock indices points the same way. Studies of the 50 and 200 day crossover on major indices have generally found win rates in the low 60 percent range over 6 to 12 month windows, with false signals rising above 40 percent in sideways markets. Adding volume and momentum filters such as RSI confirmation cuts a meaningful share of those false signals.
How to trade a golden cross or death cross
Takeaway: treat the cross as context, then wait for a lower risk entry with confirmation.
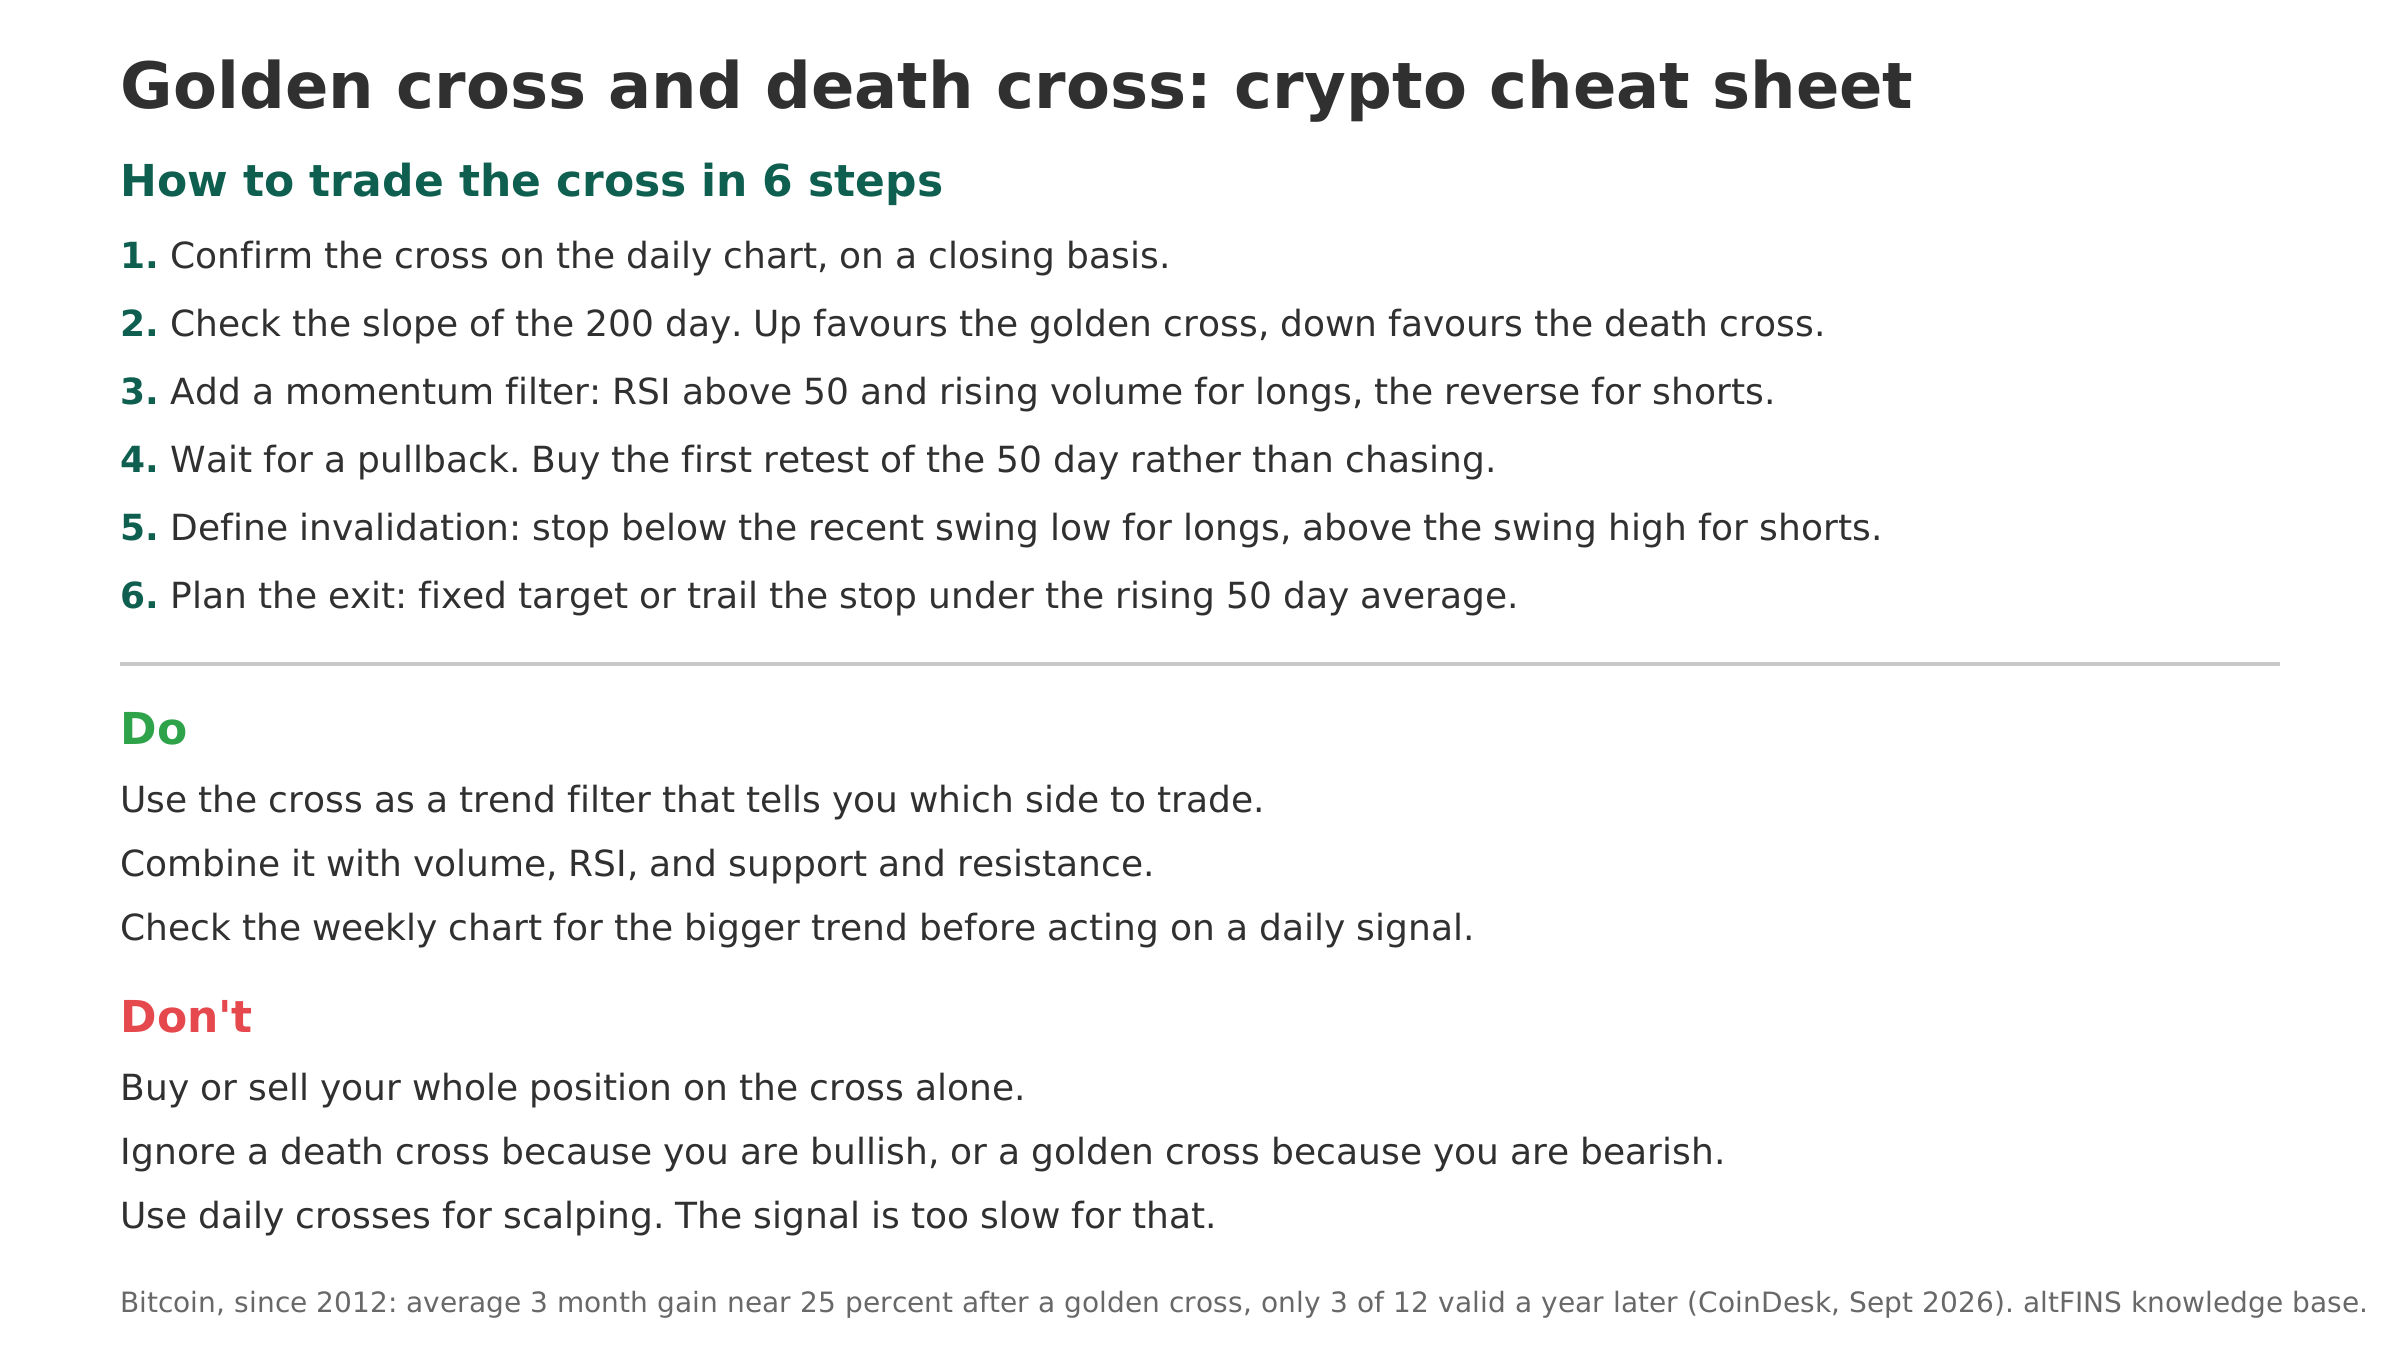
- Confirm the cross on the daily chart. Check that the 50 day has actually closed across the 200 day, not just touched it intraday.
- Check the slope of the 200 day. A golden cross with a flat or rising 200 day is stronger. A death cross with a falling 200 day is stronger.
- Add a momentum filter. For a golden cross, look for RSI holding above 50 and rising volume on green candles. For a death cross, look for RSI below 50 and rising volume on red candles.
- Wait for a pullback. After a golden cross, many traders buy the first retest of the 50 day average rather than chasing the breakout. After a death cross, they sell or hedge into a bounce toward the 50 day.
- Define your invalidation. Place a stop below the recent swing low for longs, or above the recent swing high for shorts and hedges. Decide the level before you enter.
- Plan the exit. Use a fixed profit taking plan or trail the stop under the rising 50 day average.
Do and don’t
- Do use the cross as a trend filter that tells you which side to trade.
- Do combine it with volume, RSI, and support and resistance.
- Do check the weekly chart for the bigger trend before acting on a daily signal.
- Don’t buy or sell your whole position on the cross alone.
- Don’t ignore a death cross just because you are bullish, or a golden cross just because you are bearish.
- Don’t use daily crosses for scalping, the signal is too slow for that.
Golden cross and death cross in September 2026
Takeaway: Bitcoin is printing its first golden cross in more than six months as of early September 2026.
Bitcoin’s 50 day moving average fell below its 200 day line in mid November 2025, with price near 100,000 dollars. That death cross held for roughly ten months, one of the longest such stretches on record, alongside the 2014, 2018, and 2022 episodes. In early September 2026, with Bitcoin trading near 80,000 dollars, the 50 day average crossed back above the 200 day line. Analysts tracked the confirmation around September 11, 2026, per CoinDesk reporting.
History says to treat it as a trend filter, not a promise. The average golden cross has led to a three month gain, but most did not last a year, and this one is firing while price is still well below the November 2025 highs. The practical read is that the medium term trend has flipped up, which favors buying pullbacks over shorting rallies, while risk management stays tight because the majority of past signals eventually failed. Verify the current 50 and 200 day levels on a live chart before you trade, since crypto data changes daily.
How altFINS helps you catch moving average crossovers
Takeaway: scan every coin for fresh 50 and 200 day crossovers instead of checking charts by hand.
Watching one Bitcoin chart is easy. Watching hundreds of altcoins for the same signal is not. The altFINS crypto screener lets you build a custom filter for coins where a shorter moving average has just crossed a longer one, then sort by volume, market cap, or momentum so the strongest setups rise to the top.
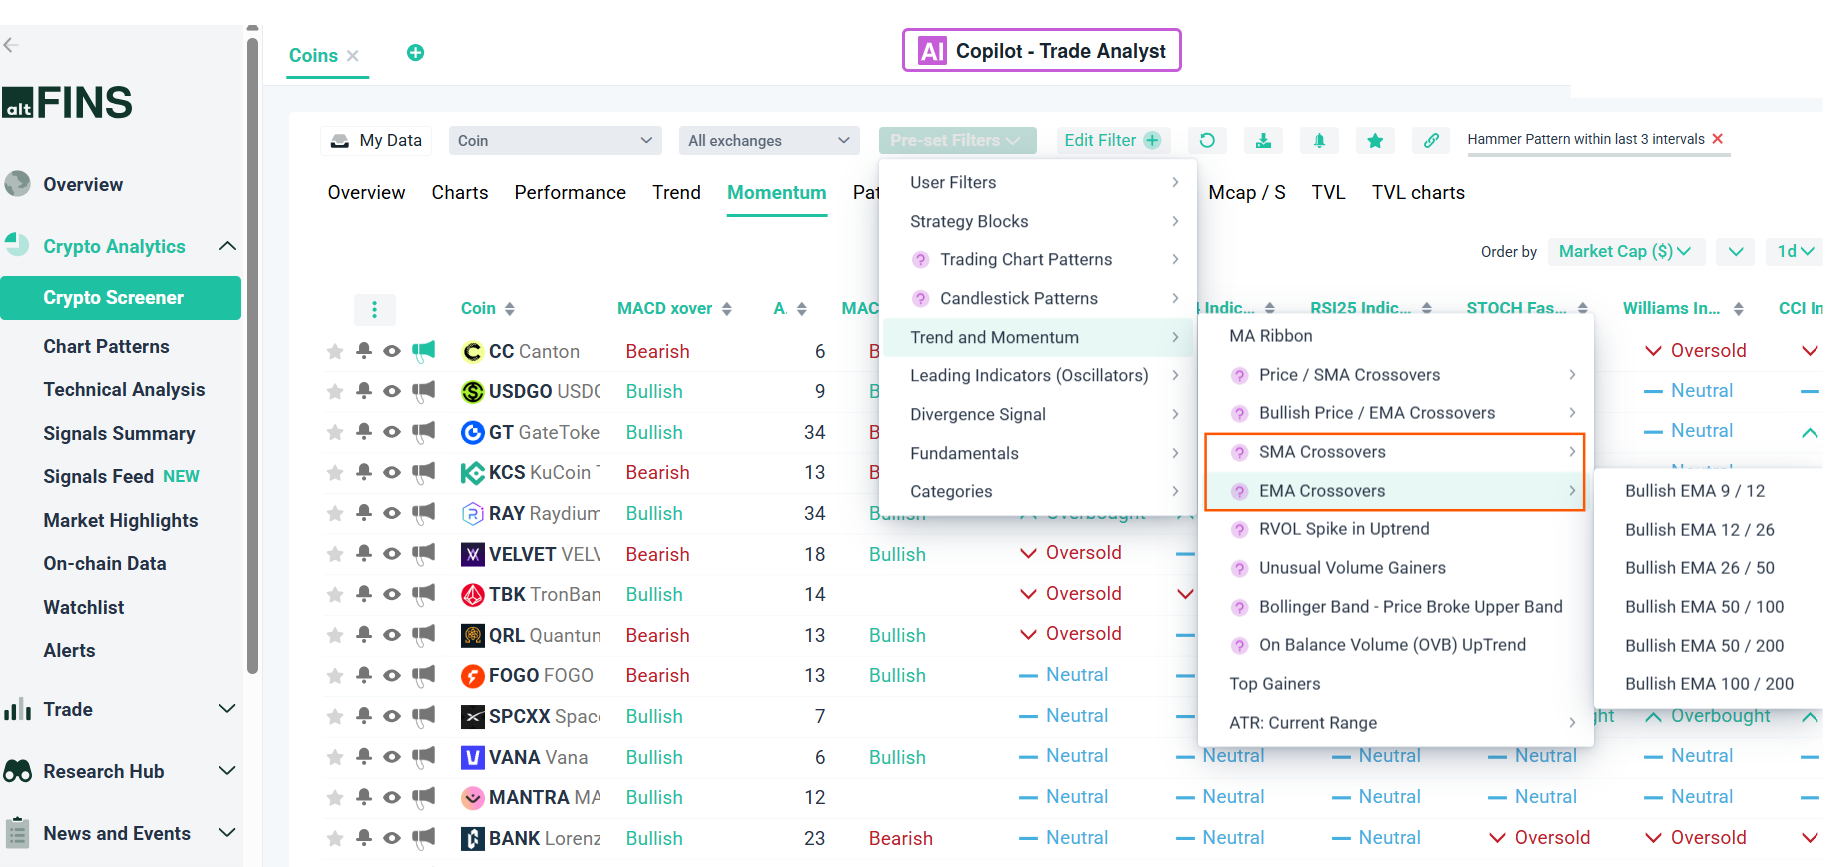
- Use the Signals Summary to see bullish and bearish EMA and SMA crossovers across four time frames in one view.
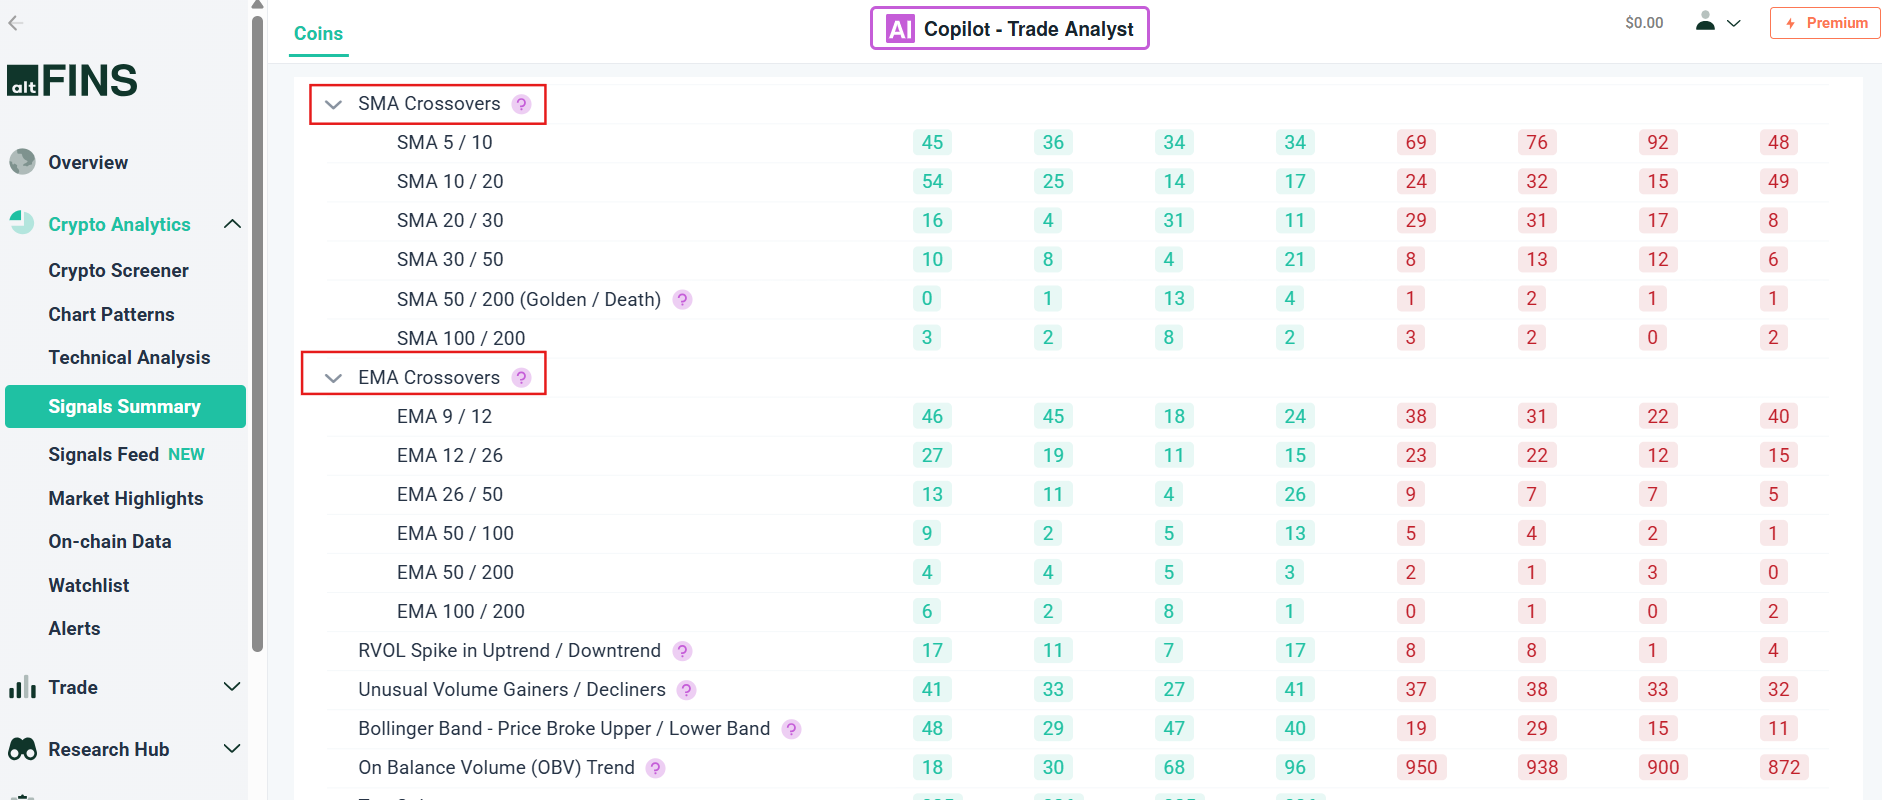
- Combine the crossover filter with an RSI or volume condition to screen out weak signals before you open a chart.
- Read the 200 day SMA guide and the EMA 12 and 50 crossover guide to pick the right average pair for your style.
- Set a price or indicator alert so you are notified the day a crossover confirms rather than a week later.
- Layer in moving average ribbons for a faster read on when a trend is strengthening or fading.
Frequently asked questions
Is a golden cross bullish or bearish?
A golden cross is bullish. It shows that the 50 day moving average has risen above the 200 day moving average, which means medium term momentum has turned positive relative to the long term trend. Traders use it as a sign that a longer term uptrend may be underway, though it confirms the move rather than predicting it.
Which moving averages are used for the golden cross and death cross?
The classic version uses the 50 day and the 200 day simple moving averages on the daily chart. Shorter term traders sometimes use the 20 and 50, or switch to exponential moving averages for a faster signal. The 50 and 200 day pair is the one referenced in most news headlines about Bitcoin.
How long does a golden cross take to confirm?
There is no fixed timer. The cross is confirmed the day the 50 day average closes above the 200 day average and holds. In practice, analysts often wait for one to three daily closes on the new side to avoid a whipsaw, and they check that the 200 day line is flattening or turning up.
Can a golden cross fail?
Yes, often. On Bitcoin, only about a quarter of golden crosses since 2012 were still valid a year later, per a September 2026 CoinDesk analysis. Failures are most common in sideways markets, where price chops back and forth and the averages cross again within weeks. This is why traders pair the signal with volume, RSI, and a defined stop loss.
Does the golden cross work in crypto?
It works as a trend filter, not as a precise entry. Crypto trends tend to run for months, so knowing whether the 50 day is above or below the 200 day helps you decide whether to favor longs or cash. It does not tell you the exact price to buy or sell, and it lags real turning points by weeks.
What is the difference between a golden cross and a death cross?
They are opposite readings of the same indicator. A golden cross is the 50 day moving average crossing above the 200 day, a bullish event. A death cross is the 50 day crossing below the 200 day, a bearish event. Both are lagging trend signals and both can produce false readings in choppy conditions.
Verdict
The golden cross and death cross are among the most watched signals in crypto because they are simple, visible, and tied to the two moving averages that most traders already follow. Their weakness is that they lag and they whipsaw in sideways markets. Used the right way, as a trend filter combined with volume, RSI, and disciplined risk control, they help you stay on the correct side of the long term trend. Used alone as buy and sell triggers, they will get you in late and out late.
The current setup is a live example: Bitcoin’s September 2026 golden cross tilts the medium term trend up, but the base rate says most signals fail, so position sizing and stops still matter more than the headline.
Scan the market for fresh crossovers. Build a 50 and 200 day moving average filter on the altFINS crypto screener, sort by volume, and set an alert so you catch the next golden or death cross on the day it confirms.
This article is for educational purposes only and is not financial, investment, or trading advice. Moving average crossovers are lagging indicators and frequently produce false signals. Crypto trading carries a high risk of loss, and past performance does not predict future results. All prices, moving average levels, and statistics were checked on 9 September 2026 and change quickly. Do your own research and consider speaking with a licensed financial professional before trading.
