

Search Knowledge Base by Keyword
Fair Value Gap (FVG) Explained: How to Spot and Trade Imbalances in Crypto
A fair value gap (FVG) is a three candle price pattern that shows where a crypto market moved so fast that buyers and sellers never traded across a whole price range. That untraded range is an imbalance, and price often returns to it later to “fill the gap” before continuing. Traders use fair value gaps as pullback entry zones and as support or resistance.
This guide explains what a fair value gap is, how to draw a bullish and a bearish FVG using the exact three candle rule, which time frames work best for crypto, and how to build an entry, stop loss and target around one. It also covers the inverse fair value gap, how an FVG differs from an order block, and how reliable the pattern actually is based on public backtests.
It is written for crypto traders who already know how to read a candlestick chart and want a clear, repeatable way to use imbalances. If you are brand new to charts, start with the altFINS guide to essential candlestick patterns first, then come back here.
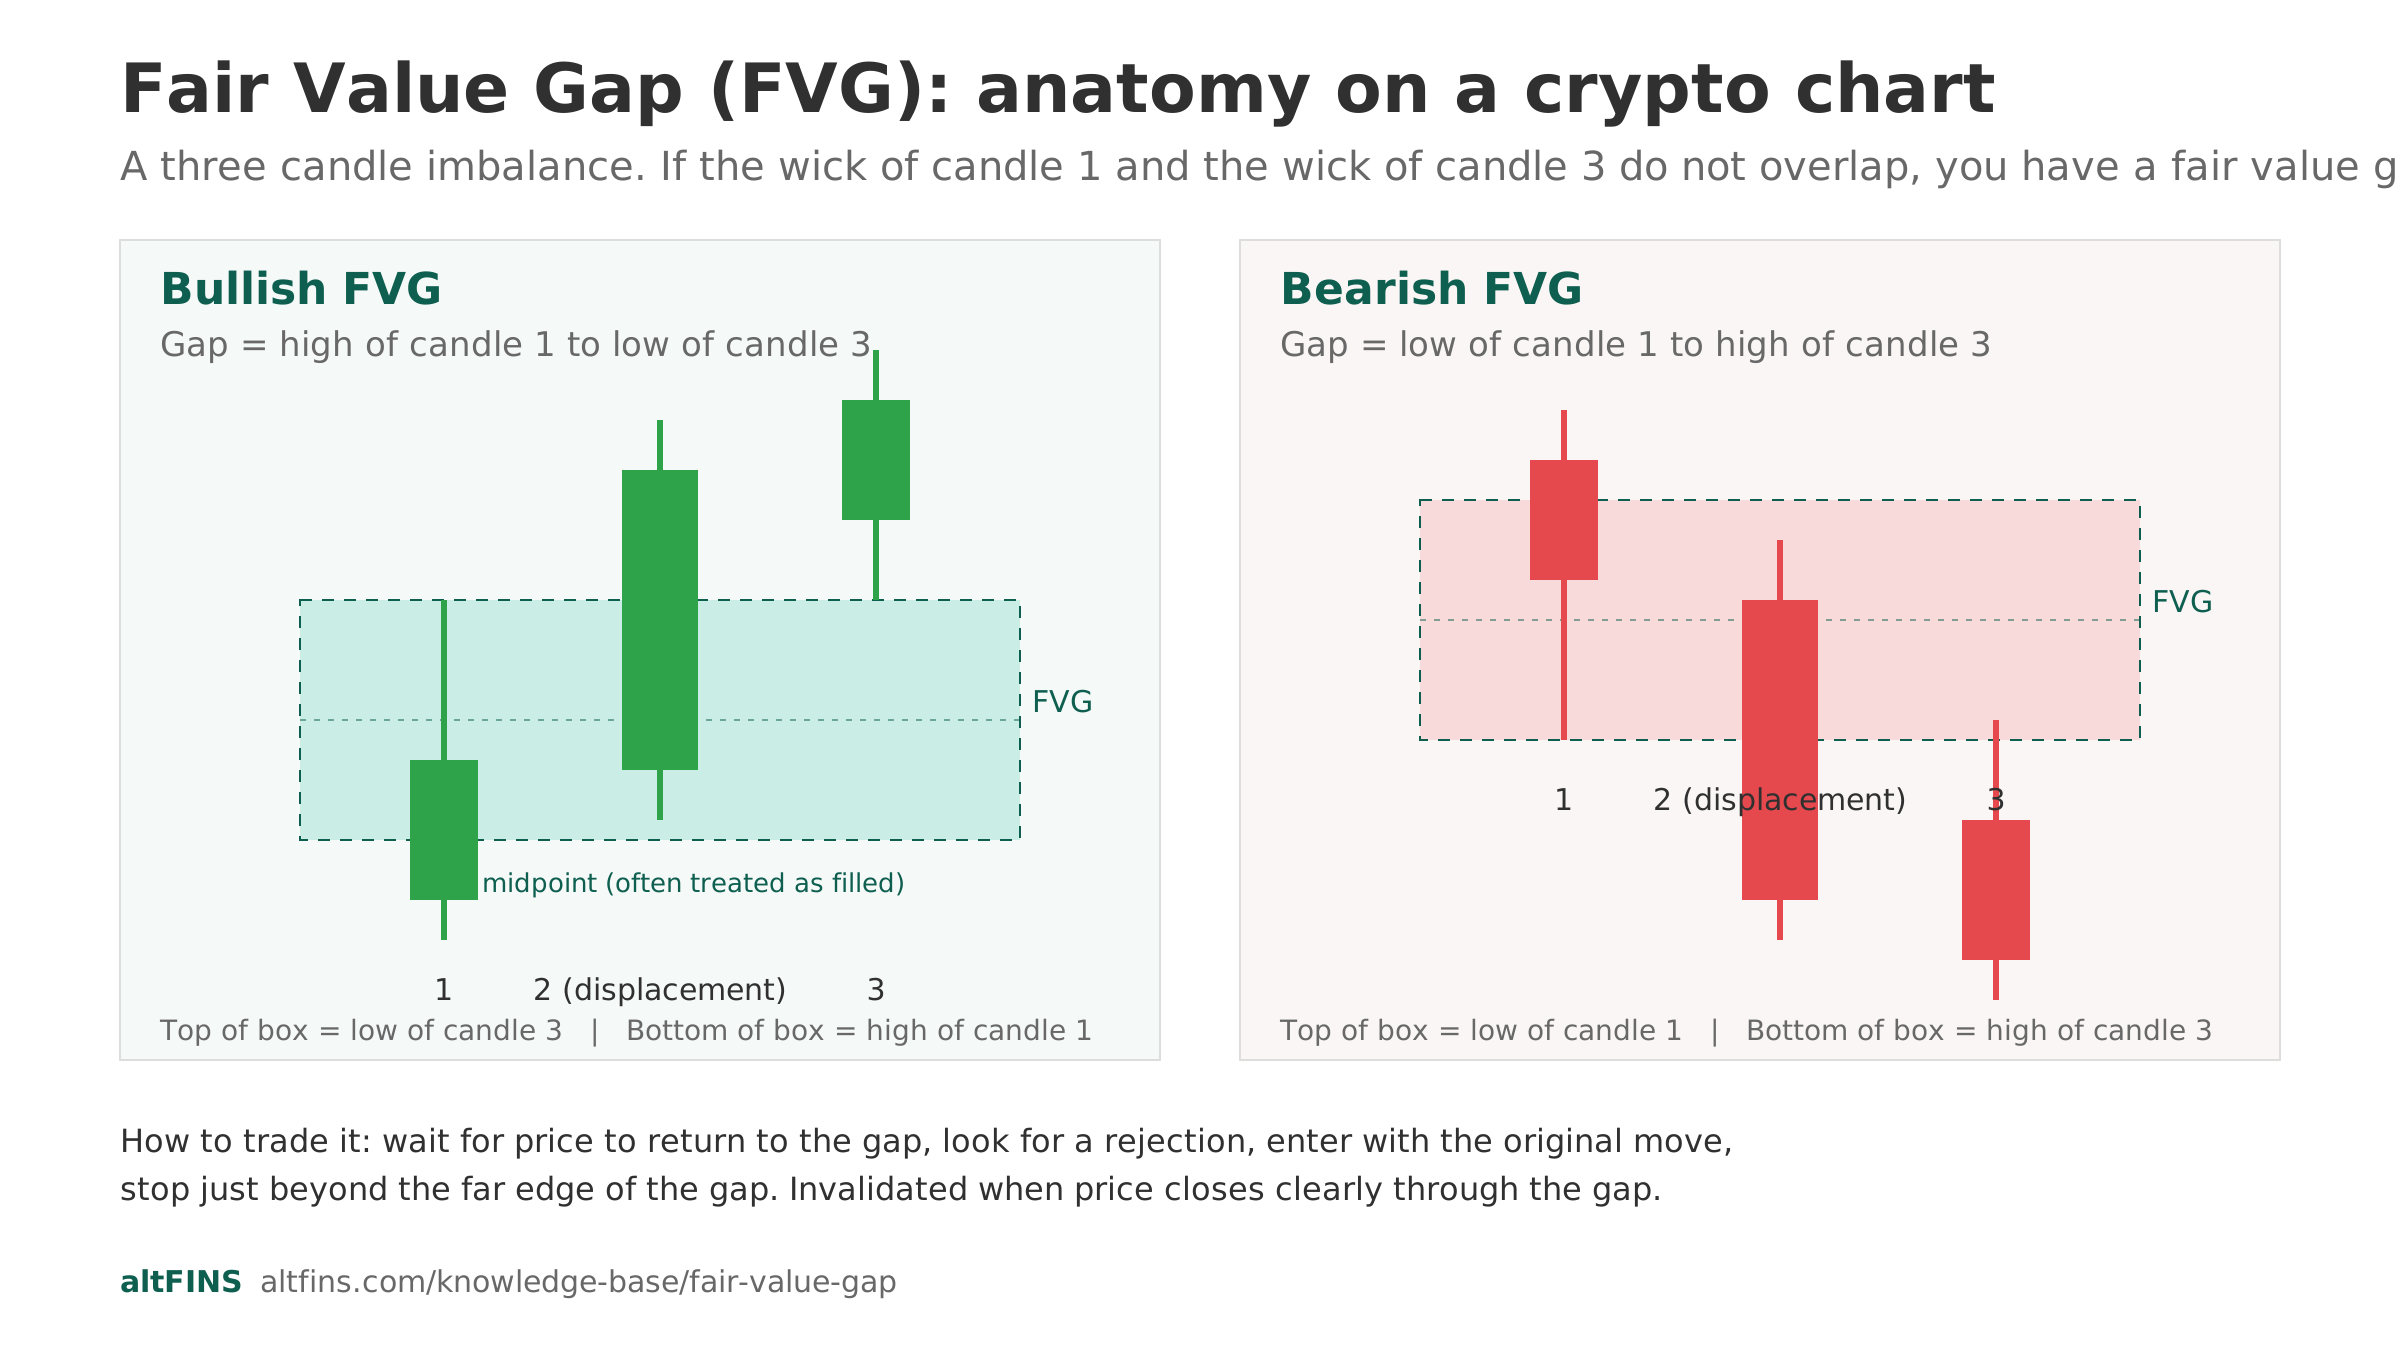
Quick answer: A fair value gap forms across three candles when the wick of candle 1 and the wick of candle 3 do not overlap, leaving a clean price range on candle 2. A bullish FVG is the gap between the high of candle 1 and the low of candle 3 during a strong up move. A bearish FVG is the gap between the low of candle 1 and the high of candle 3 during a strong down move. Most traders wait for price to return to the gap, look for a rejection, then enter in the direction of the original move with a stop just beyond the far edge of the gap.
What is a fair value gap?
A fair value gap is a visible imbalance left behind when price moves in one direction with very little two way trading. It is drawn as a box covering the price range that the middle candle of a fast three candle move “skipped”. The idea comes from the smart money concepts (SMC) and ICT style of price action analysis, where large orders push price quickly and leave gaps that the market later revisits to trade at a fairer price.
The takeaway: an FVG marks a price zone the market rushed through, and that zone often acts like a magnet and then a support or resistance level when price comes back.
The three candle rule
Every fair value gap uses three consecutive candles:
- Candle 1: the candle before the fast move. You use one of its wicks as a boundary.
- Candle 2: the large “displacement” candle that does most of the work. The gap lives inside this candle’s range.
- Candle 3: the candle after the fast move. You use one of its wicks as the other boundary.
If the wick of candle 1 and the wick of candle 3 overlap, there is no gap. If there is clear air between them, you have a fair value gap.
Bullish FVG vs bearish FVG
| Feature | Bullish fair value gap | Bearish fair value gap |
|---|---|---|
| Market context | Sharp move up (displacement higher) | Sharp move down (displacement lower) |
| Top of the gap box | Low of candle 3 | Low of candle 1 |
| Bottom of the gap box | High of candle 1 | High of candle 3 |
| How traders use it | Buy zone and support on a pullback | Sell or short zone and resistance on a pullback |
| Invalidated when | Price closes clearly below the gap | Price closes clearly above the gap |
Why fair value gaps form
Fair value gaps form when order flow is one sided for a short burst. A large market buy or a wave of stop losses being triggered can lift price through several levels before resting orders catch up. During that burst there is almost no trading on the opposite side, so the chart records a thin, fast candle with a gap around it.
In crypto this happens often around funding resets, liquidations, exchange listings, token unlocks and macro headlines. The order book thins out, a big order sweeps it, and the imbalance is printed. When conditions calm down, price often drifts back to that zone so the skipped orders can be filled. That return move is what gives the FVG its edge as an entry area.
How to identify a fair value gap on a crypto chart
Follow these steps on any candlestick chart. The takeaway: you are looking for one big candle with clean air on both sides.
- Find a large candle with a full, strong body. This is your displacement candle (candle 2).
- Look at the candle immediately before it (candle 1) and the candle immediately after it (candle 3).
- For a bullish setup, check whether the high of candle 1 sits below the low of candle 3. If it does, the space between them is your bullish FVG.
- For a bearish setup, check whether the low of candle 1 sits above the high of candle 3. If it does, the space between them is your bearish FVG.
- Draw a rectangle across that price range and extend it to the right so you can see when price returns.
- Mark the 50 percent line of the box. Many traders treat a tap of the midpoint as a filled gap.
- Note the trend on a higher time frame. Trade FVGs that point the same way as the higher time frame trend.
Which time frames work best
Higher time frame gaps are cleaner and get respected more often. Lower time frame gaps appear constantly and most are noise.
- Swing traders: 4 hour, daily and weekly charts. Daily gaps often fill within about 3 to 7 days in a normal market.
- Intraday traders: 15 minute and 1 hour charts, ideally aligned with the daily trend.
- Scalpers: 1 to 5 minute charts, but only during high volume sessions, and expect many failed gaps.
How to trade a fair value gap
The standard playbook is a pullback trade: wait for price to move away from the gap, come back to it, show a rejection, then enter with the original trend. The takeaway: the gap is the zone, the rejection is the trigger.
| Trade element | Bullish FVG (long) | Bearish FVG (short) |
|---|---|---|
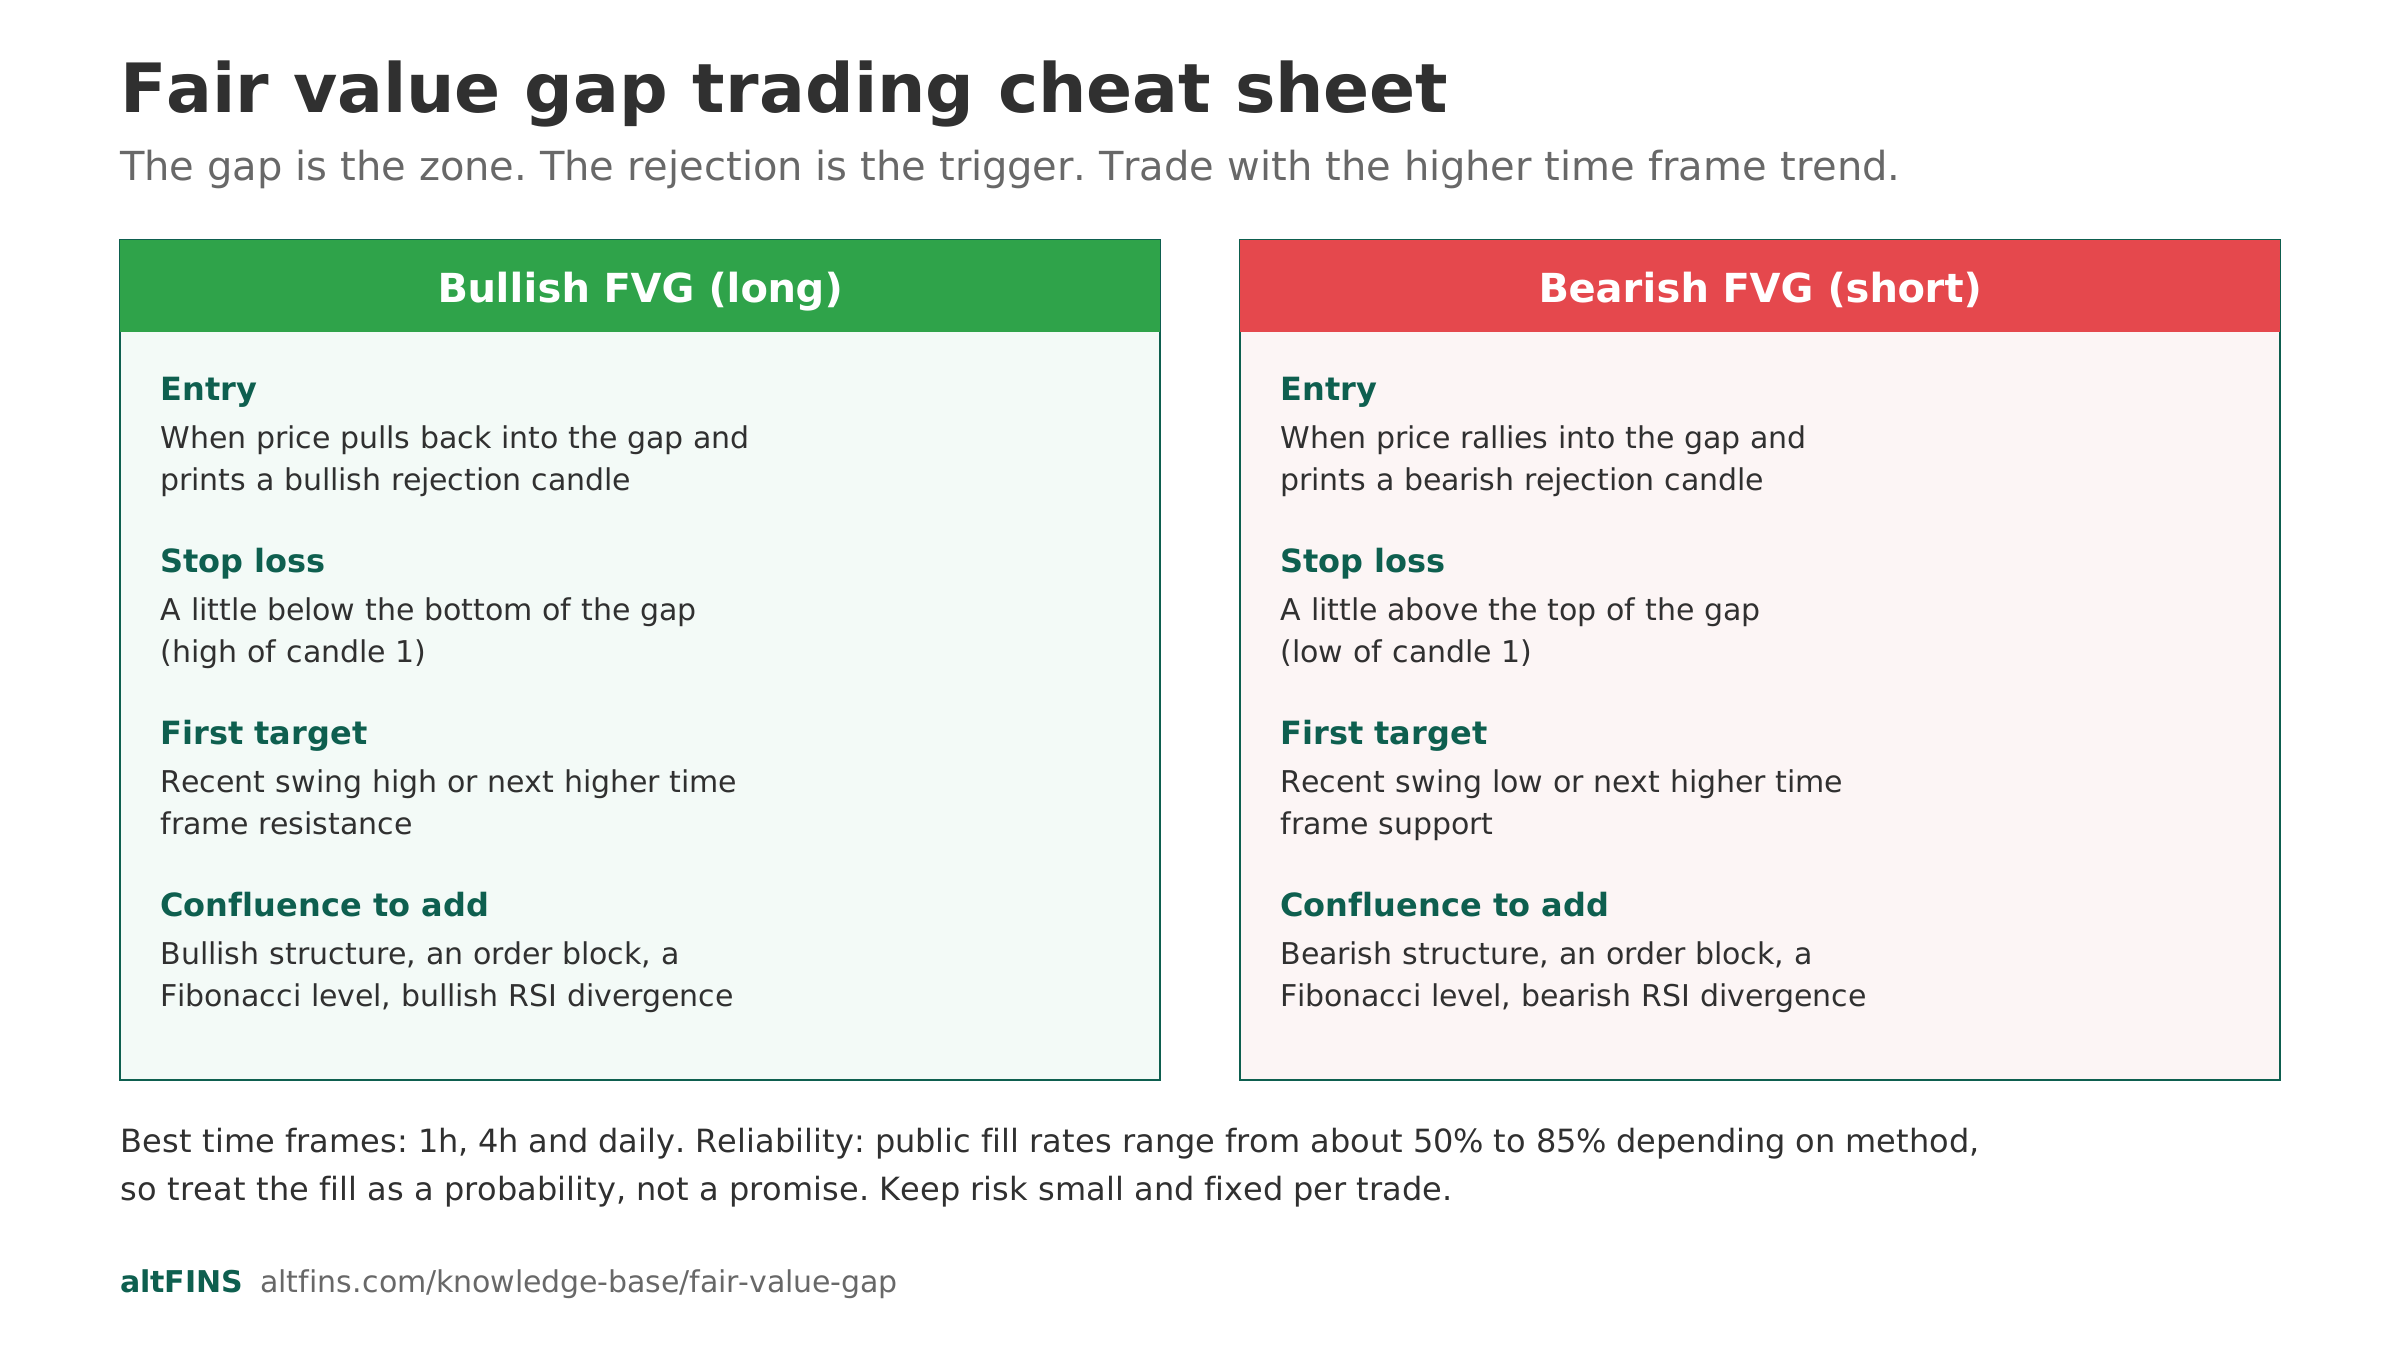
| Entry | When price pulls back into the gap and prints a bullish rejection candle | When price rallies into the gap and prints a bearish rejection candle |
| Stop loss | A little below the bottom of the gap (high of candle 1) | A little above the top of the gap (low of candle 1) |
| First target | The recent swing high or the next higher time frame resistance | The recent swing low or the next higher time frame support |
| Confluence to add | Bullish market structure, an order block, a Fibonacci level, bullish RSI divergence | Bearish market structure, an order block, a Fibonacci level, bearish RSI divergence |
Combine the gap with tools you already use. A bullish FVG that lines up with a horizontal support level and a bullish RSI divergence is a far stronger signal than a gap on its own. FVGs also pair well with recognised chart patterns such as bull flags and falling wedges.
Managing the trade
Move your stop to break even once price leaves the gap in your favour and clears the first minor structure. Take partial profit at the first target and trail the rest under each new higher low, or above each new lower high for shorts. Never risk more than a small fixed percentage of your account on one FVG trade, because plenty of gaps fail.
Inverse fair value gap (IFVG)
An inverse fair value gap is a gap that failed. If price trades all the way through a bullish FVG and closes below it, that former support flips into resistance. The old bullish gap is now an inverse fair value gap, and traders look to sell rallies back into it. The reverse is true for a broken bearish gap that flips into support.
The IFVG is useful because it tells you the short term order flow has changed. A bullish gap that gets erased quickly is a sign that sellers are in control, and fading the next bounce into that zone can be a high probability trade when it agrees with the higher time frame.
Fair value gap vs order block vs liquidity void
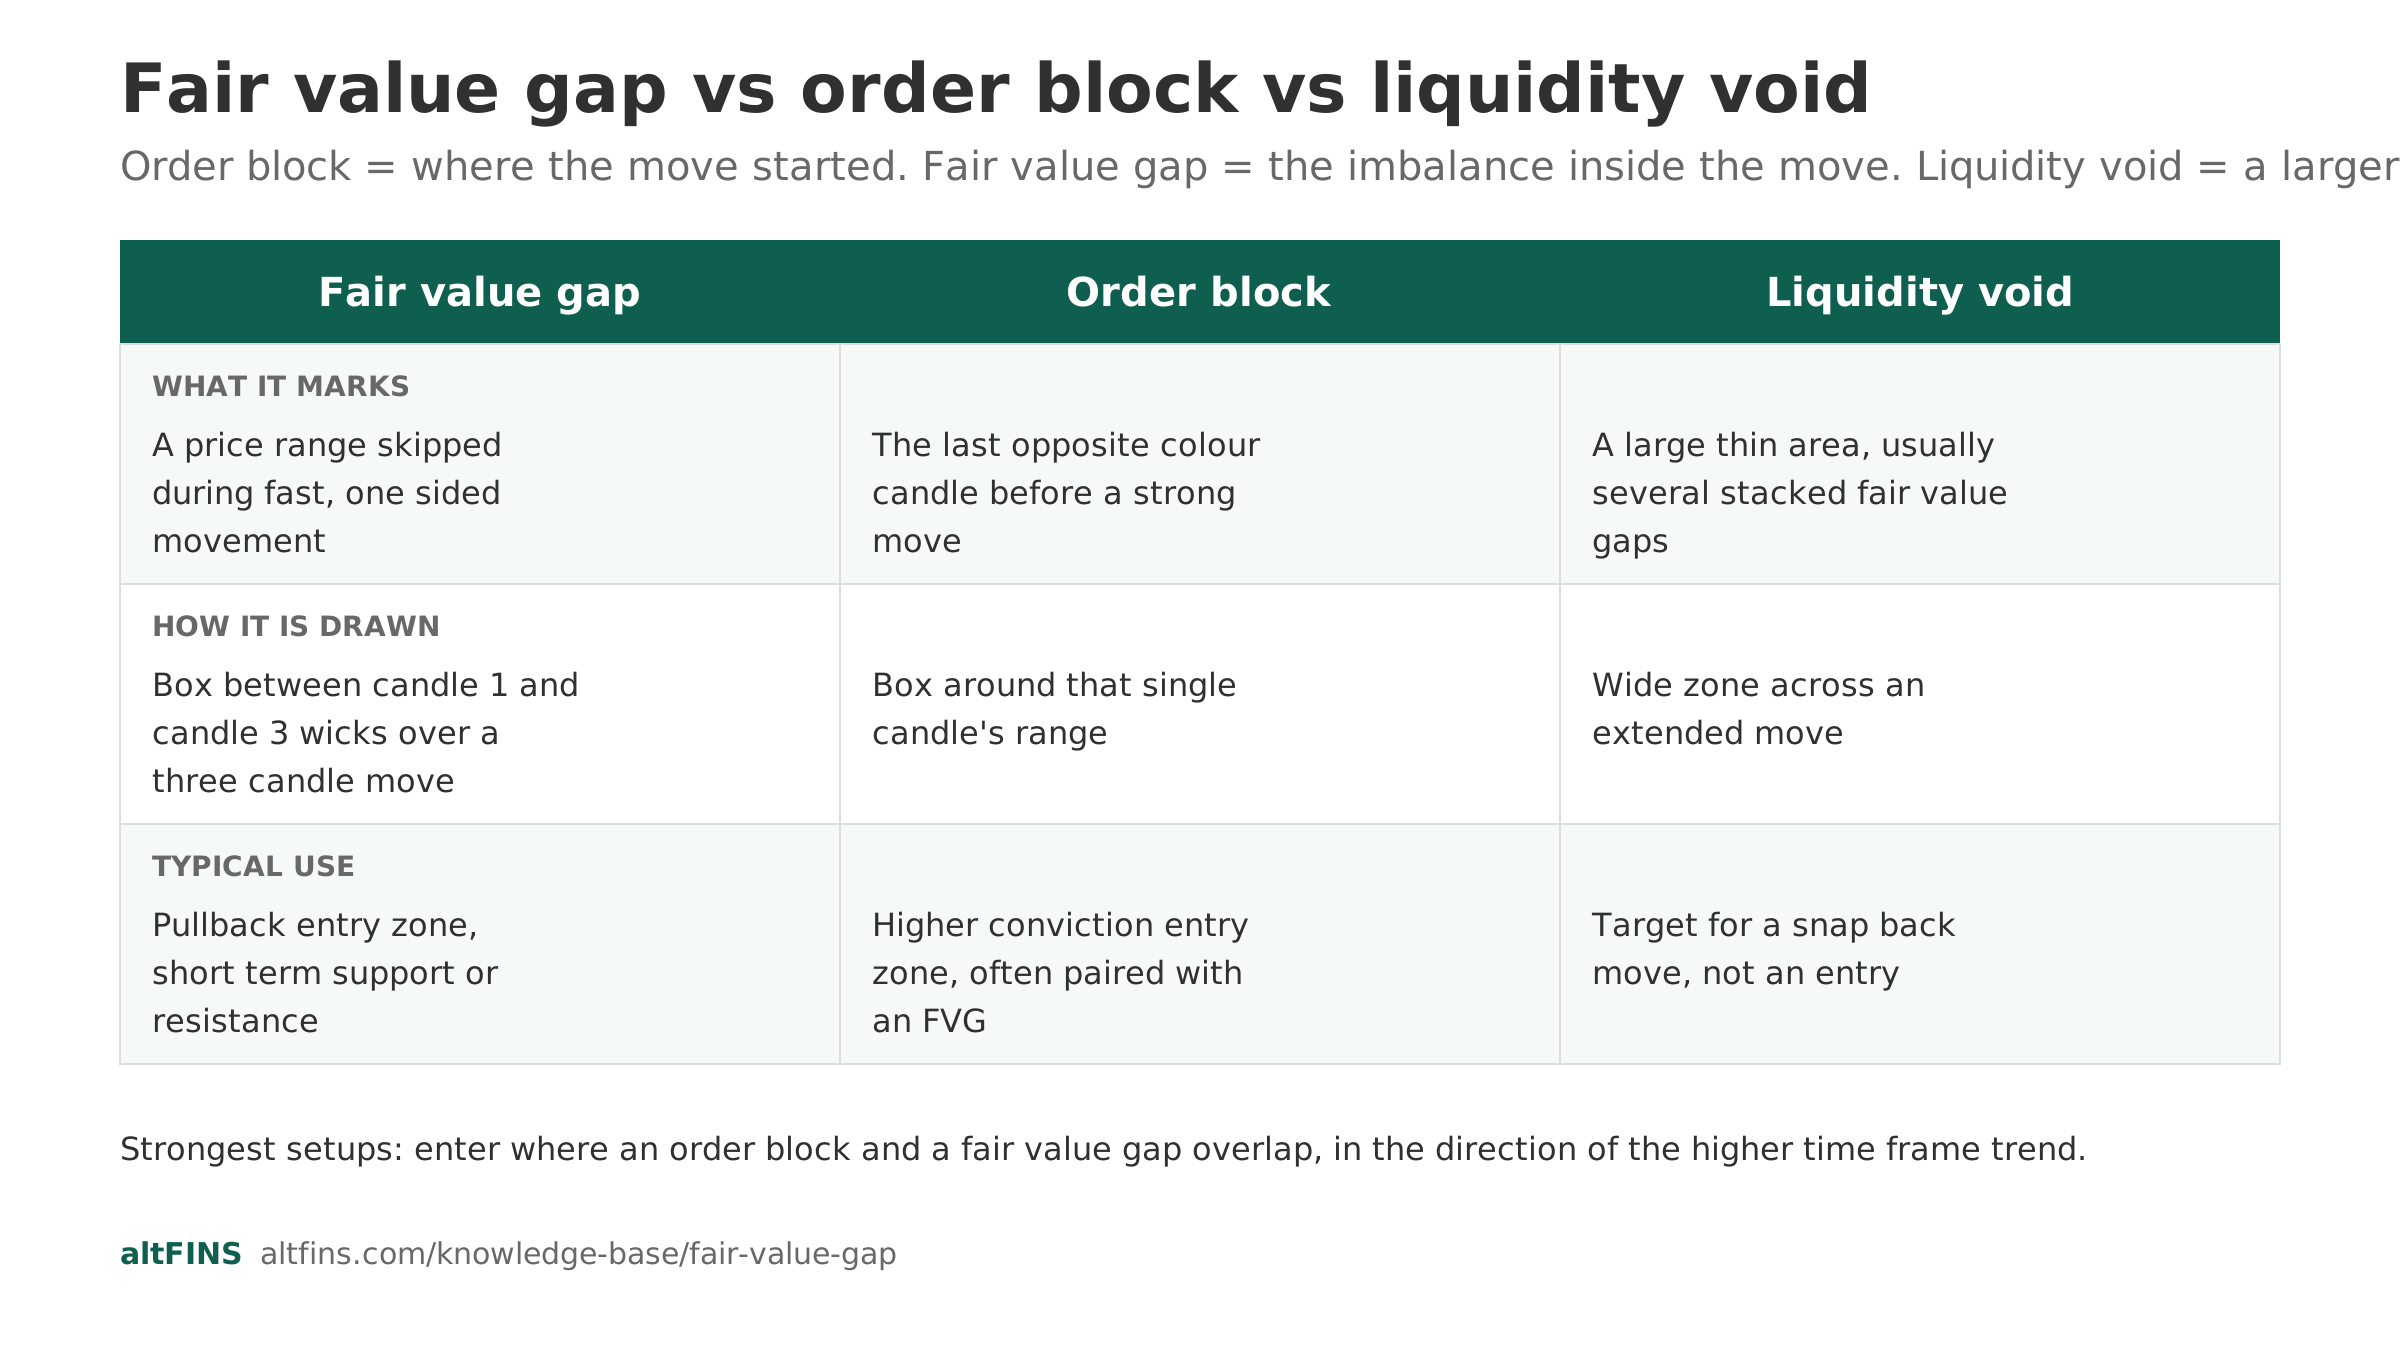
These three smart money terms describe related but different things. The takeaway: an order block is where the move started, the fair value gap is the imbalance inside the move, and a liquidity void is a larger empty zone made of several gaps.
| Concept | What it marks | How it is drawn | Typical use |
|---|---|---|---|
| Fair value gap | A price range skipped during fast, one sided movement | Box between candle 1 and candle 3 wicks over a three candle move | Pullback entry zone, short term support or resistance |
| Order block | The last opposite colour candle before a strong move | Box around that single candle’s range | Higher conviction entry zone, often paired with an FVG |
| Liquidity void | A large thin area, usually several stacked FVGs | Wide zone across an extended move | Target for a snap back move, not an entry |
How reliable are fair value gaps?
Fill rates depend heavily on how you define a “fill” and which market and time frame you test. Reported numbers vary widely, so treat the pattern as a probability tool, not a guarantee.
- Smart money focused write ups often quote a broad 70 to 85 percent fill rate for FVGs, per an edgeful best practices guide that also reports over 60 percent win rates on selective setups.
- More conservative large sample analysis suggests only about half of valid three candle gaps see a full close, while a clear majority get at least an initial tap or a 50 percent fill.
- Daily gaps tend to fill within days. Gaps that form inside a strong trend can stay open for a long time, which is exactly why higher time frame trend alignment matters.
The practical reading: expect price to revisit most gaps in some form, expect a meaningful share to fail, and only trade the ones with extra confluence.
Do’s and don’ts of FVG trading
| Do | Don’t |
|---|---|
| Trade gaps in the direction of the higher time frame trend | Fade a strong daily trend using a 5 minute gap |
| Wait for a rejection candle inside the gap | Enter with a limit order and no confirmation |
| Require confluence such as an order block, level or divergence | Treat every three candle gap as a trade |
| Keep risk small and fixed per trade | Add size because “the gap has to fill” |
| Mark gaps as invalid once price closes through them | Hold a losing trade hoping the gap comes back |
How altFINS helps you find in trading
altFINS is built for exactly this kind of workflow: find the setup fast, then confirm it with structure and momentum.
- Use the crypto screener to shortlist coins in a strong trend with a recent momentum surge, which is where clean displacement candles and fair value gaps appear.
- Open the full size charting and technical analysis view to draw the gap box, mark the midpoint and check the higher time frame trend.
- Cross check with automatically detected chart patterns and with trading signals so your gap trade agrees with the wider picture.
- Set a price alert at the top and midpoint of the gap so you are notified the moment price returns, instead of watching charts all day.
Frequently asked questions
What is a fair value gap in simple terms?
It is a price range that the market moved through so quickly that trading only happened on one side. On the chart it looks like a gap between the wicks of the first and third candle of a fast three candle move. Traders expect price to come back and trade inside that range later.
How do you identify a fair value gap?
Find a large candle, then compare the candle before it and the candle after it. If the first candle’s high is below the third candle’s low, that space is a bullish FVG. If the first candle’s low is above the third candle’s high, that space is a bearish FVG. Draw a box across the range.
Do fair value gaps always get filled?
No. Public analysis puts full fill rates anywhere from about 50 percent to 85 percent depending on the method, market and time frame. Most gaps get at least a partial tap, but a significant number are never fully closed, especially gaps that form inside a strong trend.
What is the best time frame for fair value gaps?
For most crypto traders the 1 hour, 4 hour and daily charts give the cleanest gaps with the fewest false signals. Lower time frames produce many gaps but most are noise. A good rule is to find the gap on the daily and refine the entry on the 1 hour.
What is the difference between a fair value gap and an order block?
An order block is the last opposite colour candle before a strong move, so it marks where the move began. A fair value gap is the imbalance left inside the move itself. Many traders enter where an order block and a fair value gap overlap, because that zone has both meanings at once.
Is fair value gap trading profitable?
It can be, but only as part of a full plan with trend alignment, confluence, confirmation and strict risk control. On its own an FVG is just a zone. Selective setups with extra confluence have shown win rates above 60 percent in some public guides, while random gap trading tends to break even or lose after fees.
Verdict
A fair value gap is one of the most practical smart money tools because the rule is objective: three candles, no wick overlap, draw the box. Used well, it gives you a clear zone to plan a pullback entry, a logical stop just past the far edge, and a target at the next structure. Used badly, it becomes an excuse to catch falling knives. Keep it aligned with the higher time frame trend, demand confluence, and treat the fill as a probability rather than a promise.
Put it into practice: Open the altFINS crypto screener, filter for coins in a strong uptrend with rising momentum, then mark the most recent fair value gap on the 4 hour chart and set an alert at its midpoint.
This article is for educational purposes only and is not financial, investment or trading advice. Crypto trading carries a high risk of loss and is not suitable for everyone. Fill rate figures are drawn from third party analyses that use different methods and time periods, and past performance does not predict future results. Always do your own research and never risk money you cannot afford to lose.
