

Search Knowledge Base by Keyword
Hidden Divergence in Crypto Trading: How to Spot Trend Continuation Signals
Most traders learn regular divergence first and assume that any gap between price and an indicator means a reversal is coming. Hidden divergence works the opposite way. It shows up inside a healthy trend, during a normal pullback, and tells you the move is probably not over yet.
This guide is for crypto traders who already use RSI or MACD and want a second signal to help them hold a position through a pullback instead of closing it too early, and for anyone learning technical analysis who keeps seeing the term “hidden divergence” and wants a plain explanation with real rules.
You will get exact rules for bullish and bearish hidden divergence, a side by side comparison with regular divergence, worked examples using current Bitcoin and Ethereum price action, a confirmation checklist, and how to scan for these setups automatically on the altFINS crypto screener.
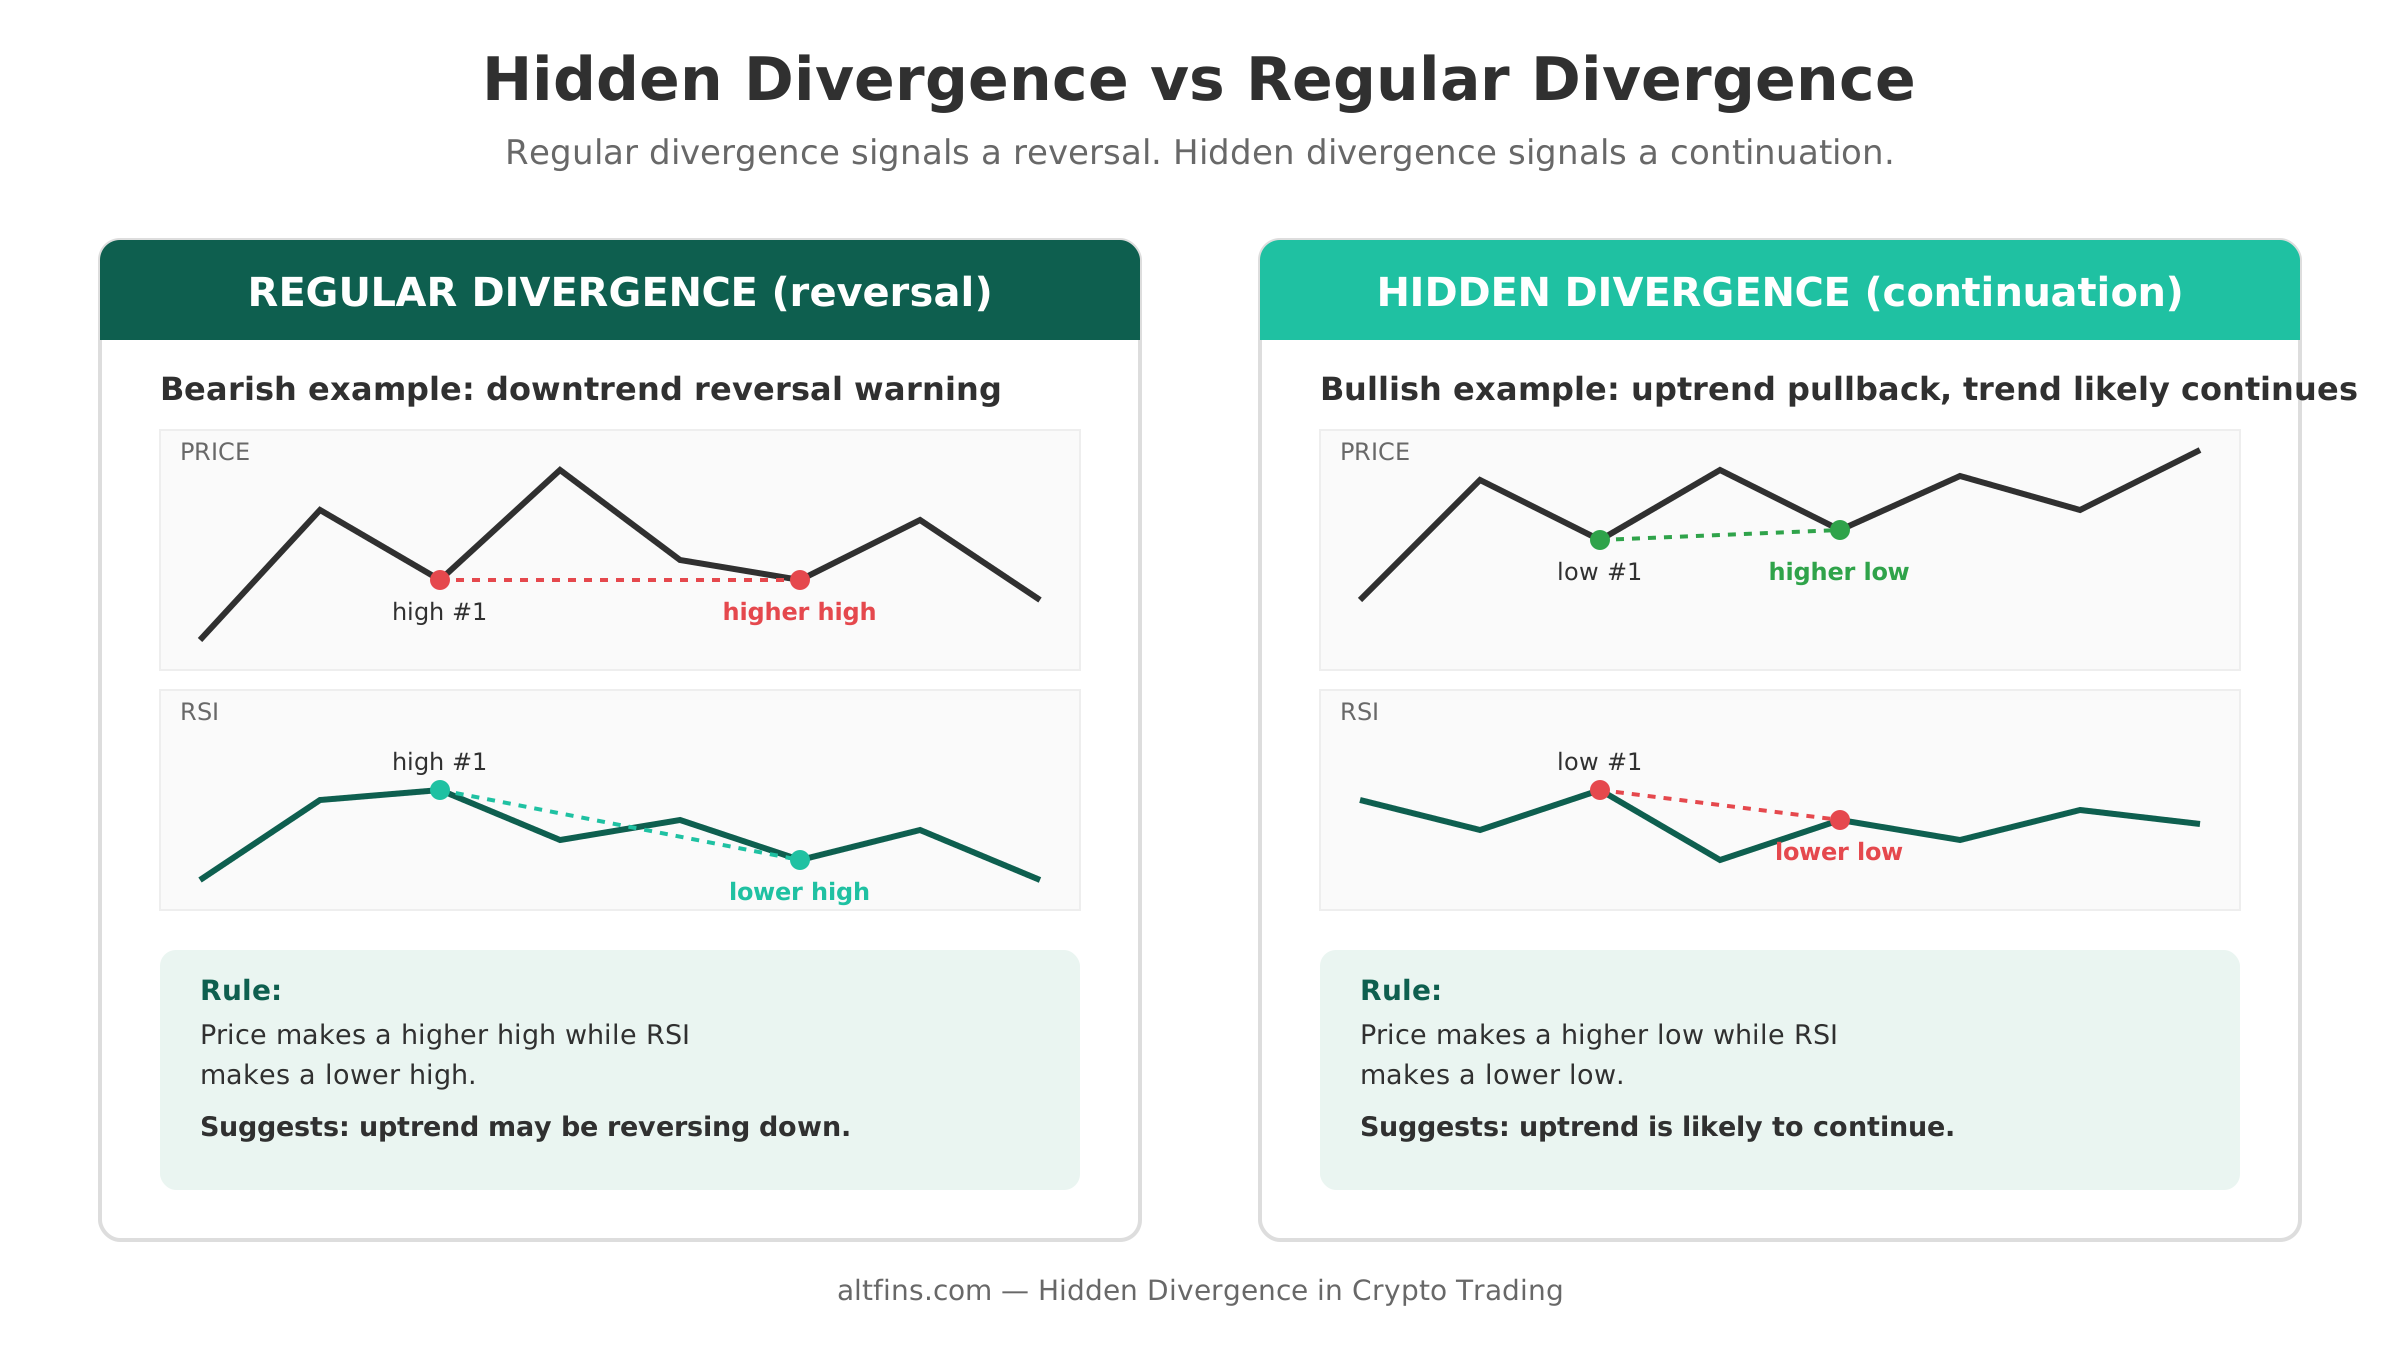
Quick answer: Hidden divergence happens when price and an oscillator like RSI or MACD move in different directions during a pullback inside an existing trend, and it signals that the trend is likely to continue. Bullish hidden divergence forms when price prints a higher low but RSI prints a lower low during an uptrend. Bearish hidden divergence forms when price prints a lower high but RSI prints a higher high during a downtrend. It is the mirror image of regular divergence, which warns of reversals instead of continuations.
What is hidden divergence?
One-line takeaway: hidden divergence confirms a trend is still intact, while regular divergence warns that it may be ending.
Divergence is any disagreement between the price of an asset and a momentum oscillator, most commonly the Relative Strength Index (RSI) or the Moving Average Convergence Divergence (MACD) indicator. When price and the oscillator move in the same direction, the trend is confirmed. When they disagree, traders pay attention because it often marks a shift in momentum.
There are two families of divergence. Regular divergence appears at trend extremes and warns of a possible reversal. Hidden divergence appears in the middle of a trend, usually during a retracement, and suggests the dominant trend still has momentum left. Both can be measured on RSI, MACD, or Stochastic RSI, and both apply equally to Bitcoin, Ethereum, and altcoins since the math behind the indicators does not change by asset.
Hidden divergence vs regular divergence
One-line takeaway: regular divergence signals a possible reversal, hidden divergence signals a likely continuation.
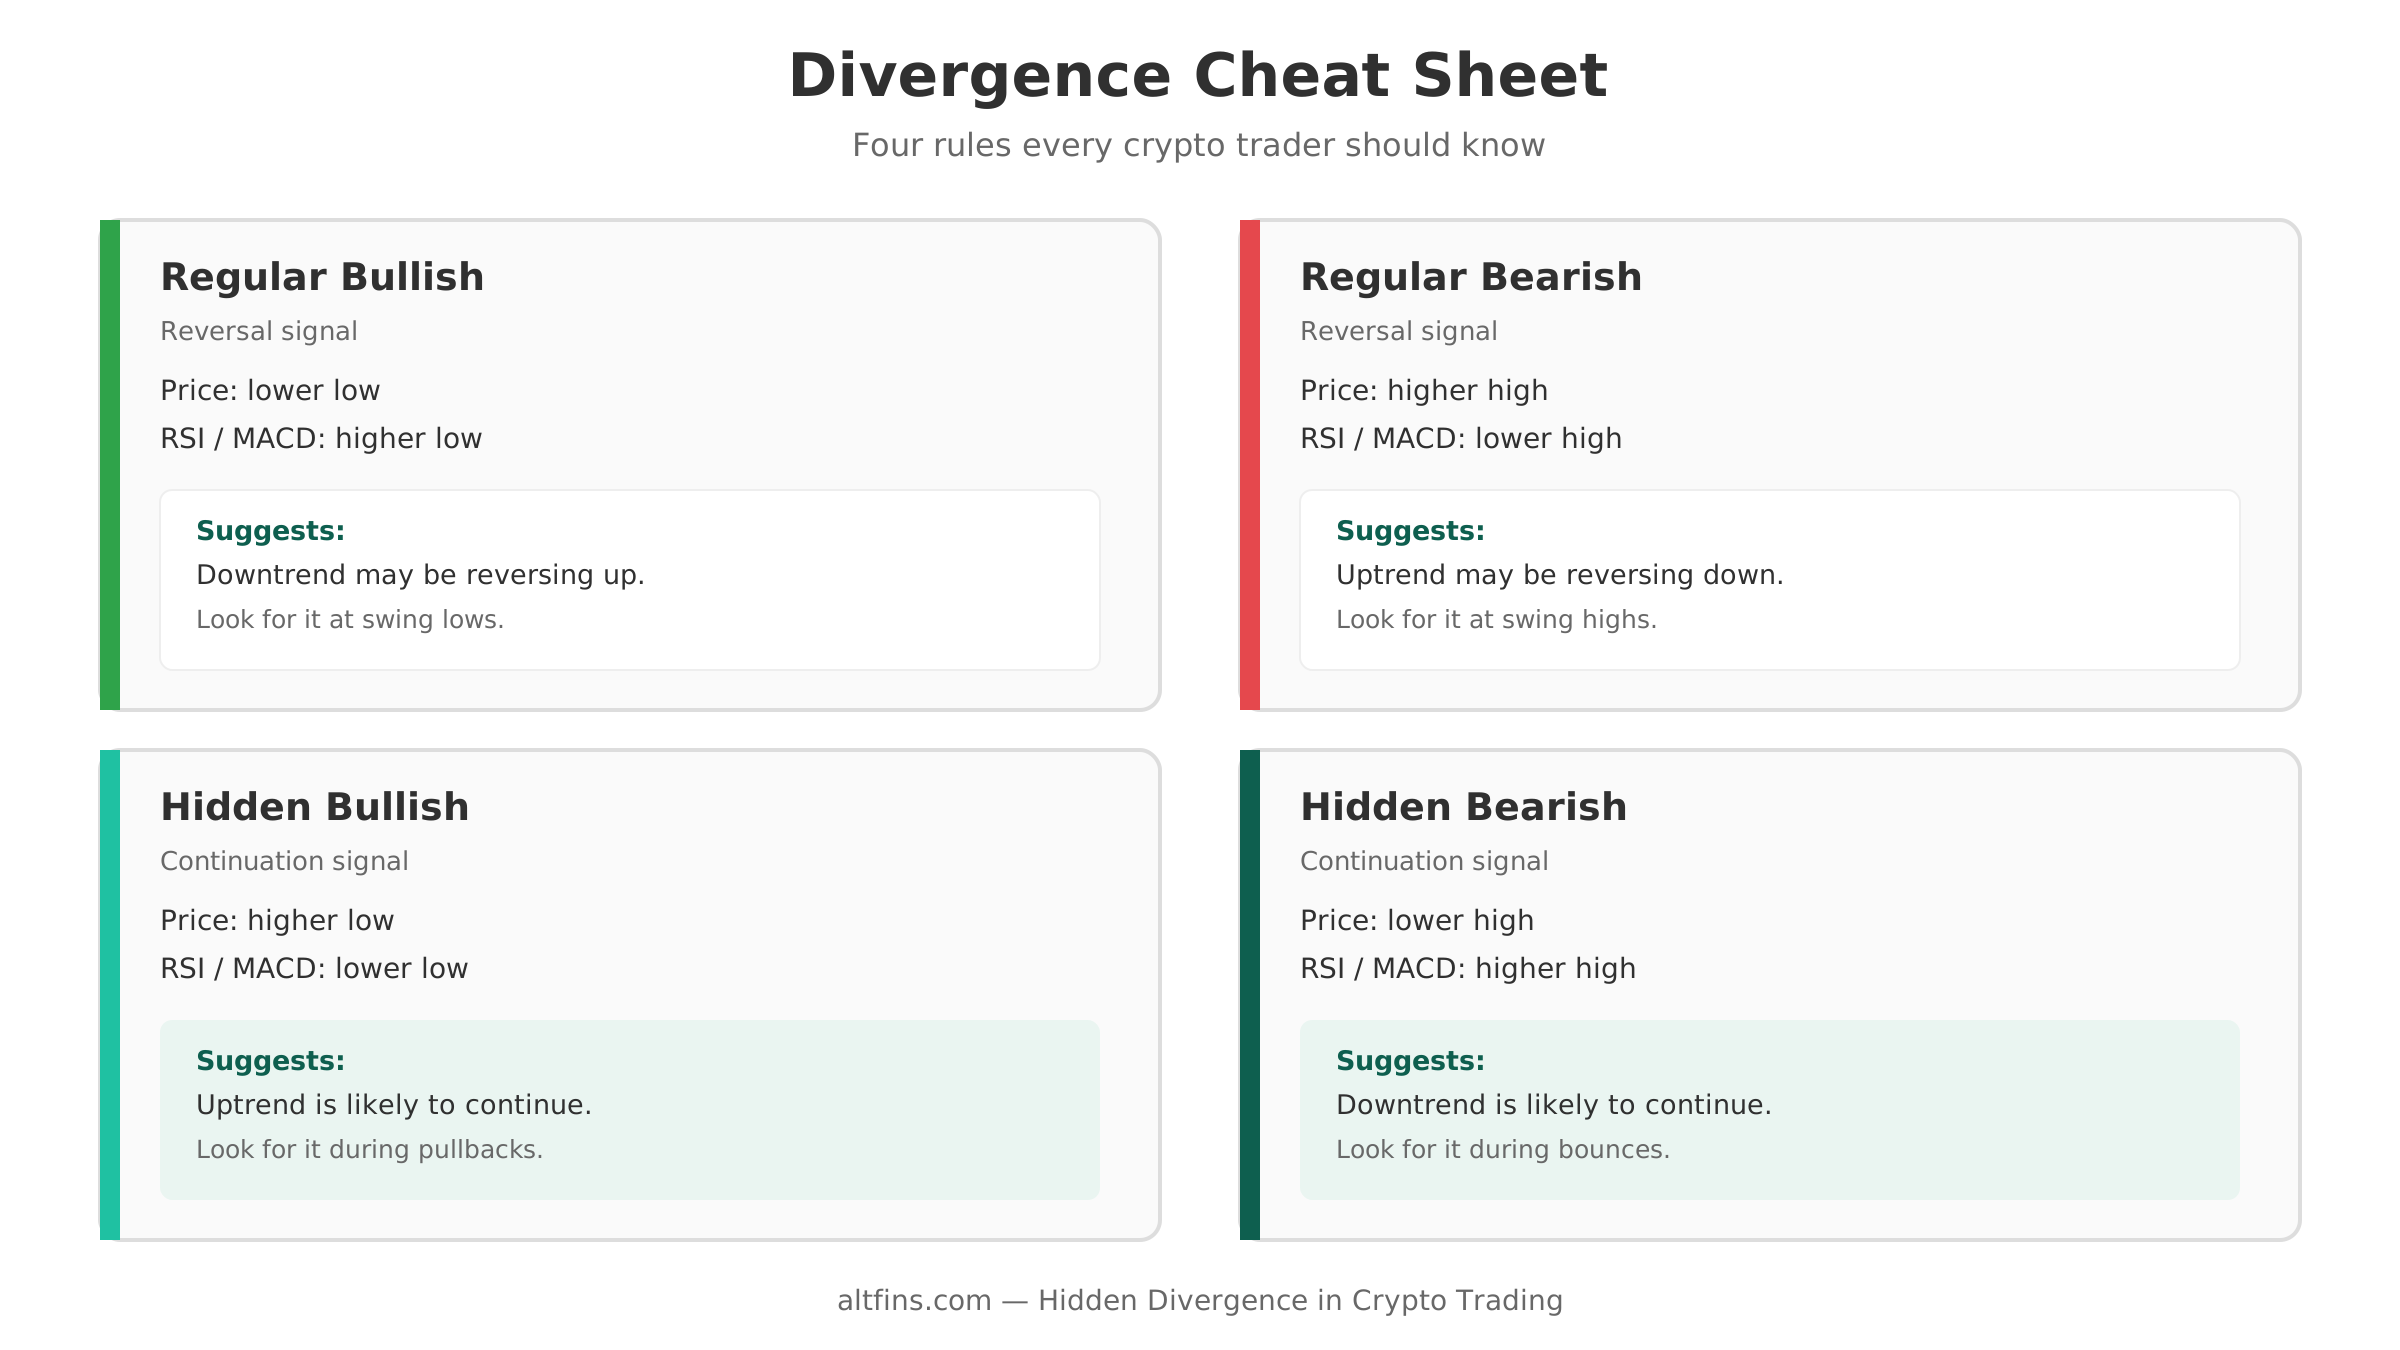
| Signal | What price does | What the oscillator does | What it suggests |
|---|---|---|---|
| Regular bullish | Lower low | Higher low | Downtrend may be reversing up |
| Regular bearish | Higher high | Lower high | Uptrend may be reversing down |
| Hidden bullish | Higher low | Lower low | Uptrend likely to continue |
| Hidden bearish | Lower high | Higher high | Downtrend likely to continue |
For a deeper look at the reversal side of this table, see altFINS’s guide to trading RSI and RSI divergence, which covers regular bullish and bearish divergence in detail.
Bullish hidden divergence explained
One-line takeaway: a higher low in price against a lower low in RSI, seen during an uptrend pullback, favors the trend resuming upward.
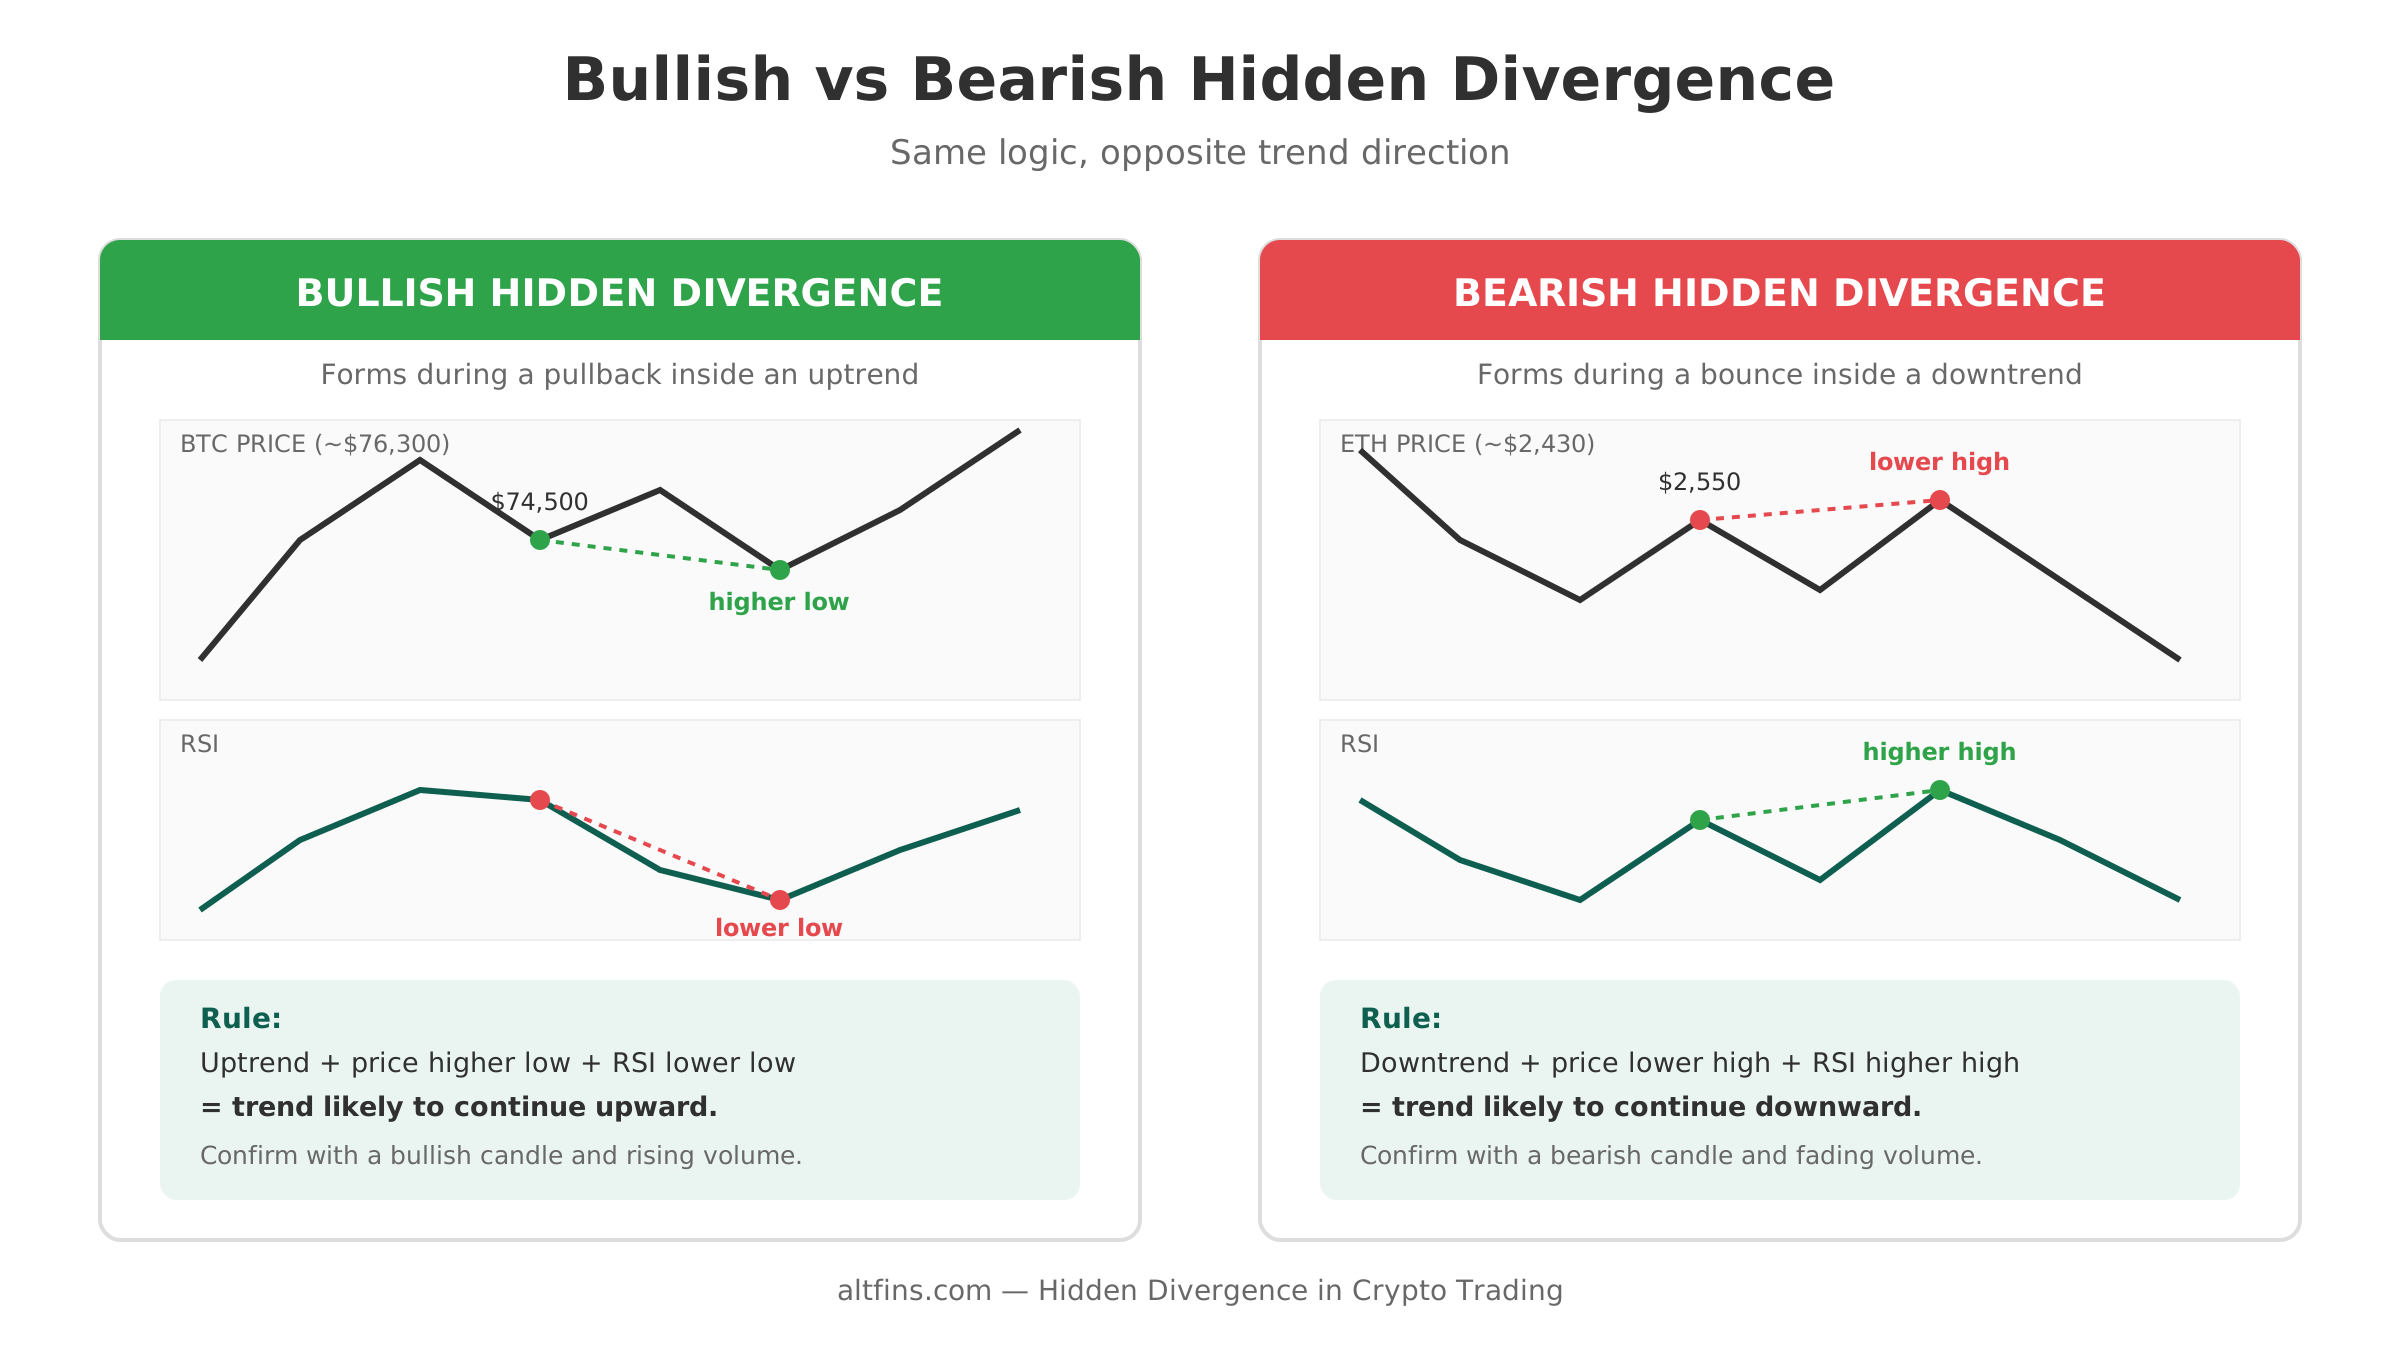
Bullish hidden divergence forms when an asset is in an established uptrend, pulls back, and prints a higher low on the price chart while RSI or MACD prints a lower low at the same time. That disagreement looks bearish on the surface, since the oscillator is weaker than before, but in context it usually means sellers ran out of strength during the dip and buyers stepped back in earlier than the indicator implied.
Bitcoin trades near $76,300 as of this writing. Picture BTC rallying from $70,000 to $80,000, pulling back to $76,000, then holding above $74,500 on the next dip, a higher low on price. If RSI reads a lower value on that second dip than it did on the first one, that is bullish hidden divergence, and traders who spot it often look to re-enter long rather than assume the uptrend is finished.
How to confirm bullish hidden divergence
- Wait for the pullback low to close above the prior higher low on the candle body, not just the wick.
- Check that the higher low lands near a known support level rather than in open air.
- Look for a bullish reversal candlestick, such as a hammer or bullish engulfing pattern, at the low.
- Confirm rising volume on the bounce off the higher low, not just on the initial rally.
Bearish hidden divergence explained
One-line takeaway: a lower high in price against a higher high in RSI, seen during a downtrend bounce, favors the trend resuming downward.
Bearish hidden divergence is the mirror case. An asset is in a downtrend, bounces, and prints a lower high on price while RSI or MACD prints a higher high. The oscillator looks stronger than before, which seems bullish, but the failure of price to reach its prior high suggests the bounce is a relief rally inside a downtrend rather than a genuine reversal.
Ethereum trades near $2,430 as of this writing. If ETH drops from $2,800 to $2,300, bounces to $2,550, drops again, then only bounces to $2,480 on the next attempt, that second bounce is a lower high on price. If RSI registers a higher reading on that second bounce than the first, that combination is bearish hidden divergence, and it warns that sellers likely still control the trend.
How to confirm bearish hidden divergence
- Confirm the lower high sits below the prior swing high, with the candle body making the point, not a wick spike.
- Check for a bearish candlestick, such as a shooting star or bearish engulfing pattern, forming at the lower high.
- Look for the bounce to stall at a resistance zone, a declining moving average, or a Fibonacci retracement level.
- Watch for volume to fade on the bounce, which supports the idea that buyers are losing conviction.
Hidden divergence on RSI vs MACD
One-line takeaway: the rules are identical on both indicators, but MACD reacts slower and filters out more noise.
RSI hidden divergence
RSI is the most common tool for spotting hidden divergence because it reacts quickly and its 0 to 100 scale makes the higher low or lower high easy to read at a glance. Unlike regular divergence, you do not need RSI to be in overbought or oversold territory for a hidden divergence signal, since it typically forms in the middle of the range during a pullback. Learn more about RSI Divergence.
MACD hidden divergence
On MACD, look at either the MACD line or the histogram against price. Because MACD is built from two moving averages, it smooths out short-term noise, which makes divergence signals less frequent but generally more reliable on higher timeframes. Traders often use MACD line and signal line crossovers as a secondary trigger once hidden divergence has already set up the trade idea.
Do’s and don’ts when trading hidden divergence
| Do | Don’t |
|---|---|
| Trade hidden divergence in the direction of the existing trend | Use it to call a top or bottom against the trend |
| Wait for the second swing point to fully close before acting | Enter mid-swing before the pattern is confirmed |
| Check the 4-hour chart or higher for the cleanest signals | Rely on it alone on 1-minute or 5-minute charts |
| Combine it with a candlestick pattern or a support/resistance level | Treat it as a standalone signal with no confirmation |
| Set a stop below or above the swing point that formed the divergence | Trade it without a defined invalidation level |
Best timeframes and confirmation tools
One-line takeaway: hidden divergence is most reliable on the 4-hour chart and above, and works best paired with a second form of confirmation.
Both hidden and regular divergence are most reliable on the 4-hour timeframe and above. Below the 1-hour chart, price noise increases and false signals become common, since small swings can print technical higher lows or lower highs that do not reflect real buying or selling pressure. Divergence also measures momentum exhaustion, not exact timing, so it works best as a filter that tells you which direction to favor rather than a precise entry trigger on its own.
Strong confirmation tools to pair with hidden divergence include a break of short-term market structure, a strong candle close through a level, a volume spike, or a bounce off a level identified with Fibonacci retracement levels. Cross-checking with a moving average ribbon also helps confirm that the broader trend is still intact before trusting a hidden divergence signal.
How altFINS helps you spot hidden divergence 🔍
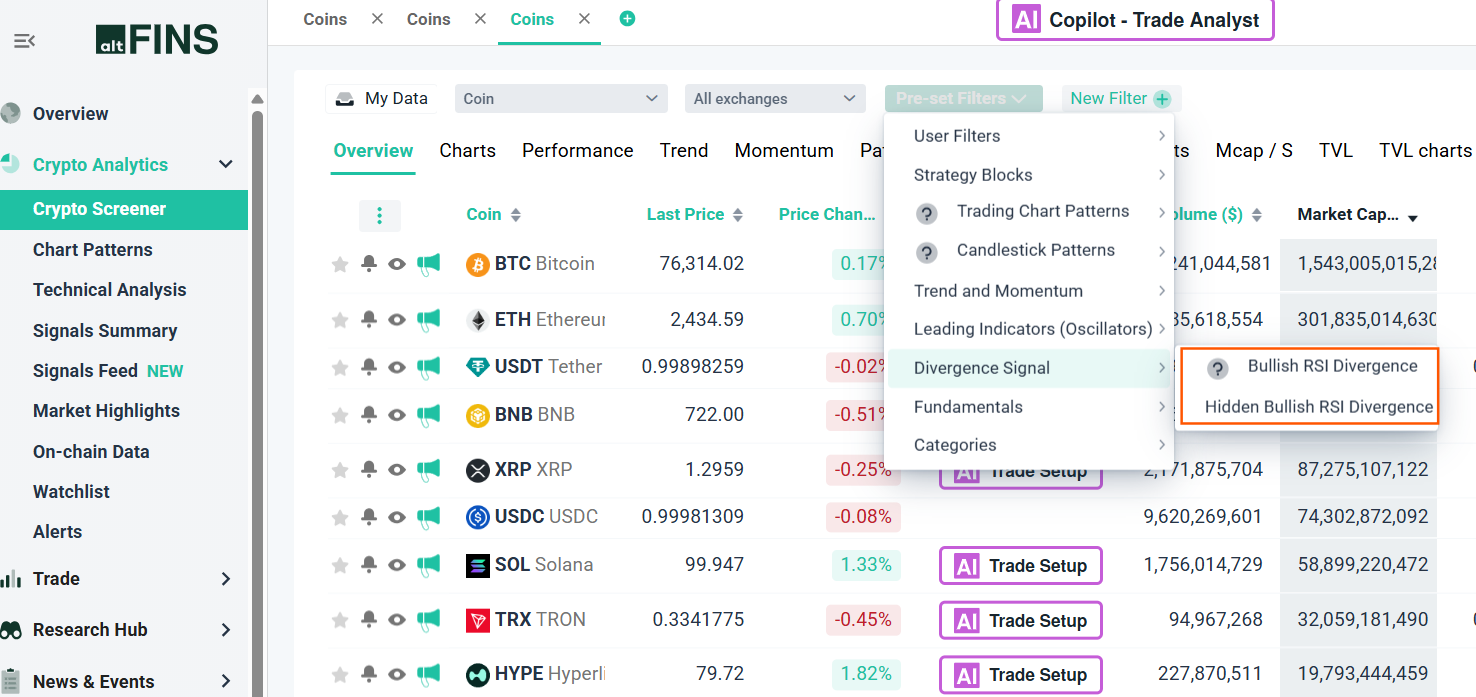
Spotting hidden divergence by hand means scanning chart after chart for the right combination of higher lows or lower highs against RSI or MACD. The altFINS crypto screener filters thousands of coins by RSI, MACD, and other indicator conditions at once, so you can narrow the market down to coins showing the setups this guide describes instead of checking charts one by one.
Once you have a shortlist, the technical analysis dashboard lays RSI, MACD, and moving averages over the price chart so you can check the divergence visually, and the signals summary page surfaces indicator-based alerts as they trigger, which is useful for catching a fresh hidden divergence setup as it forms rather than after the move is already over.
Frequently asked questions
What is hidden divergence in crypto trading?
Hidden divergence is a disagreement between price and an oscillator like RSI or MACD that appears during a pullback inside an existing trend. It suggests the trend still has momentum, unlike regular divergence, which appears at trend extremes and warns of a possible reversal.
Is hidden divergence bullish or bearish?
It can be either. Bullish hidden divergence forms during an uptrend pullback when price makes a higher low but the oscillator makes a lower low. Bearish hidden divergence forms during a downtrend bounce when price makes a lower high but the oscillator makes a higher high.
What is the difference between regular and hidden divergence?
Regular divergence forms at trend extremes and signals a possible reversal. Hidden divergence forms mid-trend, during a retracement, and signals that the existing trend is likely to continue once the pullback ends.
Does hidden divergence work with MACD?
Yes. The same higher low or lower high logic applies to the MACD line or histogram instead of RSI. MACD reacts slower than RSI, which produces fewer but often more reliable hidden divergence signals on higher timeframes.
What timeframe is best for spotting hidden divergence?
The 4-hour chart and above tends to give the cleanest signals. On timeframes below 1 hour, price noise increases sharply and false divergence signals become far more common.
Is hidden divergence a reliable trading signal?
It is a useful filter rather than a guaranteed signal. It works best combined with a candlestick pattern, a support or resistance level, or a volume spike, and with a clearly defined stop loss in case the trend fails despite the signal.
Verdict
Hidden divergence will not tell you when a trend will end, but it gives you a data-based reason to stay in a trade through a pullback instead of exiting on the first sign of weakness. Learn the four patterns in the comparison table above, always confirm on the 4-hour chart or higher, and pair the signal with a candlestick pattern or a support and resistance level before acting on it.
Ready to scan the market for these setups instead of checking charts one at a time? Try the altFINS crypto screener free and filter coins by RSI and MACD conditions in seconds.
This article is for educational purposes only and is not financial advice. Cryptocurrency trading carries a high level of risk, including the potential loss of your entire investment. Technical indicators like RSI and MACD can produce false signals, and past patterns do not guarantee future results. Always do your own research and consider your risk tolerance before trading.
