

Search Knowledge Base by Keyword
The Shooting Star Candlestick Pattern: A Crypto Trader’s Guide
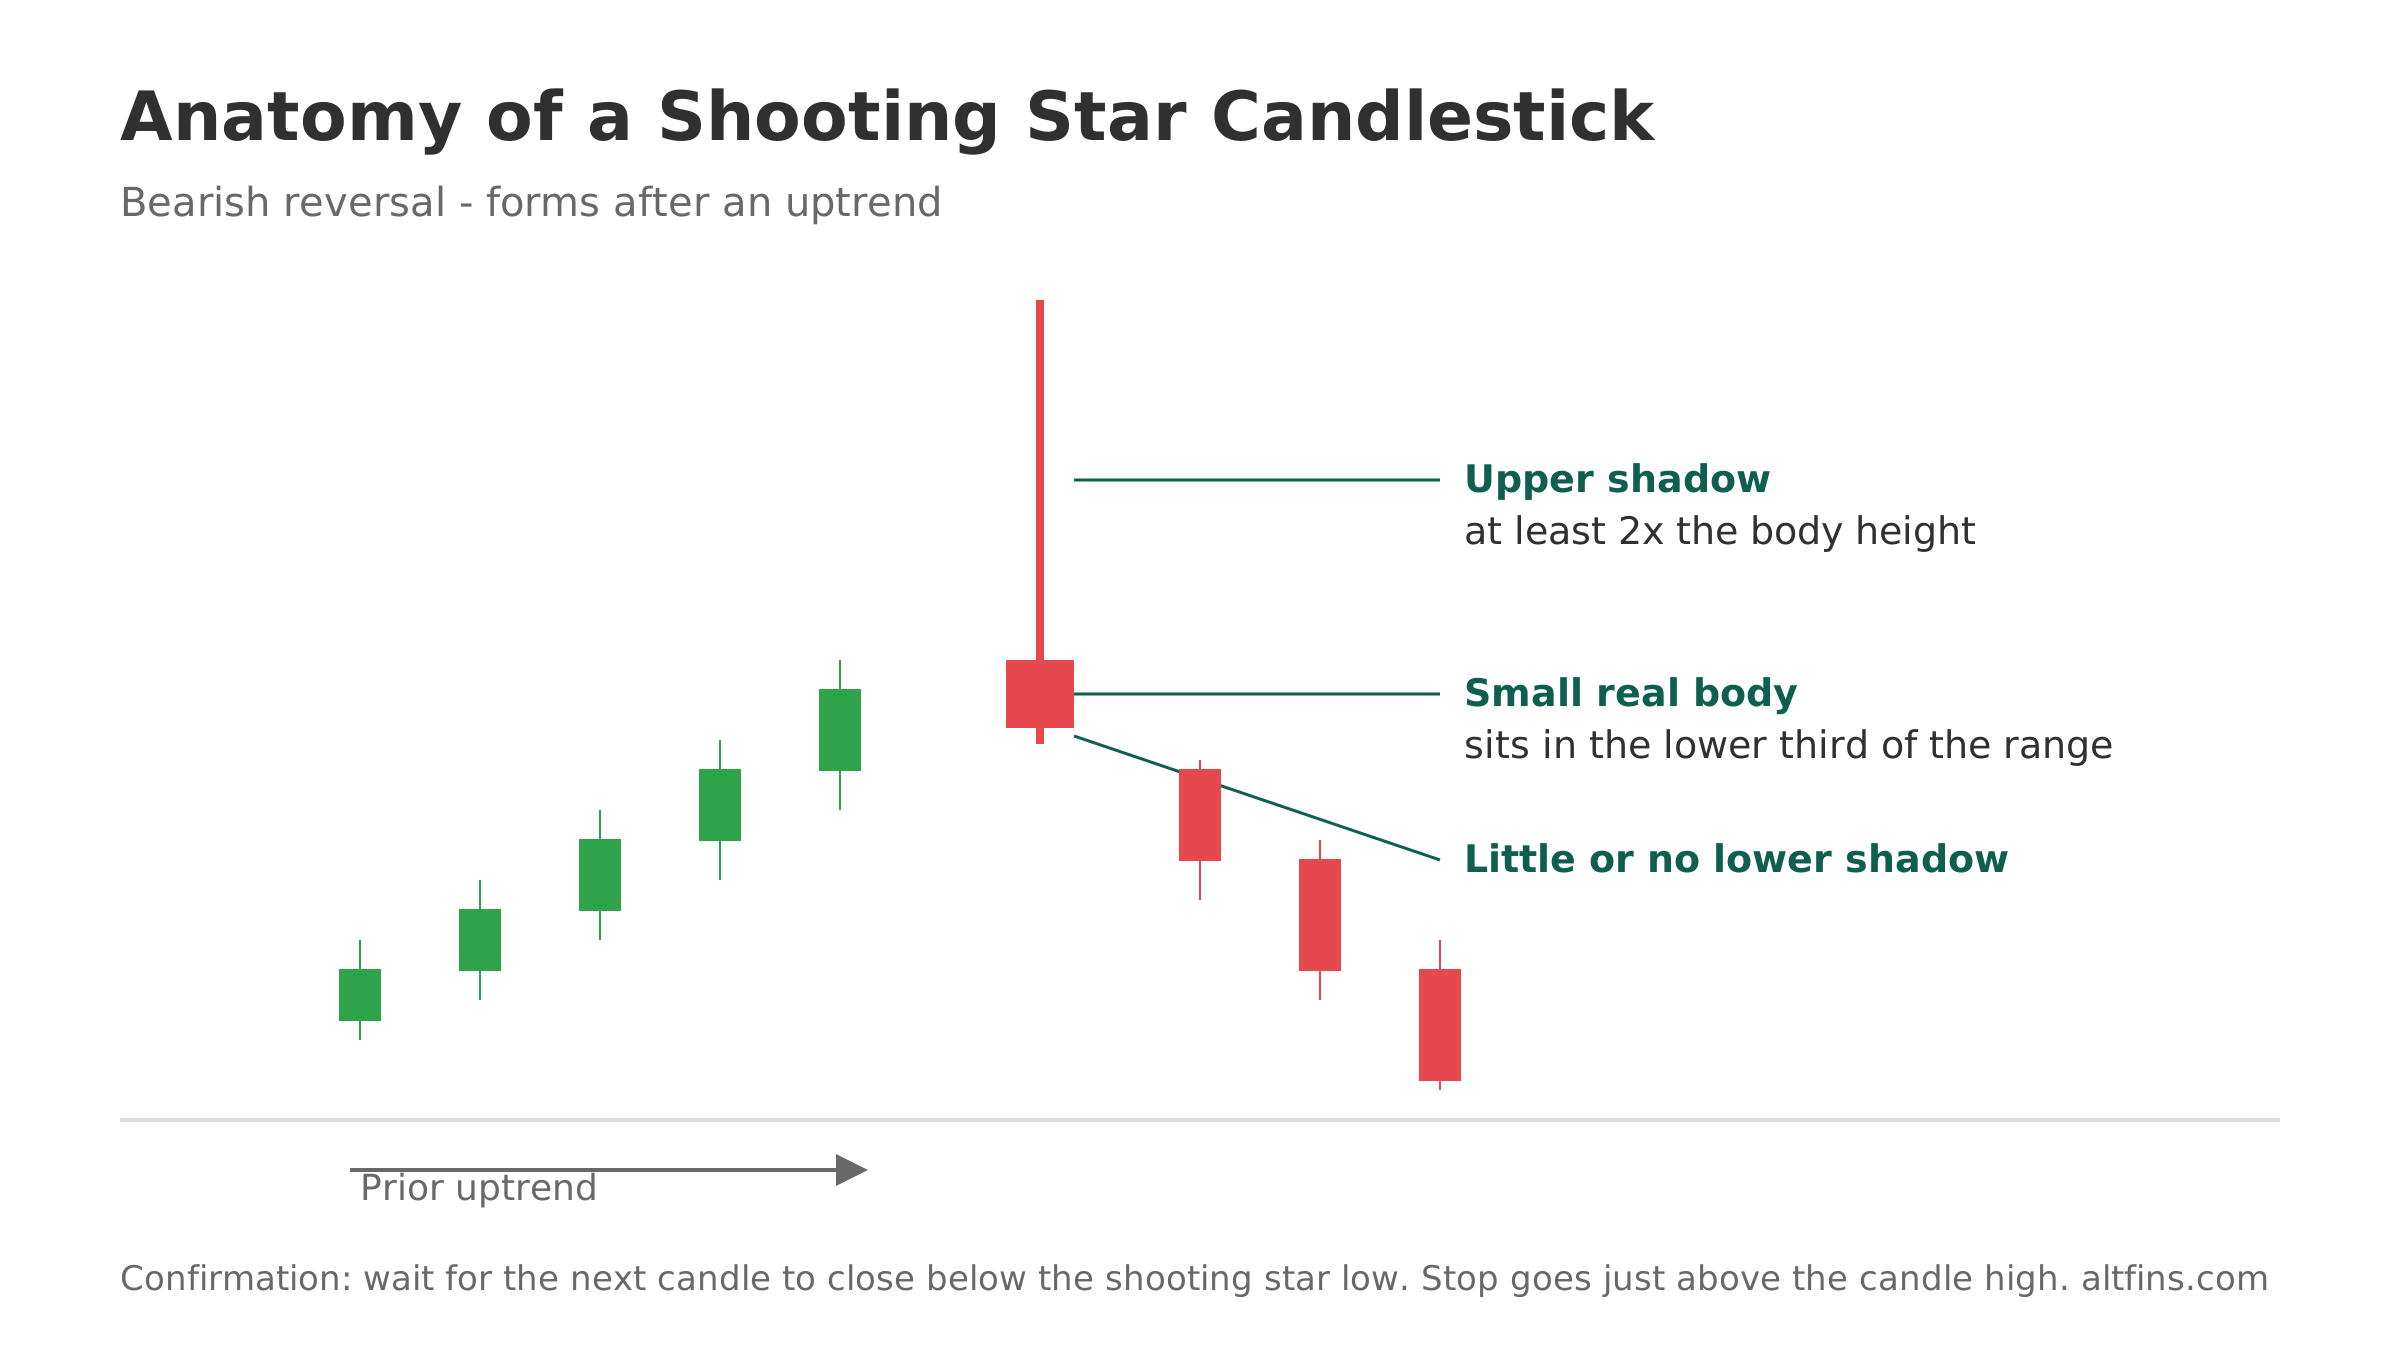
A shooting star candlestick pattern is a single candle with a long upper wick, a small body near the low of the range, and little or no lower wick. It forms after a price rally and warns that buyers pushed the market up during the session but lost control before the close. In crypto, traders read it as an early bearish reversal signal, especially when it prints at resistance.
This guide is for crypto traders who already know how to read a basic candlestick chart and want a clear, rule based way to use the shooting star. You will get the exact formation criteria, how the pattern differs from look alikes such as the inverted hammer and gravestone doji, what the historical statistics say about its accuracy, and a step by step trade plan with entry, stop loss, and target.
You will also see how to scan for shooting stars automatically across thousands of coins with the altFINS crypto screener instead of flipping through charts by hand. Last reviewed in September 2026.
Quick answer: The shooting star is a bearish reversal candlestick that appears at the top of an uptrend. It has a small real body, an upper shadow at least twice the body height, and almost no lower shadow. On its own it is only a moderate signal, so wait for a confirming close below the shooting star low before shorting or taking profit, and place your stop just above the candle high. Scan assets with shooting star pattern.
What is a shooting star candlestick pattern?
The shooting star is a one candle bearish reversal pattern that signals a possible top after an uptrend.
During the session the price opens, rallies sharply to a new intraday high, then sells off and closes back near the open. That path leaves a tall upper wick and a small body at the bottom of the range. The message is simple: buyers tried to extend the trend, sellers overwhelmed them, and momentum may be shifting.
How the candle forms
Think of the upper wick as a failed breakout inside a single bar. Bulls drive the price up, often into a resistance level or a round number, but there is not enough demand to hold those highs. Late buyers who chased the move are now offside, and their stop orders sit just above the candle high. If price trades back below the shooting star, those stops can accelerate the move down.
Formation checklist
- The market is in a clear short term uptrend before the candle.
- The real body is small and sits in the lower third of the range.
- The upper shadow is at least two times the height of the body, and three times is stronger.
- The lower shadow is very small or absent.
- The body can be red or green, but a red body that closes below the open is slightly more bearish.
- Bonus: the candle prints at a known resistance level, a prior high, or the upper Bollinger Band, and volume is above average.
What the shooting star tells crypto traders
A shooting star marks a point where buyers lost a fight they were expected to win, which is why it often precedes a pullback or a full reversal.
Crypto markets trade 24 hours a day and move fast, so the pattern shows up often on the 1 hour and 4 hour charts as well as the daily. That frequency is a double edged sword. It gives you many setups, but a lot of them are noise. The context around the candle matters far more than the candle itself. A shooting star into fresh resistance after a 30 percent weekly run is meaningful. A shooting star in the middle of a choppy range is not.
Use the shooting star as a trigger to act on a plan you already have, not as a reason to build a new opinion. If you were waiting to take profit on a long position near resistance, a shooting star is a reasonable place to do it. If you were watching for a short entry at a supply zone, a confirmed shooting star gives you a defined risk level.
Shooting star vs similar candlestick patterns
Four single candles share the long wick look, and mixing them up leads to trading the wrong direction.
| Pattern | Prior trend | Signal | Body position | Shadows |
|---|---|---|---|---|
| Shooting star | Uptrend | Bearish reversal | Near the low | Long upper, little or no lower |
| Inverted hammer | Downtrend | Bullish reversal | Near the low | Long upper, little or no lower |
| Gravestone doji | Uptrend | Bearish reversal | Open and close nearly equal, no real body | Long upper, little or no lower |
| Hanging man | Uptrend | Bearish reversal | Near the high | Long lower, little or no upper |
Shooting star vs inverted hammer
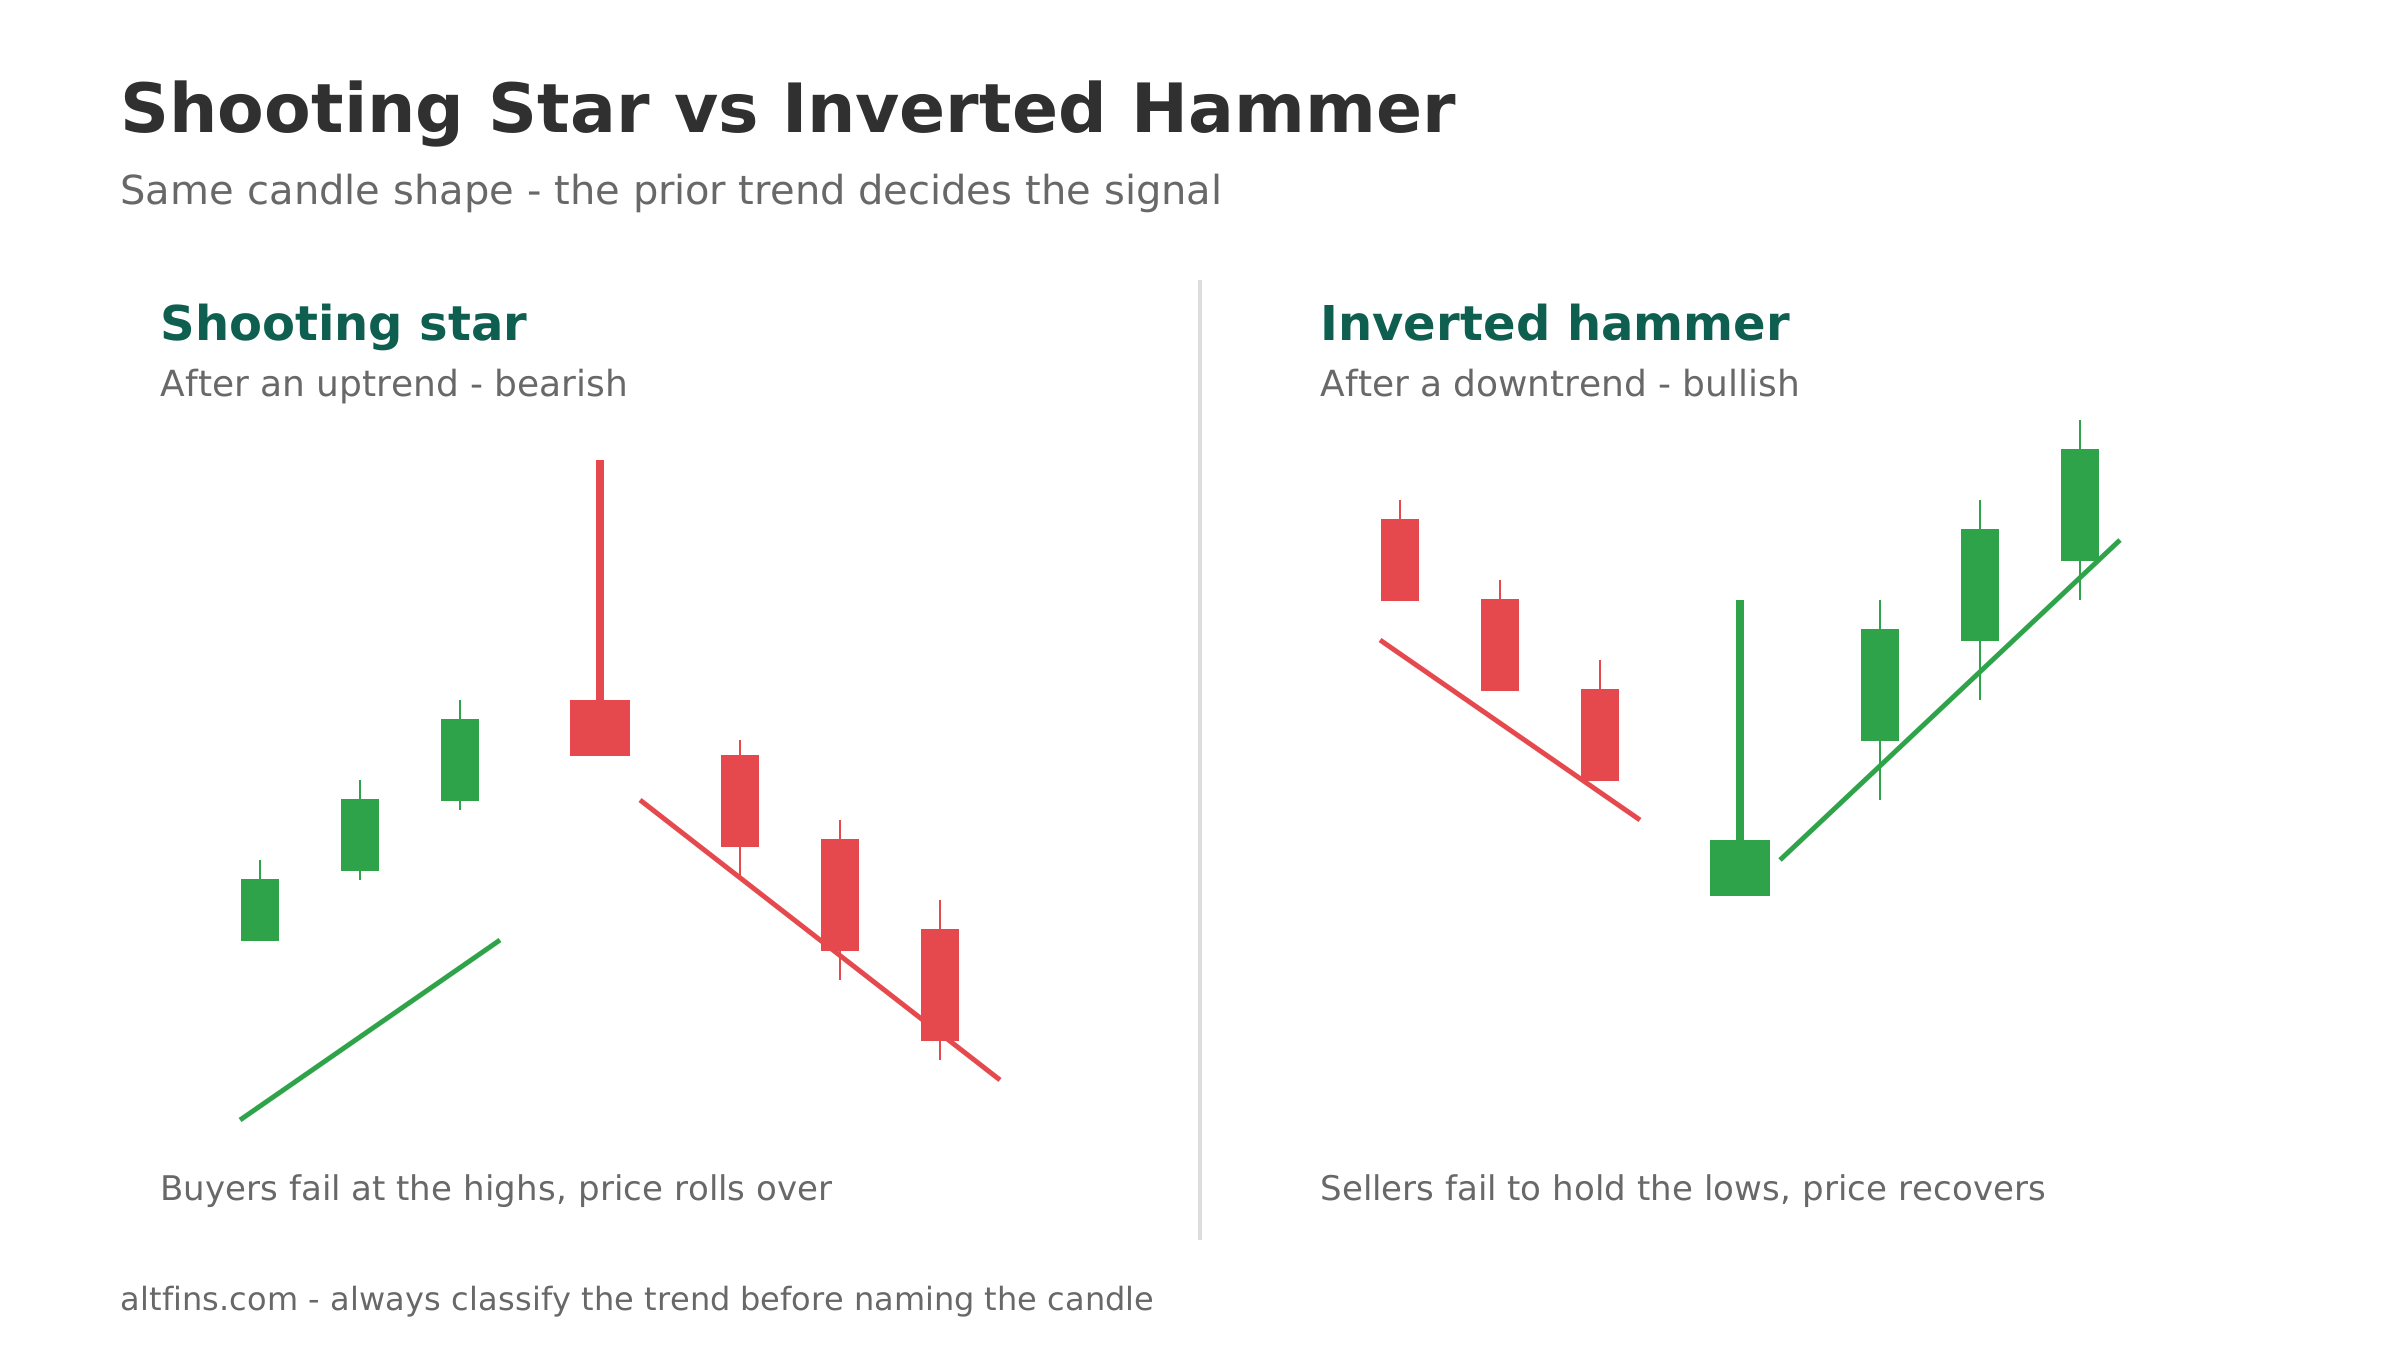
The two candles look identical. The only thing that separates them is the trend that came before. A long upper wick candle after a rally is a shooting star and points down. The same candle after a sell off is an inverted hammer and points up. Always classify the trend first.
Shooting star vs gravestone doji
A gravestone doji is the extreme version of a shooting star. The open and close are almost the same price, so there is no visible body at all. It shows an even sharper rejection of higher prices and is generally treated as a stronger bearish signal.
Shooting star vs hanging man
Both appear after an uptrend and both are bearish, but the wick is on the opposite side. The hanging man has a long lower shadow, which shows sellers pressed hard during the session even though price recovered by the close.
How reliable is the shooting star pattern?
The shooting star is a moderate signal at best, and it needs confirmation and context to be tradable.
In Thomas Bulkowski’s research for the Encyclopedia of Candlestick Charts, the standard shooting star acts as a bearish reversal about 59 percent of the time and ranks 55 out of 103 candlestick patterns for overall performance. Bulkowski’s summary is blunt: the pattern “looks better than it performs.” The identification rules he uses match the checklist above, including the upper shadow being at least twice the body height.
The takeaway is not to ignore the pattern, but to stack the odds. A shooting star is worth more when it forms at a tested resistance level, when the daily RSI is overbought or showing bearish divergence, when volume is well above average, and when the next candle closes below the shooting star low. Remove those filters and you are close to a coin flip.
How to trade the shooting star in crypto
Trade the confirmation candle, not the shooting star itself, and define your risk before you enter.
Step by step
- Confirm the context. Price is in an uptrend and the candle sits at or just above a resistance or supply level.
- Validate the shape. Small lower body, upper wick at least twice the body, minimal lower wick.
- Wait for confirmation. The next candle closes below the low of the shooting star. On lower time frames, also check that volume supports the move.
- Enter. Open a short, or close or trim a long, on that confirmation close.
- Set the stop. Place it just above the shooting star high. If that high is broken, the bearish idea is wrong.
- Set the target. Use the nearest support level, a prior swing low, or a fixed risk to reward ratio such as 1 to 2. Consider scaling out as price approaches support.
Confirmation tools that pair well
- RSI above 70 or a bearish RSI divergence into the high.
- Price tagging the upper Bollinger Band or a Fibonacci retracement level such as 0.618.
- A horizontal resistance level or a prior all time high or 52 week high.
- Above average volume on the shooting star candle.
Do and don’t
| Do | Don’t |
|---|---|
| Wait for a close below the shooting star low before acting. | Short the moment the shooting star closes. |
| Trade it at clear resistance after an extended run. | Trade it inside a tight sideways range. |
| Keep the stop just above the candle high. | Use a wide, undefined stop or none at all. |
| Favor the daily and 4 hour charts for cleaner signals. | Rely on 1 minute or 5 minute shooting stars, which are mostly noise. |
How altFINS helps you find shooting stars 🔭
Scanning thousands of charts for one candle by hand is not realistic. The altFINS crypto screener detects single candle, two candle, and three candle patterns across more than 3,000 coins and updates on the 15 minute, 1 hour, 4 hour, 12 hour, and daily intervals.
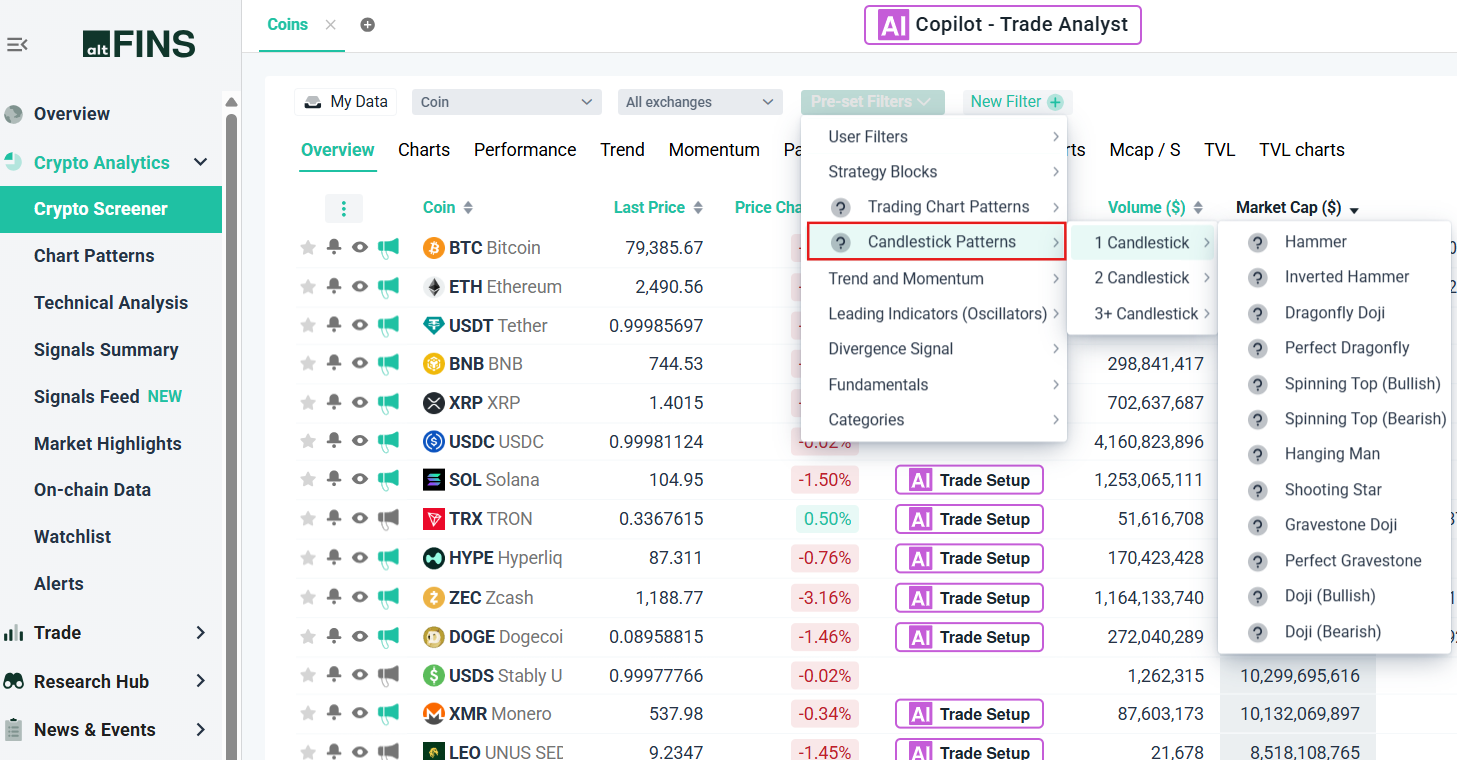
- Open the screener and choose the Candlestick Patterns preset, then Shooting Star, for a one click list of current setups.
- Use Custom Filters to combine the Shooting Star pattern with RSI above 70, a strong 1 week gain, or price near resistance, so only high quality setups appear.
- Turn on alerts so you are notified when a shooting star prints on a coin you follow, on the mobile app or by email.
- Cross check the signal against the altFINS signals summary for trend, momentum, and moving average context before you trade.
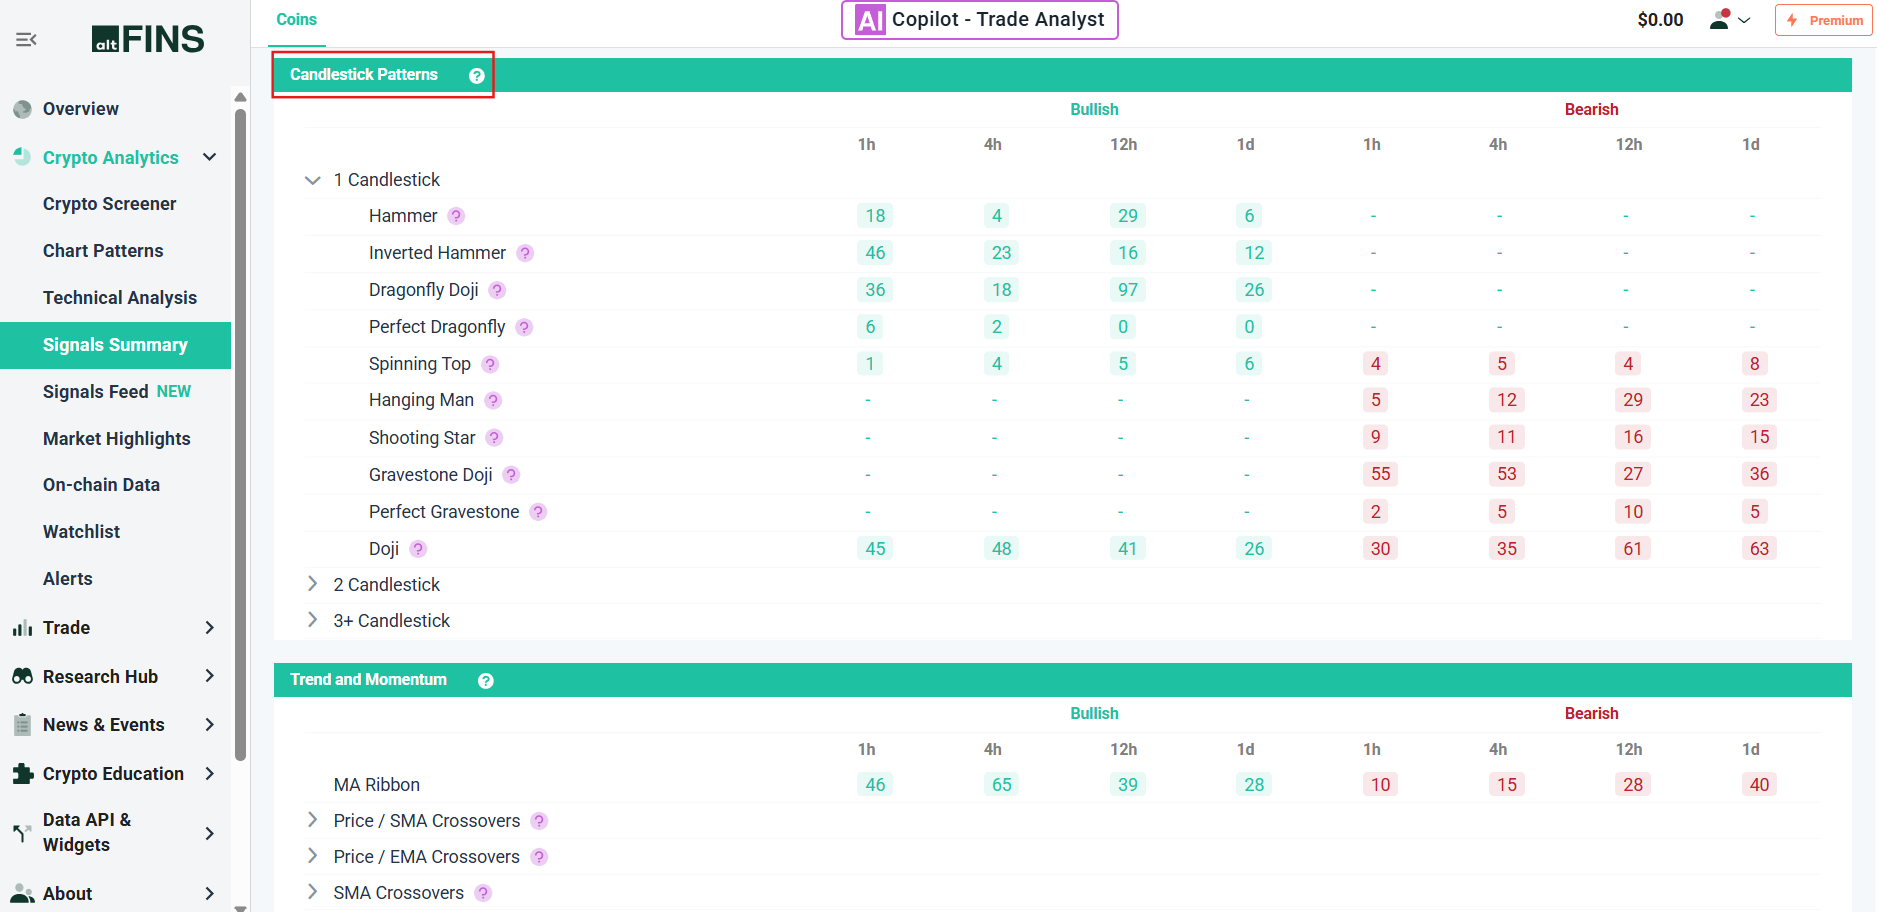
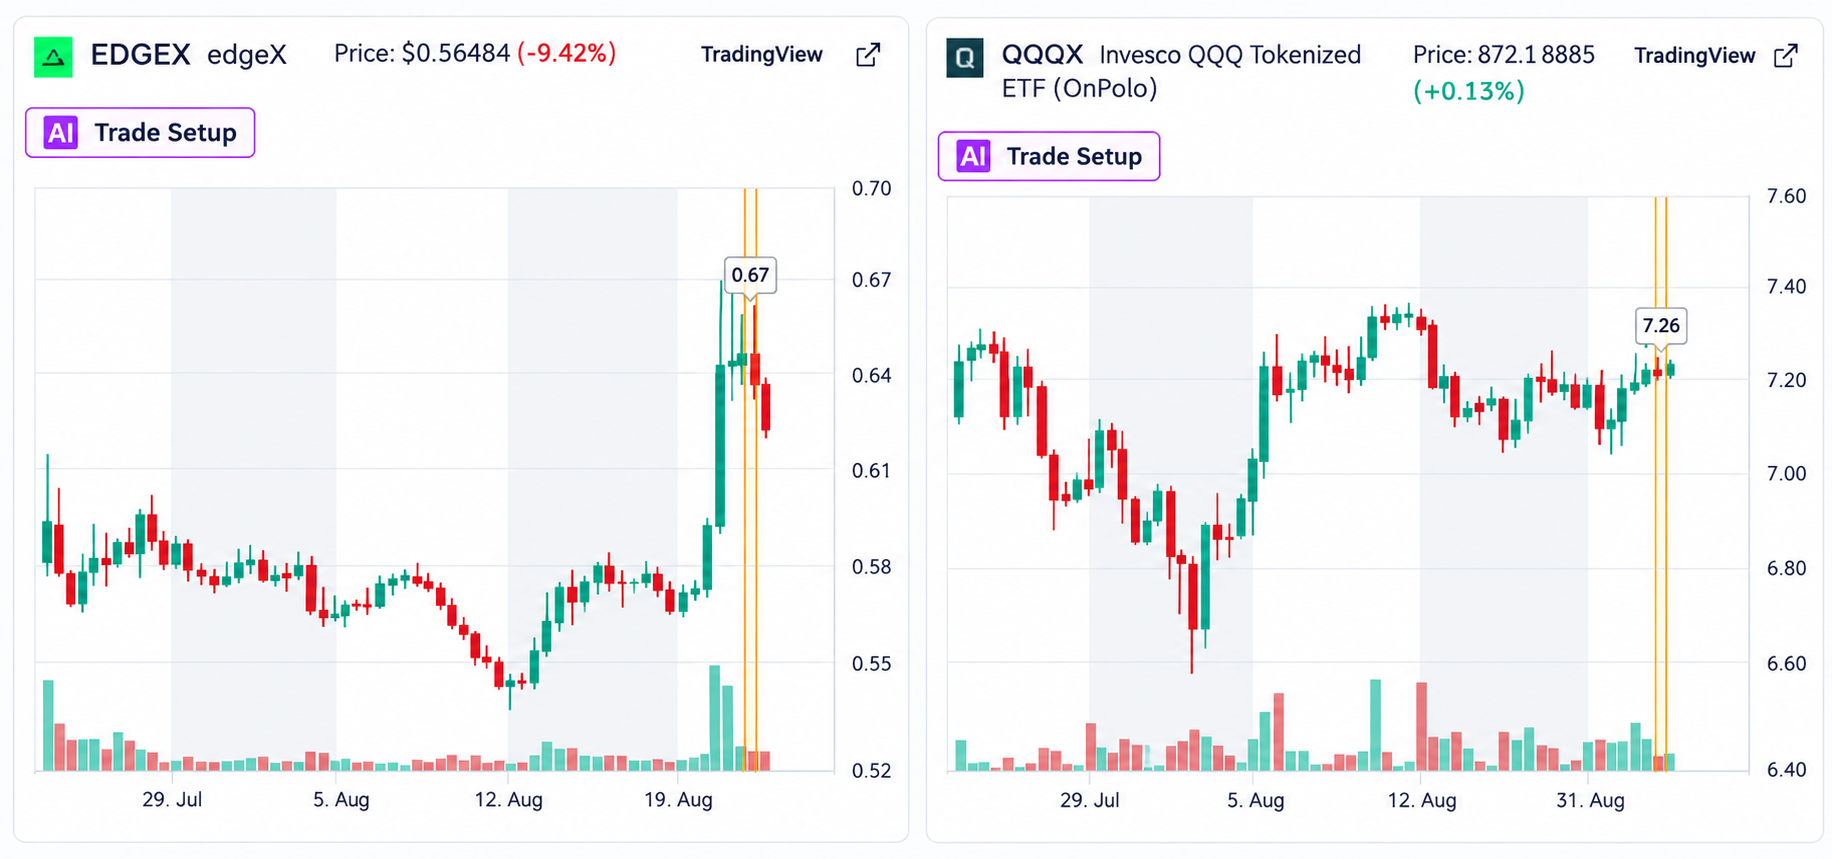
In a September 2026 scan, the Shooting Star preset was flagging setups across large cap tokens, tokenized equities, and mid cap altcoins, a reminder that the pattern is common and that filtering is what turns a raw list into a shortlist. For the wider picture, see the altFINS guides to the essential candlestick patterns and to mastering candlestick patterns for crypto trading.
Frequently asked questions
Is a shooting star candlestick bullish or bearish?
It is bearish. The shooting star forms after an uptrend and shows that buyers failed to hold the highs. It is read as an early warning of a top or a pullback. It only becomes a bullish look alike, the inverted hammer, when the same shape appears after a downtrend instead.
What is the difference between a shooting star and an inverted hammer?
The candles are identical in shape. The difference is the preceding trend. After a rally, a long upper wick candle is a shooting star and signals a possible move down. After a decline, the same candle is an inverted hammer and signals a possible move up.
Can a shooting star candlestick be green?
Yes. A green or white body means the close was slightly above the open, but the long upper wick and the location at the top of an uptrend still make it bearish. A red body, where price closed below the open, is considered marginally stronger because sellers finished in control.
How reliable is the shooting star candlestick pattern?
On its own it is only moderately reliable. Bulkowski’s data shows it acts as a bearish reversal about 59 percent of the time. Reliability improves when the candle forms at resistance, with an overbought RSI, on above average volume, and with a confirming close below its low.
What time frame is best for the shooting star pattern?
The daily and 4 hour charts give the cleanest signals for crypto because they filter out intraday noise. Shooting stars on the 1 minute and 5 minute charts appear constantly and rarely lead to a sustained move, so most swing traders ignore them.
What is the opposite of a shooting star candlestick?
The functional opposite is the hammer, a bullish reversal candle with a long lower wick that appears after a downtrend. The visual mirror is the inverted hammer, which has the same long upper wick shape but forms after a decline.
Verdict
The shooting star is a useful heads up, not a trade signal by itself. Treat it as a prompt to check resistance, momentum, and volume, then act only when the next candle closes below the shooting star low. Keep the stop just above the candle high, size the position so a stop out is a small loss, and let the target be a real support level rather than a guess.
Used this way, with a screener doing the searching and clear rules doing the deciding, the shooting star becomes a low effort way to catch tops and protect profits in a fast moving crypto market.
Ready to stop hunting for candles by hand? Open the altFINS crypto screener, select the Shooting Star pattern preset, and build a filter that only shows setups at resistance with an overbought RSI.
Disclaimer: This article is for educational purposes only and is not financial, investment, or trading advice. Candlestick patterns describe probabilities, not certainties, and past performance does not guarantee future results. Crypto trading carries a high risk of loss, including the loss of leveraged capital. Always do your own research and manage risk. altFINS does not accept payment in exchange for coverage or review scores. Market conditions referenced were current as of September 2026 and change quickly.
