

Search Knowledge Base by Keyword
Bearish Engulfing Candle: How to Spot and Trade It in Crypto
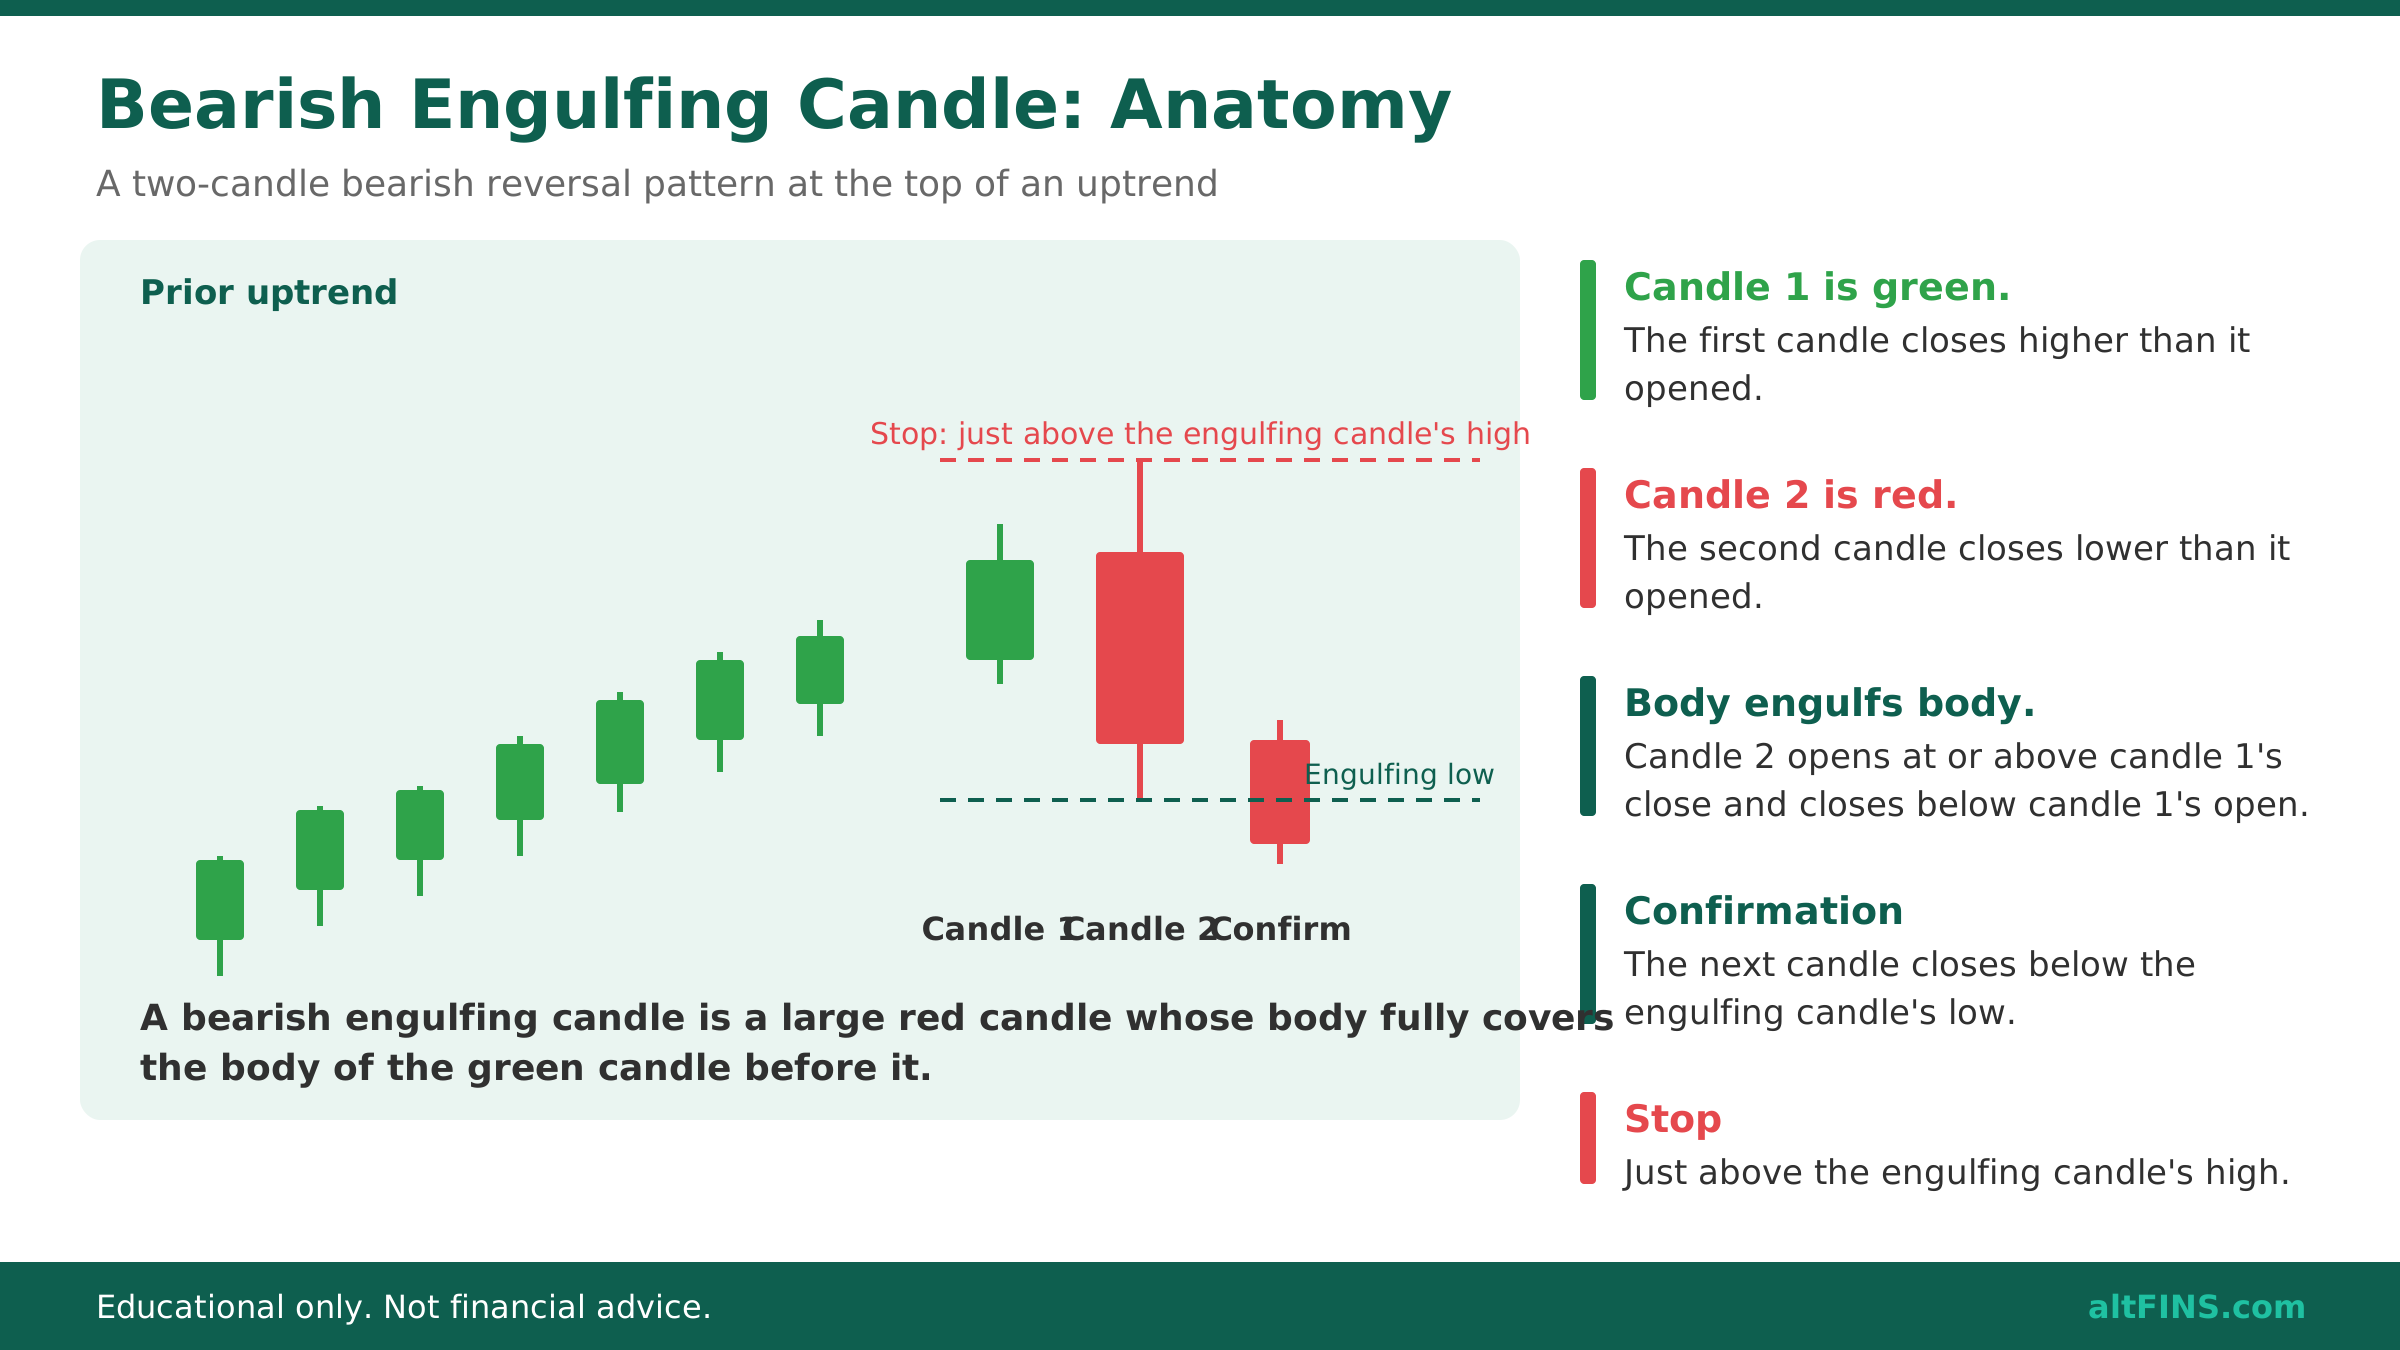
A bearish engulfing candle is a two-candle reversal pattern. A large red candle opens at or above the previous green candle’s close, then closes below that green candle’s open, so its body completely covers (“engulfs”) the prior body. It tells you sellers have taken control, and it matters most after a rally or at resistance.
This guide is for crypto traders who already read candlestick charts but want a clear, testable rule set for this pattern. You will learn how to identify a valid bearish engulfing candle on 24/7 crypto markets, what makes one strong or weak, how often it actually works, and how to trade it with a defined entry, stop and target.
We also walk through two real Bitcoin examples from August and September 2026, one that played out and one that failed, so you can see both sides before you risk money. Updated September 2026.
Quick answer: A bearish engulfing candle is a large red candle whose body fully covers the body of the green candle before it. It signals a possible top when it forms after an uptrend or at resistance. Traders usually wait for the next candle to close below the engulfing candle’s low, enter short or exit longs, and place a stop just above the engulfing candle’s high.
What is a bearish engulfing candle?
Takeaway: it is a two-candle pattern where one red body swallows the previous green body, showing a sudden shift from buyers to sellers.
The first candle is a bullish (green) candle, which confirms that buyers were still in charge. The second candle is a bearish (red) candle whose real body, the part between the open and the close, is taller than the first body and covers it completely. Wicks (the thin lines above and below the body) do not count for the engulfing test.
The psychology is simple. Buyers pushed price higher, then in the next session sellers not only erased that gain but closed price below where the buyers started. Anyone who bought during the green candle is now underwater, and that trapped supply often adds fuel to the move down.
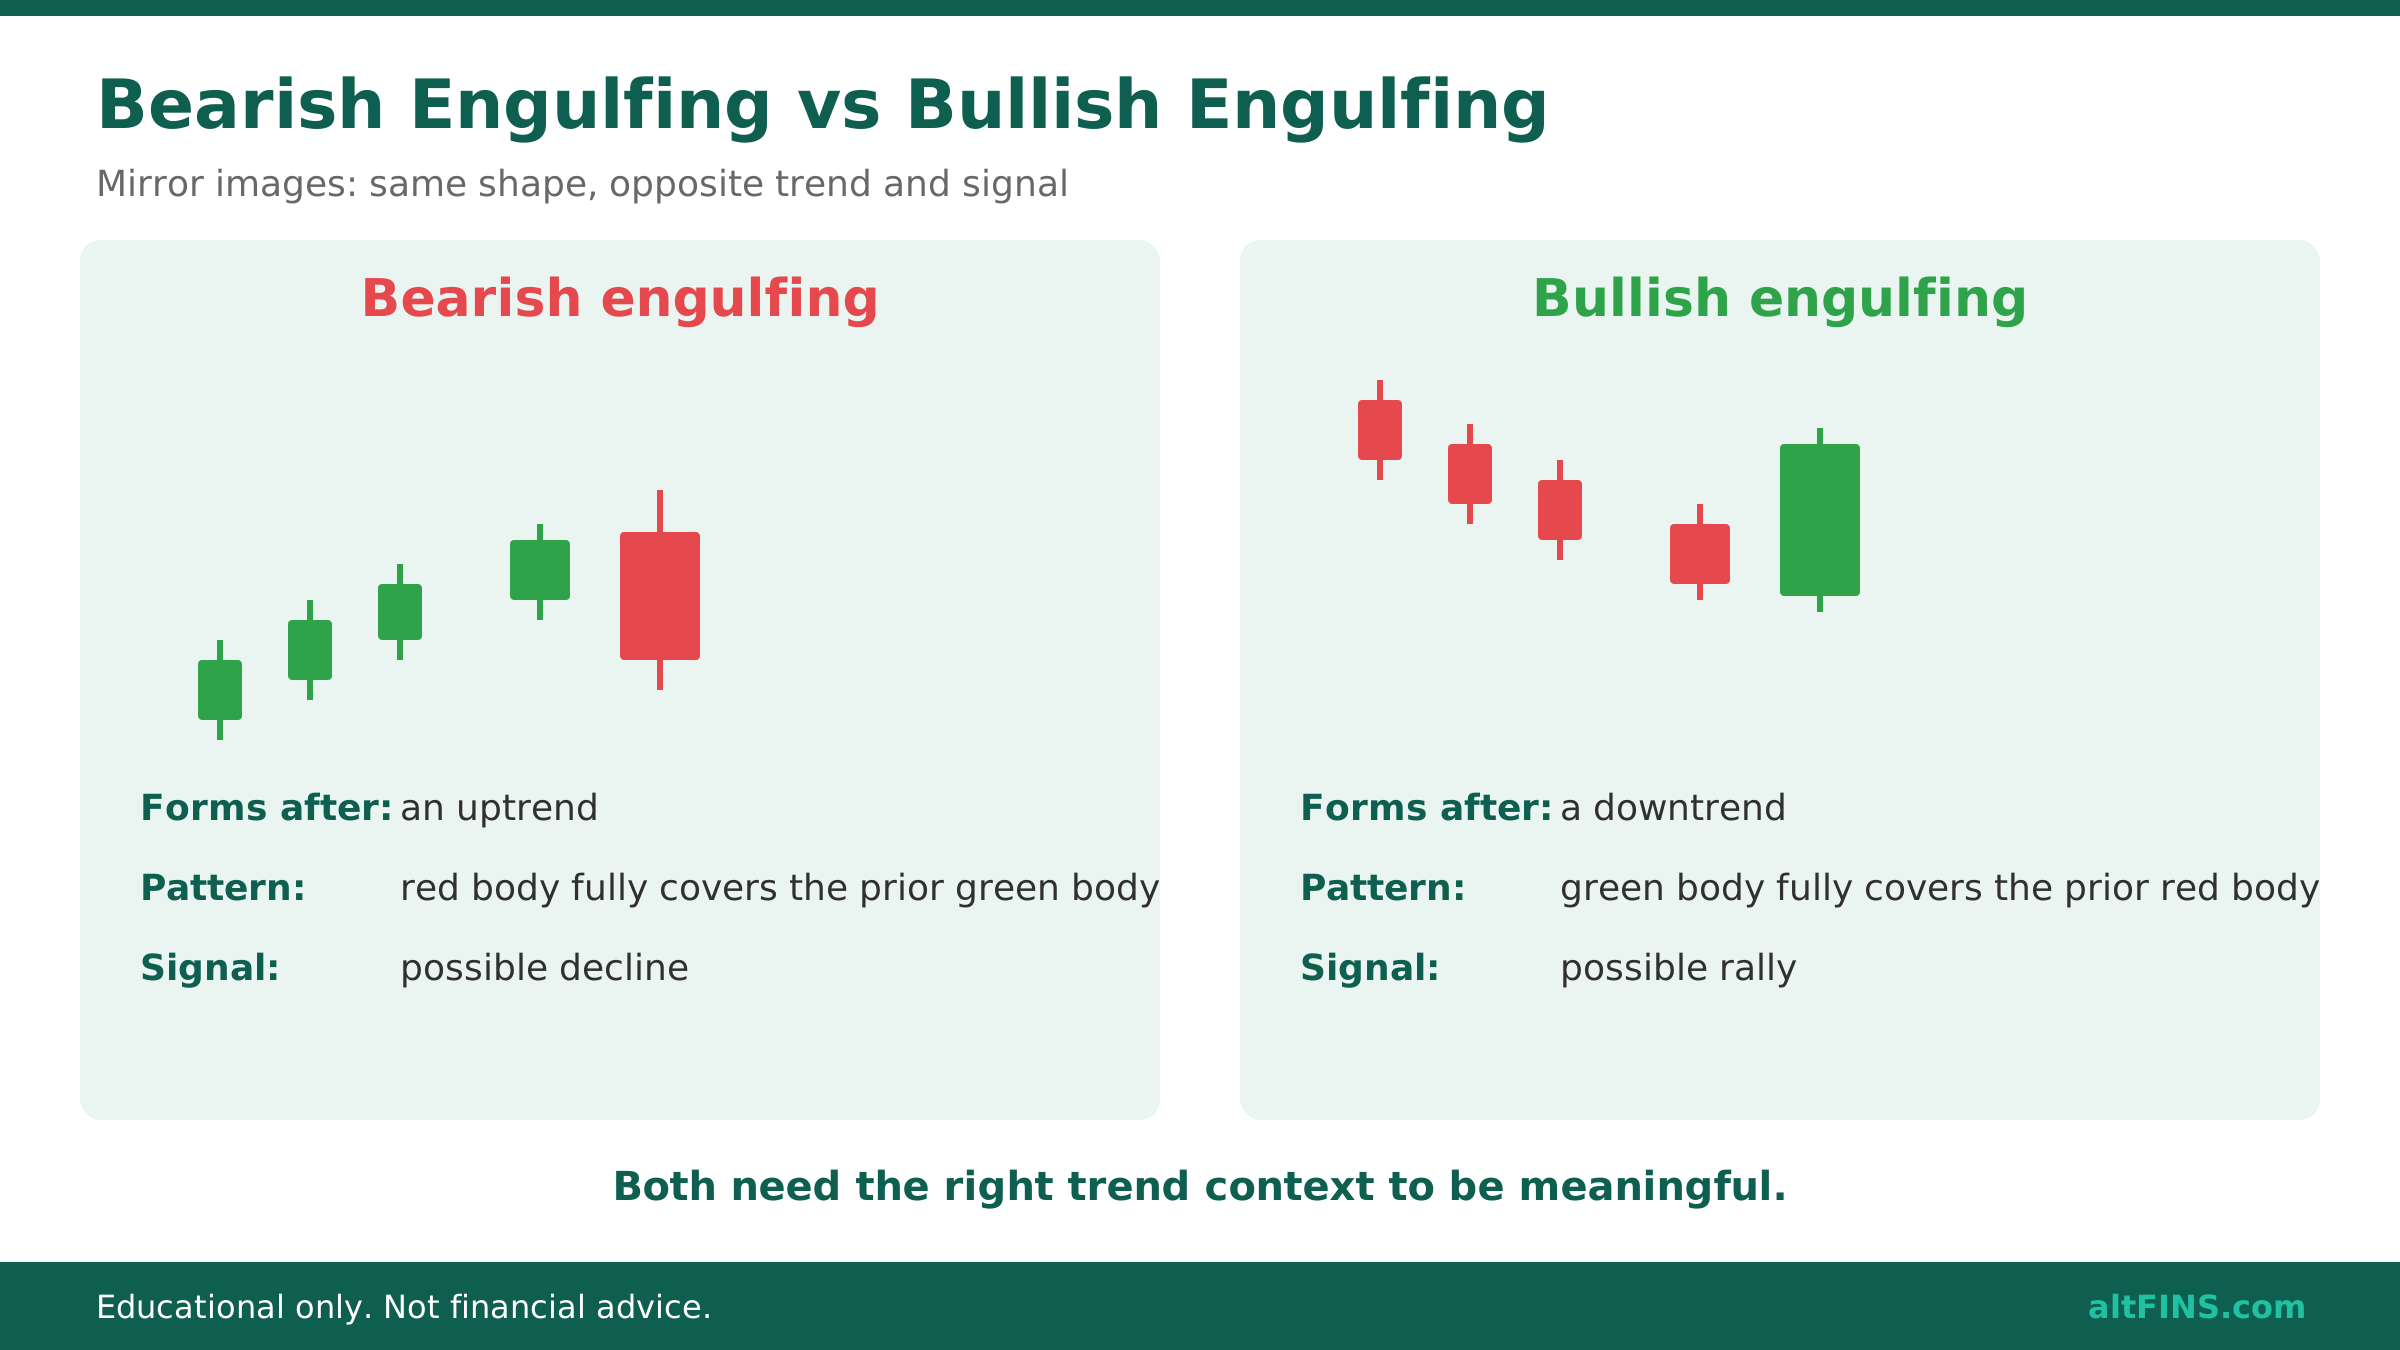
It is the mirror image of the bullish engulfing candlestick pattern, which forms at the bottom of a downtrend and signals a possible rally.
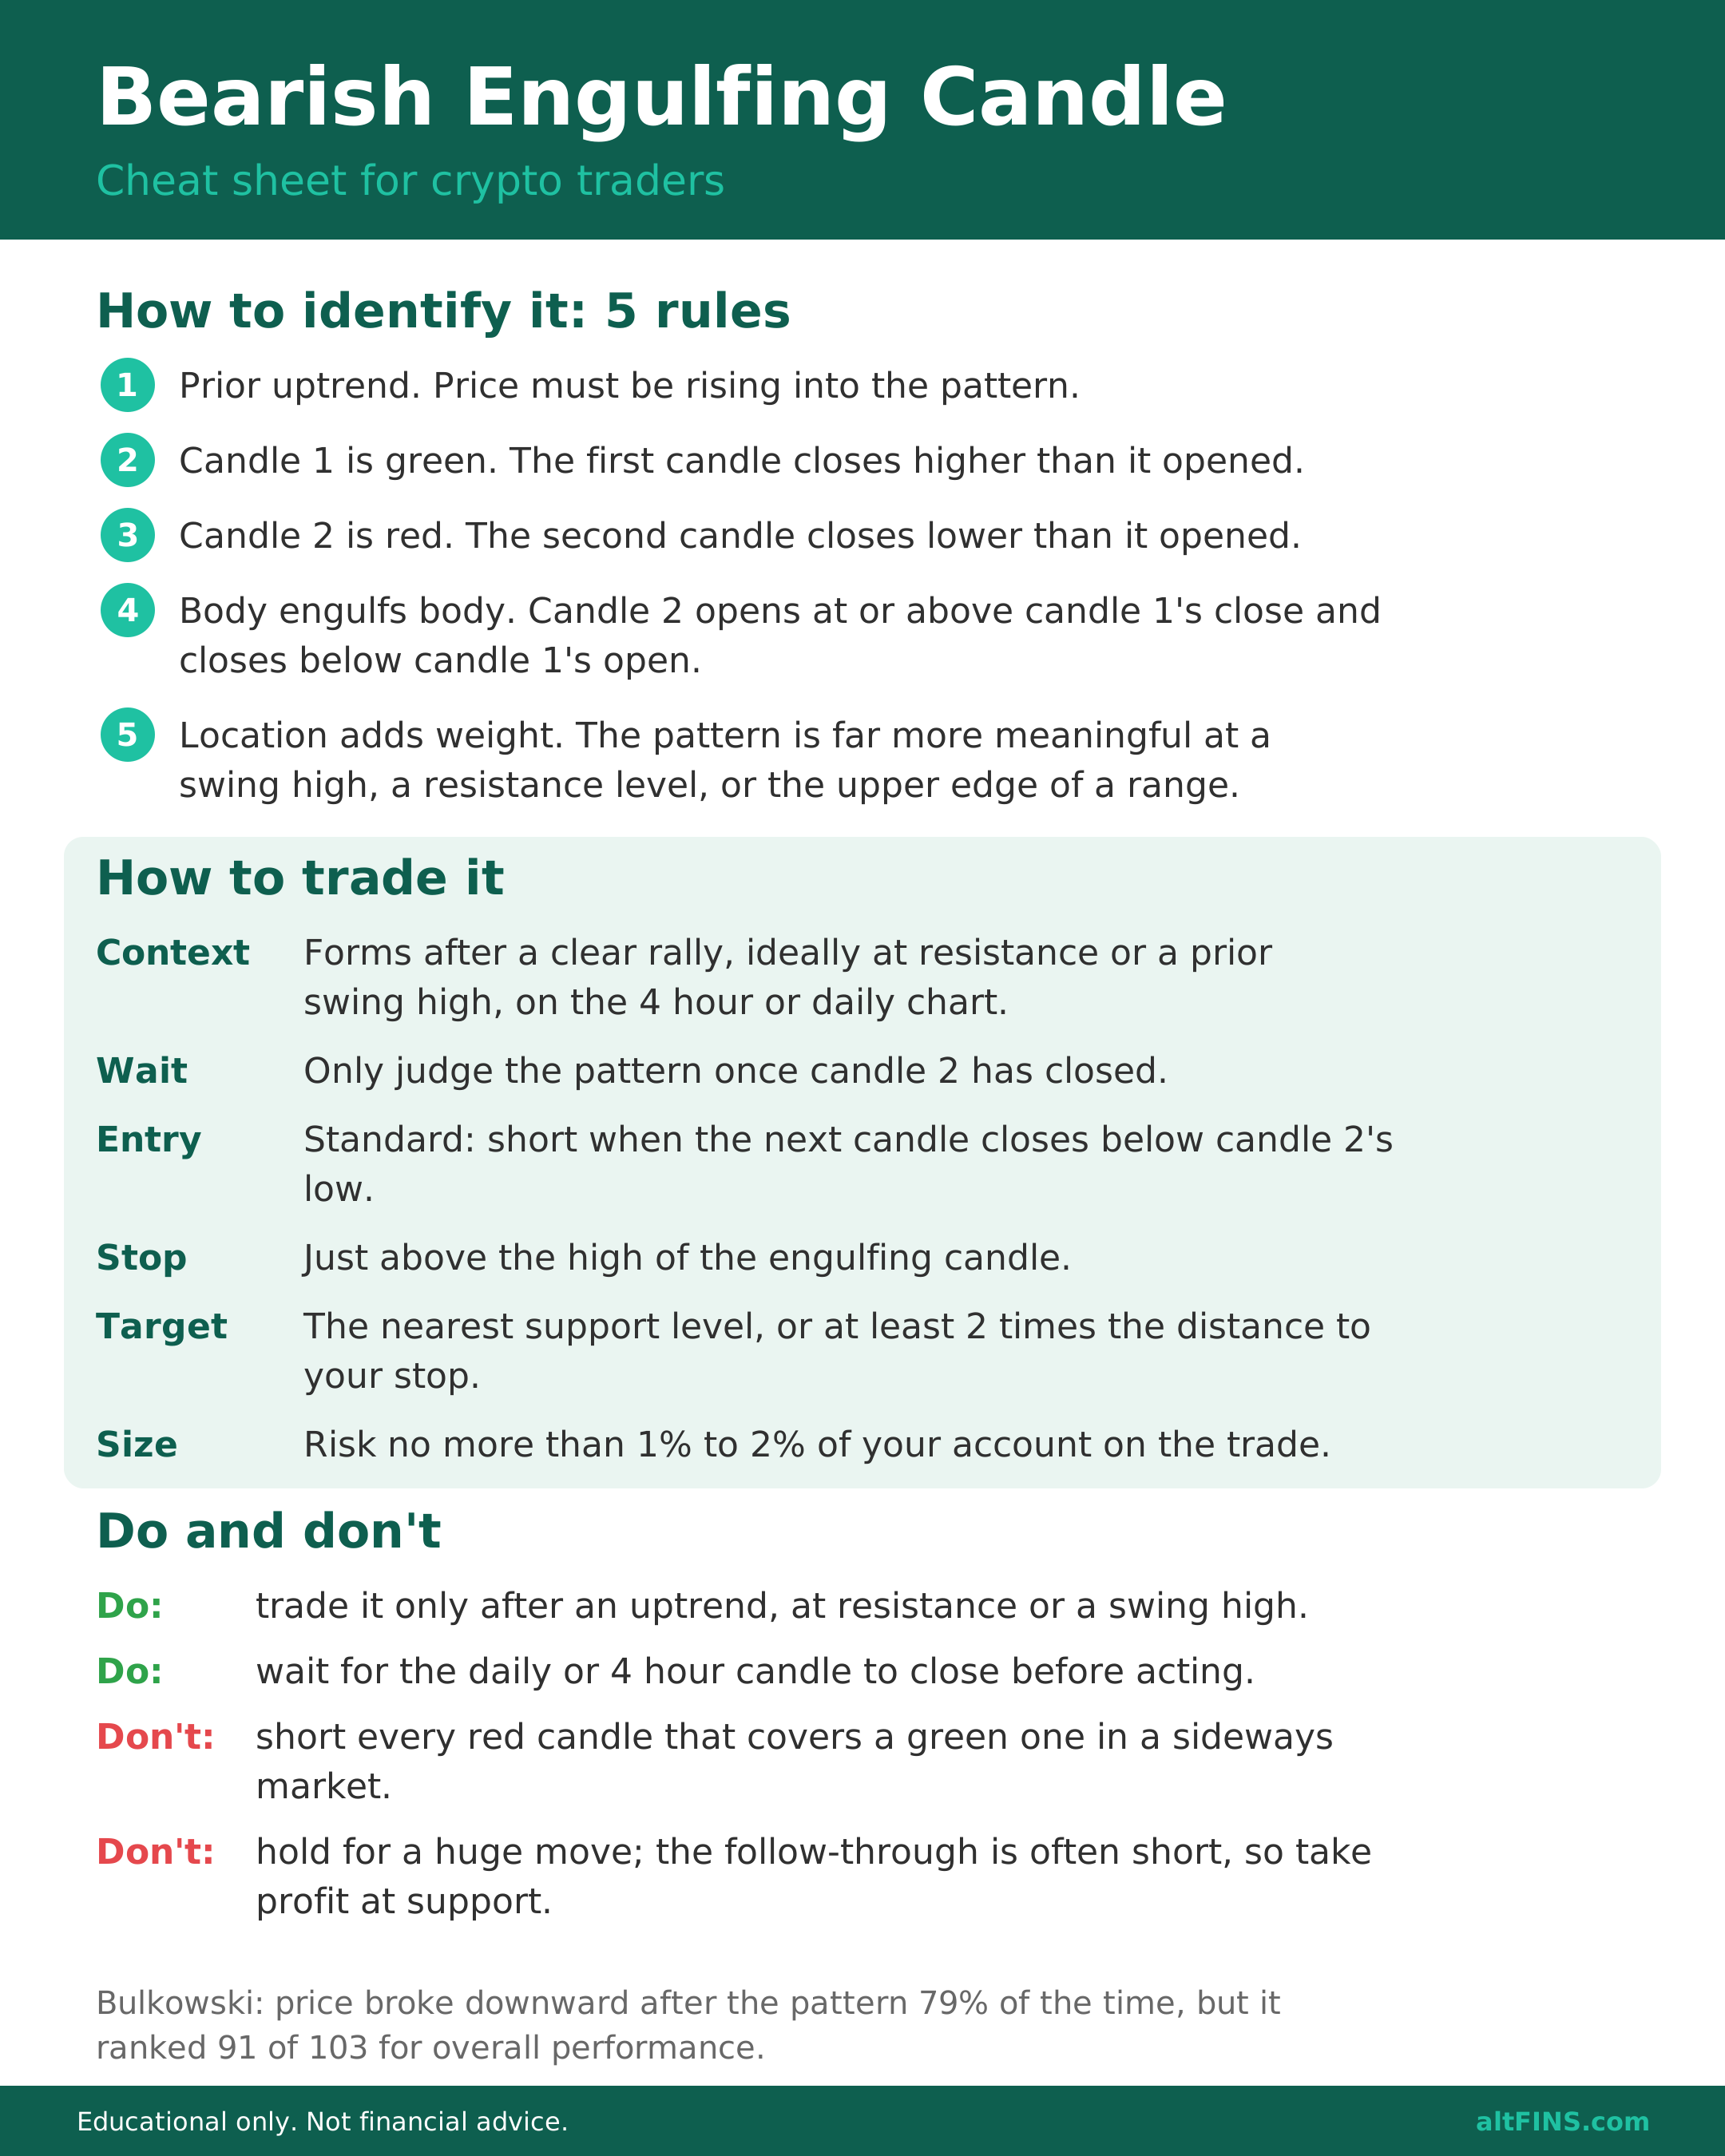
How to identify a bearish engulfing candle: 5 rules
Takeaway: check the trend first, then the two bodies, then the location.
- Prior uptrend. Price must be rising into the pattern. A bearish engulfing candle in a downtrend is just another red candle.
- Candle 1 is green. The first candle closes higher than it opened.
- Candle 2 is red. The second candle closes lower than it opened.
- Body engulfs body. Candle 2 opens at or above candle 1’s close and closes below candle 1’s open.
- Location adds weight. The pattern is far more meaningful at a swing high, a resistance level, or the upper edge of a range.
The crypto difference: why there is no gap
Textbook definitions come from stock markets, where the second candle often “gaps up” at the open. Crypto trades 24/7, so each daily candle opens almost exactly where the previous one closed. On Bitcoin or Ethereum charts, candle 2 will usually open at, or a few dollars away from, candle 1’s close. Treat that as valid. The rule that really matters is the close: candle 2 must close below candle 1’s open.
Also note that most exchanges close the daily candle at 00:00 UTC. A pattern is only confirmed once candle 2 has fully closed. An intraday red candle that “looks” engulfing at noon can still recover by midnight.
Strong vs weak bearish engulfing candles
Takeaway: size, location and follow-through separate a real warning from noise.
| Factor | Stronger signal | Weaker signal |
|---|---|---|
| Prior trend | Clear, extended rally into the pattern | Sideways chop or no real uptrend |
| Location | At a swing high, resistance or range top | In the middle of a range |
| Candle 2 size | Tall body that covers several prior candles | Body barely larger than candle 1 |
| Candle 2 close | Closes near its low, below candle 1’s low | Long lower wick, closes well off the low |
| Volume | Higher than candle 1 and the recent average | Lower than recent average |
| Momentum | RSI above 70 or bearish RSI divergence | RSI neutral near 50 |
| Timeframe | Daily or 4 hour chart | 15 minute or 1 hour chart |
Momentum confirmation is one of the most useful filters. If RSI is making a lower high while price makes a higher high, that bearish divergence plus an engulfing candle is a much stronger combination. See our guide to RSI and RSI divergence for how to spot it.
Bearish engulfing vs other bearish reversal candles
Takeaway: the engulfing candle is a two-candle pattern defined by bodies; most rivals are defined by wicks or need three candles.
| Pattern | Candles | What defines it | Signal |
|---|---|---|---|
| Bearish engulfing | 2 | Red body fully covers the prior green body | Bearish reversal |
| Bullish engulfing | 2 | Green body fully covers the prior red body, after a downtrend | Bullish reversal |
| Dark cloud cover | 2 | Red candle closes below the midpoint of the green body, but not below its open | Bearish reversal, weaker |
| Shooting star | 1 | Small body with a long upper wick at a high | Bearish reversal |
| Evening star | 3 | Green candle, small “star” candle, then a strong red candle | Bearish reversal |
| Gravestone doji | 1 | Open and close at the low with a long upper wick | Bearish reversal |
If you see a shooting star or a gravestone doji followed by a bearish engulfing candle at the same level, that cluster of signals carries more weight than any one of them alone.
How reliable is the bearish engulfing pattern?
Takeaway: it often marks a turn, but the move that follows is frequently short, so manage the trade tightly.
The most cited statistics come from Thomas Bulkowski’s pattern research at ThePatternSite, based mainly on stock data. He found that price broke downward after a bearish engulfing pattern 79% of the time. However, the pattern ranked only 91 out of 103 candlestick patterns for overall performance, because the downtrend that follows tends to be short-lived. Bulkowski also notes that taller candles performed better.
For crypto traders the practical lesson is clear. A bearish engulfing candle is a good warning to tighten stops or take profit on longs. As a short entry on its own it is weak, so you need confirmation and a close target.
How to trade a bearish engulfing candle step by step
Takeaway: context first, confirmation second, then a fixed stop above the high.
- Confirm the context. The pattern should form after a clear rally, ideally at resistance or a prior swing high, on the 4 hour or daily chart.
- Wait for the close. Only judge the pattern once candle 2 has closed.
- Choose your entry. Aggressive: short at candle 2’s close. Standard: short when the next candle closes below candle 2’s low. Conservative: wait for a bounce toward the midpoint of candle 2 and short there.
- Set the stop. Place it just above the high of the engulfing candle. If price closes above that high, the pattern has failed.
- Set the target. Use the nearest support level, or aim for at least 2 times the distance to your stop (a 2:1 reward to risk ratio).
- Size the position. Risk no more than 1% to 2% of your account on the trade. See how to plan exits in our guide on taking profits in crypto.
If you are not a short seller, the same signal works as a risk tool. Many spot traders use a confirmed bearish engulfing candle at resistance to trim a long position or move their stop up to break even.
Real examples: Bitcoin in August and September 2026
Takeaway: the same pattern worked at a swing high and failed in the middle of a range.
Example 1: August 28, 2026 (worked, briefly)
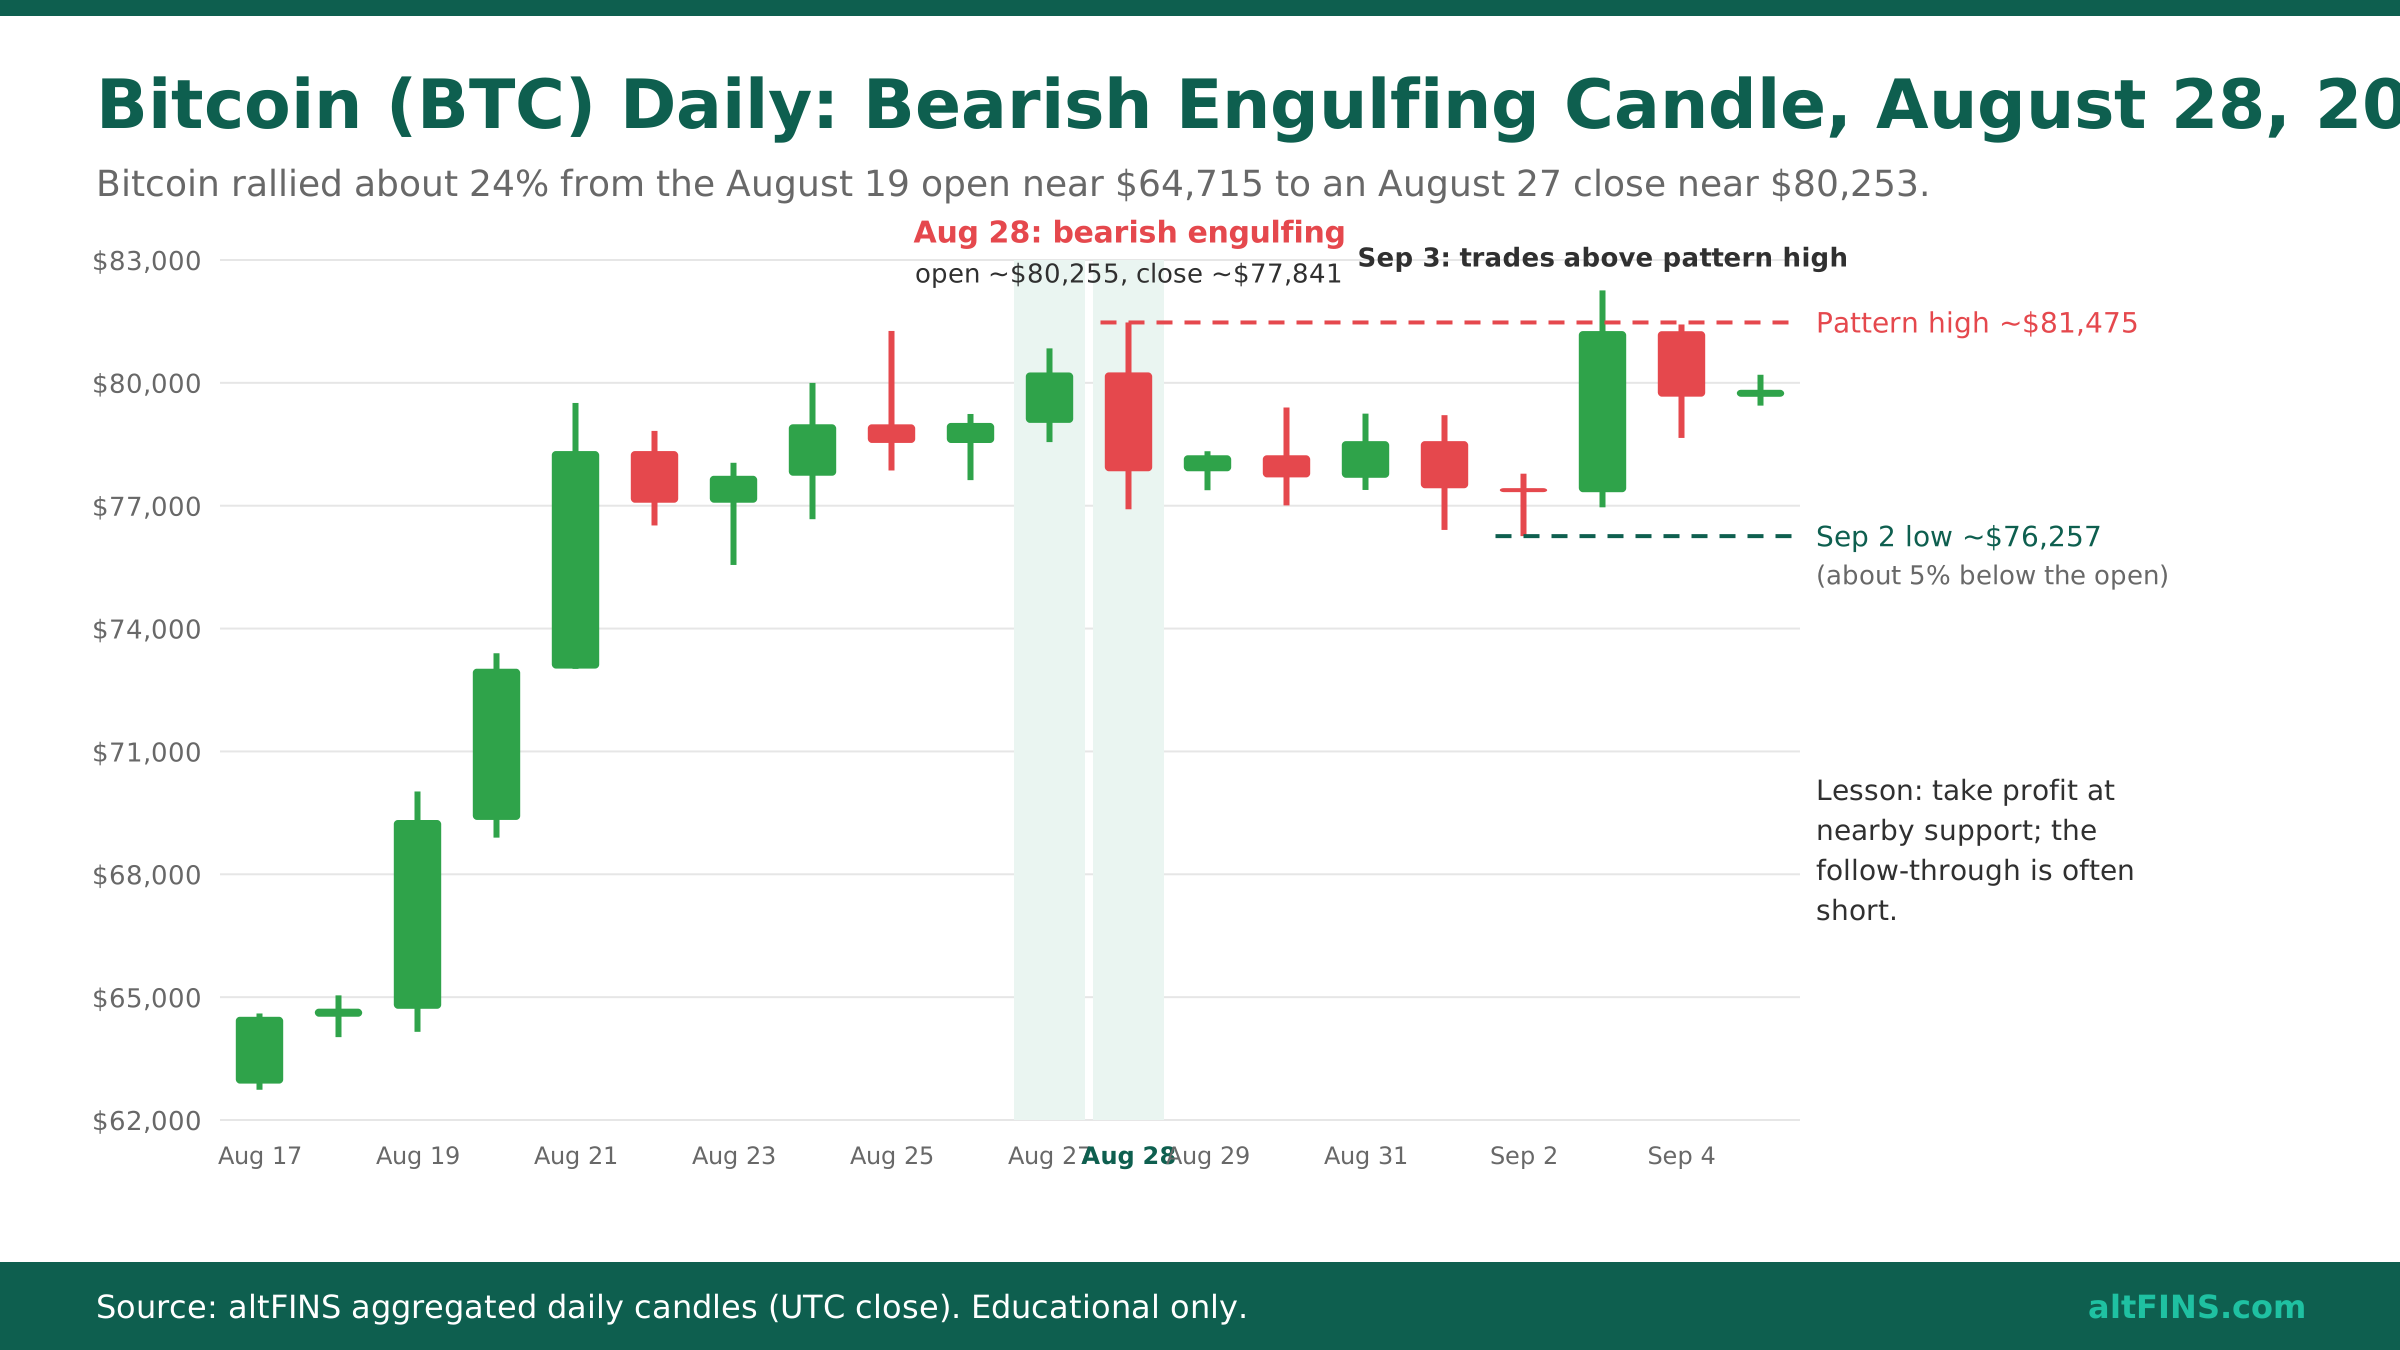
Bitcoin rallied about 24% from the August 19 open near $64,715 to an August 27 close near $80,253. On August 28 the daily candle opened near $80,255, pushed to a high near $81,475, then closed near $77,841, below the August 27 open of about $79,023. That is a textbook bearish engulfing candle at a fresh swing high.
Price traded sideways to lower for the next five sessions and bottomed near $76,257 on September 2, roughly 5% below the engulfing candle’s open. On September 3, BTC traded up to about $82,258, above the pattern high, which would have stopped out any remaining short. A trader who took profit at nearby support made money; a trader who held for a big move did not. That matches Bulkowski’s finding that the follow-through is often short.
Example 2: September 15, 2026 (failed)
On September 14 BTC printed a green candle from about $76,831 to $78,194. On September 15 it opened near $78,191 and closed near $75,635, again a valid bearish engulfing candle by the rules. But this one formed in the middle of a sideways range, not after a strong rally. Within three sessions price reversed, and on September 18 it traded above the pattern high near $79,596, then pushed above $86,000 by September 21.
The lesson: location matters more than the pattern itself. Prices above come from altFINS aggregated daily candles (UTC close), so single exchange values may differ slightly.
Do’s and don’ts
Do: trade it only after an uptrend, at resistance or a swing high.
Do: wait for the daily or 4 hour candle to close before acting.
Do: confirm with volume, RSI divergence or a break of the engulfing candle’s low.
Don’t: short every red candle that covers a green one in a sideways market.
Don’t: hold for a huge move; the follow-through is often short, so take profit at support.
Don’t: trade it on 1 minute or 5 minute charts, where it appears constantly and means little.
🛠️ How altFINS helps you find bearish engulfing candles
Scanning hundreds of charts by hand for one two-candle pattern is slow. altFINS automates it.
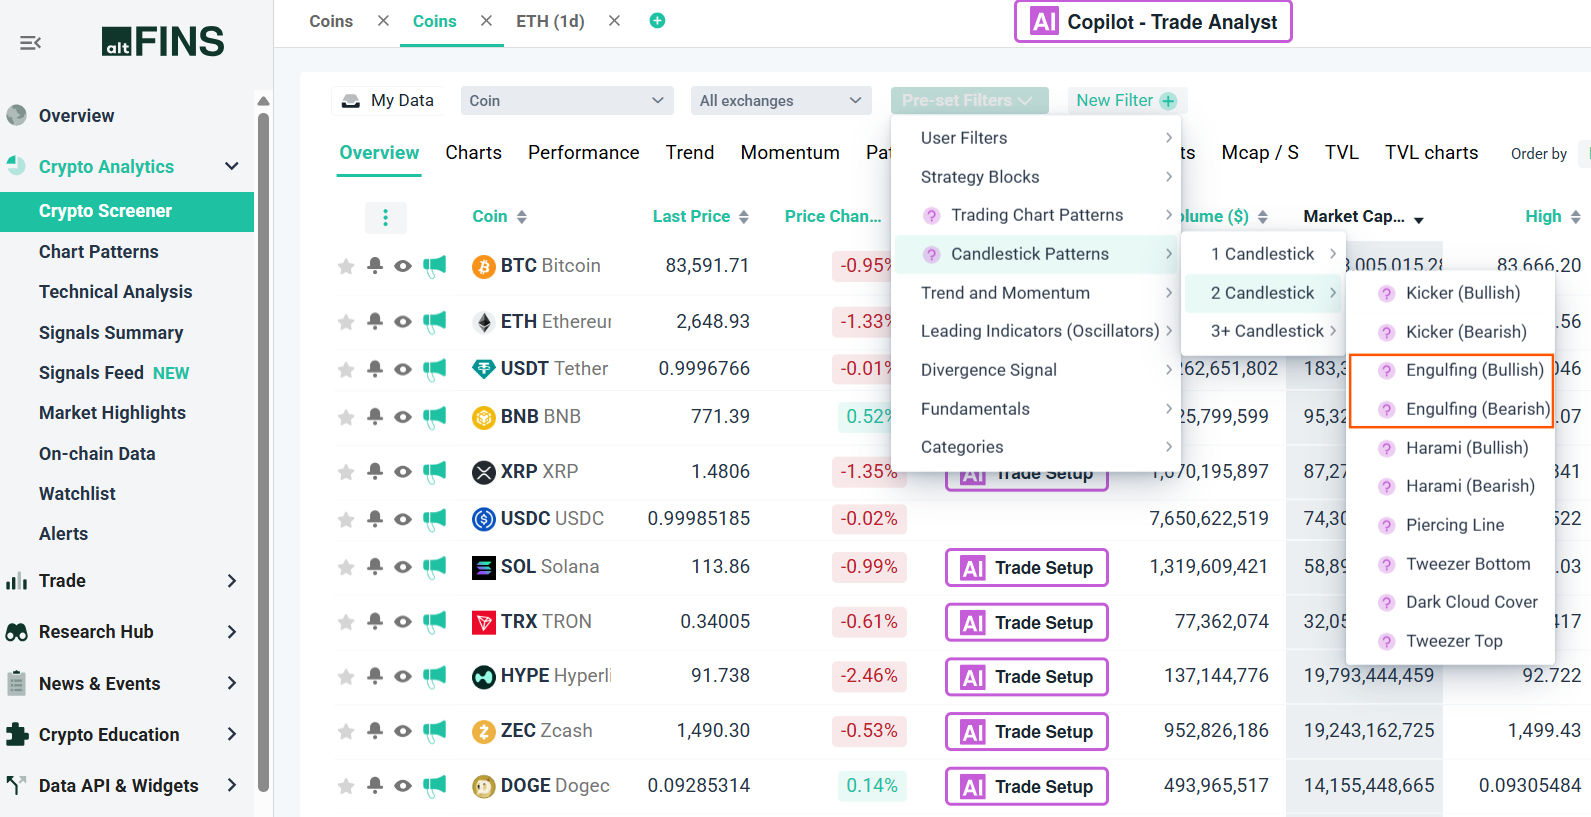
- Crypto Screener: the altFINS crypto screener scans 2,000+ coins and lets you filter for candlestick patterns such as bearish engulfing, then stack filters like RSI above 70 or price near resistance.
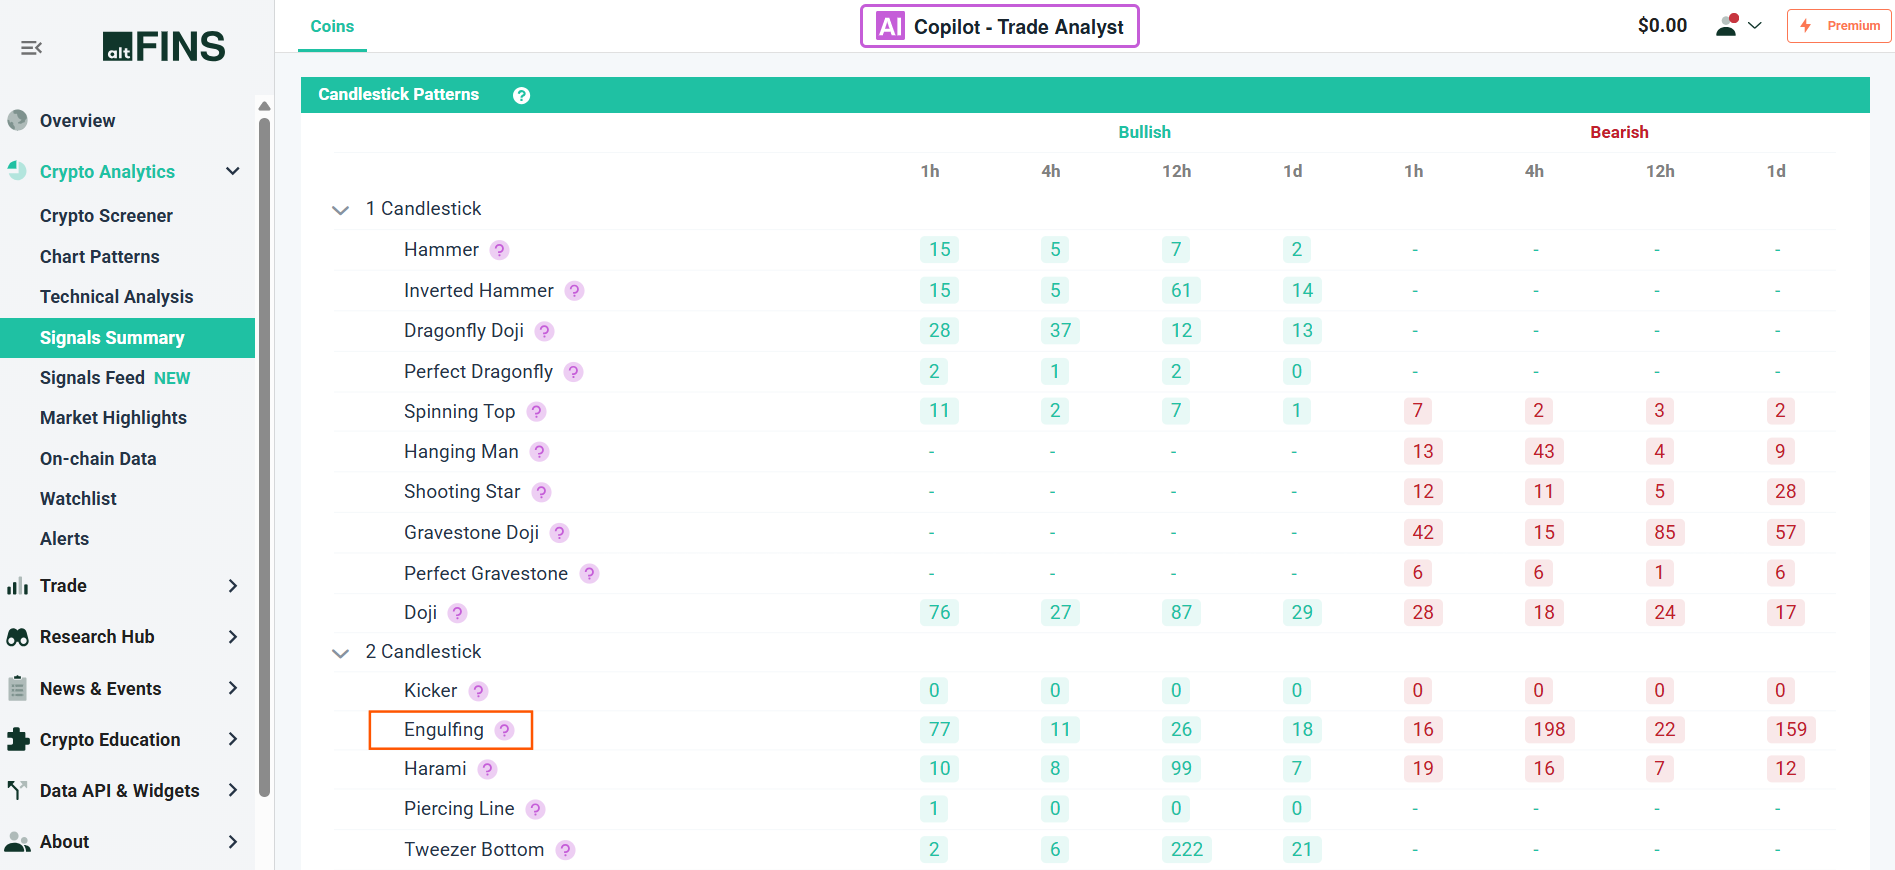
- Signals Summary: the Signals Summary lists fresh bullish and bearish setups across timeframes, including more than 30 candlestick patterns.
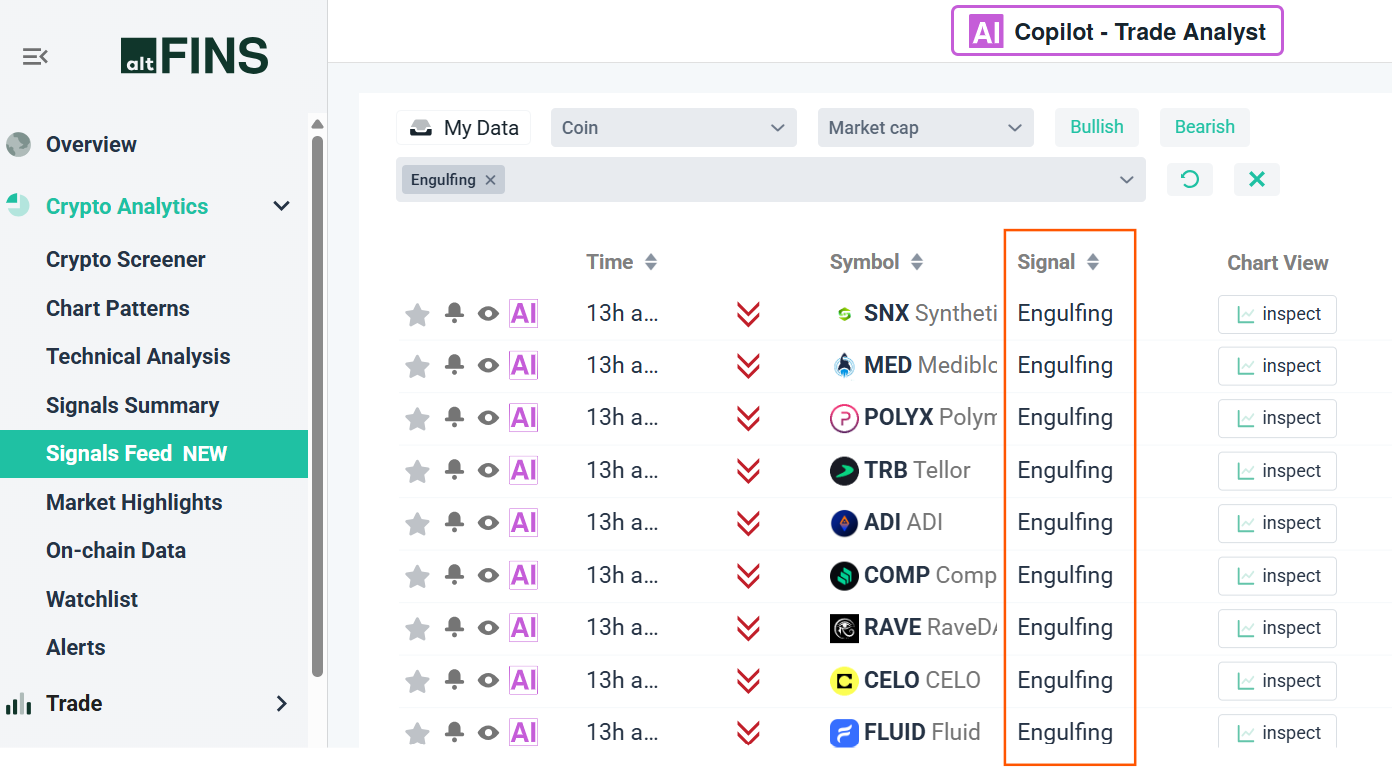
- Signals Feed: filter bullish or bearish engulfing pattern on Signals Feed section
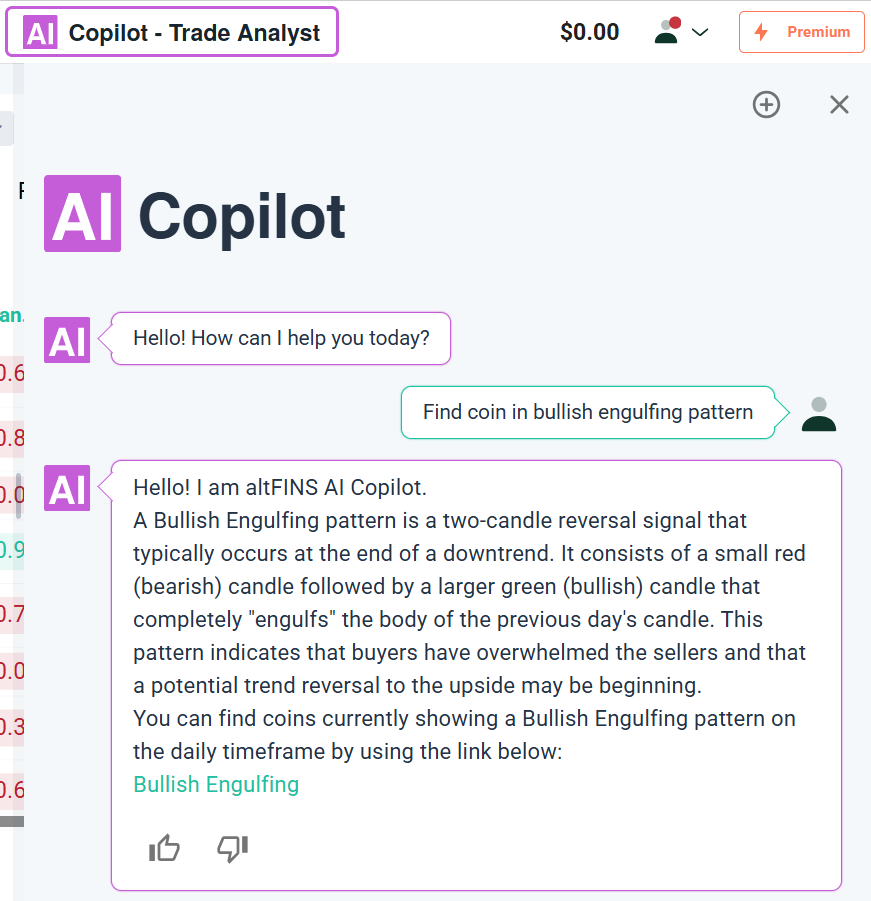
- AI Copilot: ask AI about filter to Engulfing patterns in plain langauge
- Alerts: create an alert so you are notified when a bearish engulfing candle prints on a coin you hold, instead of watching charts all day.
- Chart patterns: combine candles with automated chart pattern recognition, for example a bearish engulfing candle at the top of a rising wedge.
For a broader overview of every candle type, see Essential Candlestick Patterns for Crypto Traders.
Frequently asked questions
What does a bearish engulfing candle mean?
It means sellers overpowered buyers in a single session. After a green candle, a larger red candle opened at or above the prior close and closed below the prior open, wiping out the entire previous gain. When it appears after an uptrend or at resistance, it warns that the rally may be ending and a pullback or reversal could follow.
Is a bearish engulfing candle a buy or sell signal?
It is a sell or caution signal. Short sellers use it as a potential entry after confirmation, while spot holders use it to take partial profit or raise stops. It is not a buy signal. If price later closes above the engulfing candle’s high, the bearish signal has failed and the uptrend may resume.
How accurate is the bearish engulfing pattern?
Thomas Bulkowski’s research found price broke downward after the pattern 79% of the time, but it ranked 91 of 103 candlestick patterns for overall performance because the decline is often short. Accuracy improves when the pattern forms at resistance, after a strong rally, with rising volume and on the daily or 4 hour chart.
Does the bearish engulfing candle need confirmation?
Yes, in most cases. A common confirmation is the next candle closing below the engulfing candle’s low. Other confirmations include bearish RSI divergence, a volume spike on the red candle, or a break of a nearby support level. Waiting costs a little entry price but filters out many false signals, especially in sideways crypto markets.
What happens after a bearish engulfing candle?
Most often, price moves lower for a few sessions, then stalls at the next support level. Sometimes the pullback turns into a full trend reversal, and sometimes price recovers quickly and invalidates the pattern. That is why traders place a stop above the engulfing candle’s high and take profit at nearby support rather than hoping for a large decline.
What is the difference between bullish and bearish engulfing?
They are mirror images. A bullish engulfing forms after a downtrend, when a green body fully covers the prior red body, and signals a possible rally. A bearish engulfing forms after an uptrend, when a red body fully covers the prior green body, and signals a possible decline. Both need the right trend context to be meaningful.
Verdict
The bearish engulfing candle is one of the easiest reversal patterns to spot and one of the easiest to misuse. It is most useful as an early warning at the top of a rally, confirmed by a close below its low, and traded with a tight stop above its high and a nearby target. In the middle of a range it is mostly noise, as the September 15, 2026 Bitcoin example showed.
Want to find these setups without scanning charts by hand? Try the altFINS Crypto Screener and filter 2,000+ coins for fresh bearish engulfing candles in seconds.
This article is for educational purposes only and does not constitute financial advice. Cryptocurrency trading involves significant risk, including the possible loss of your entire investment. Candlestick pattern statistics are historical and do not guarantee future results. Always do your own research and manage your risk.
