

Search Knowledge Base by Keyword
How to Read Stock Charts: A Beginner’s Guide for 2026
To read a stock chart, start with the two axes: price runs up the right side and time runs along the bottom. Then read each candle or bar for the open, high, low and close, decide whether the trend makes higher highs or lower lows, mark support and resistance, and check whether volume confirms the move. Everything else, from moving averages to chart patterns, builds on those five steps.
This guide is for new investors and traders who open a chart and see a wall of red and green. It is also for crypto traders who want to apply the same skills to equities, since a candlestick on Apple reads exactly like a candlestick on Bitcoin.
By the end you will know the three chart types, how to read a single candle, a 7-step routine you can run on any ticker, which indicators matter first, and how stock charts differ from crypto charts. Updated October 2026.
Quick answer: A stock chart plots price (vertical axis) against time (horizontal axis). Read it in this order: timeframe, trend (higher highs and higher lows = uptrend), support and resistance, volume, then indicators such as the 50-day and 200-day moving averages and RSI. Candlestick charts are the most useful for beginners because each candle shows the open, high, low and close for one period.
Practice on live charts today: altFINS already charts and scans 200+ tokenized stocks such as AAPLx, NVDAx and TSLAx, with full stock coverage coming to the screener soon. Scan tokenized stocks in altFINS and apply every step below.
📊 What a stock chart shows
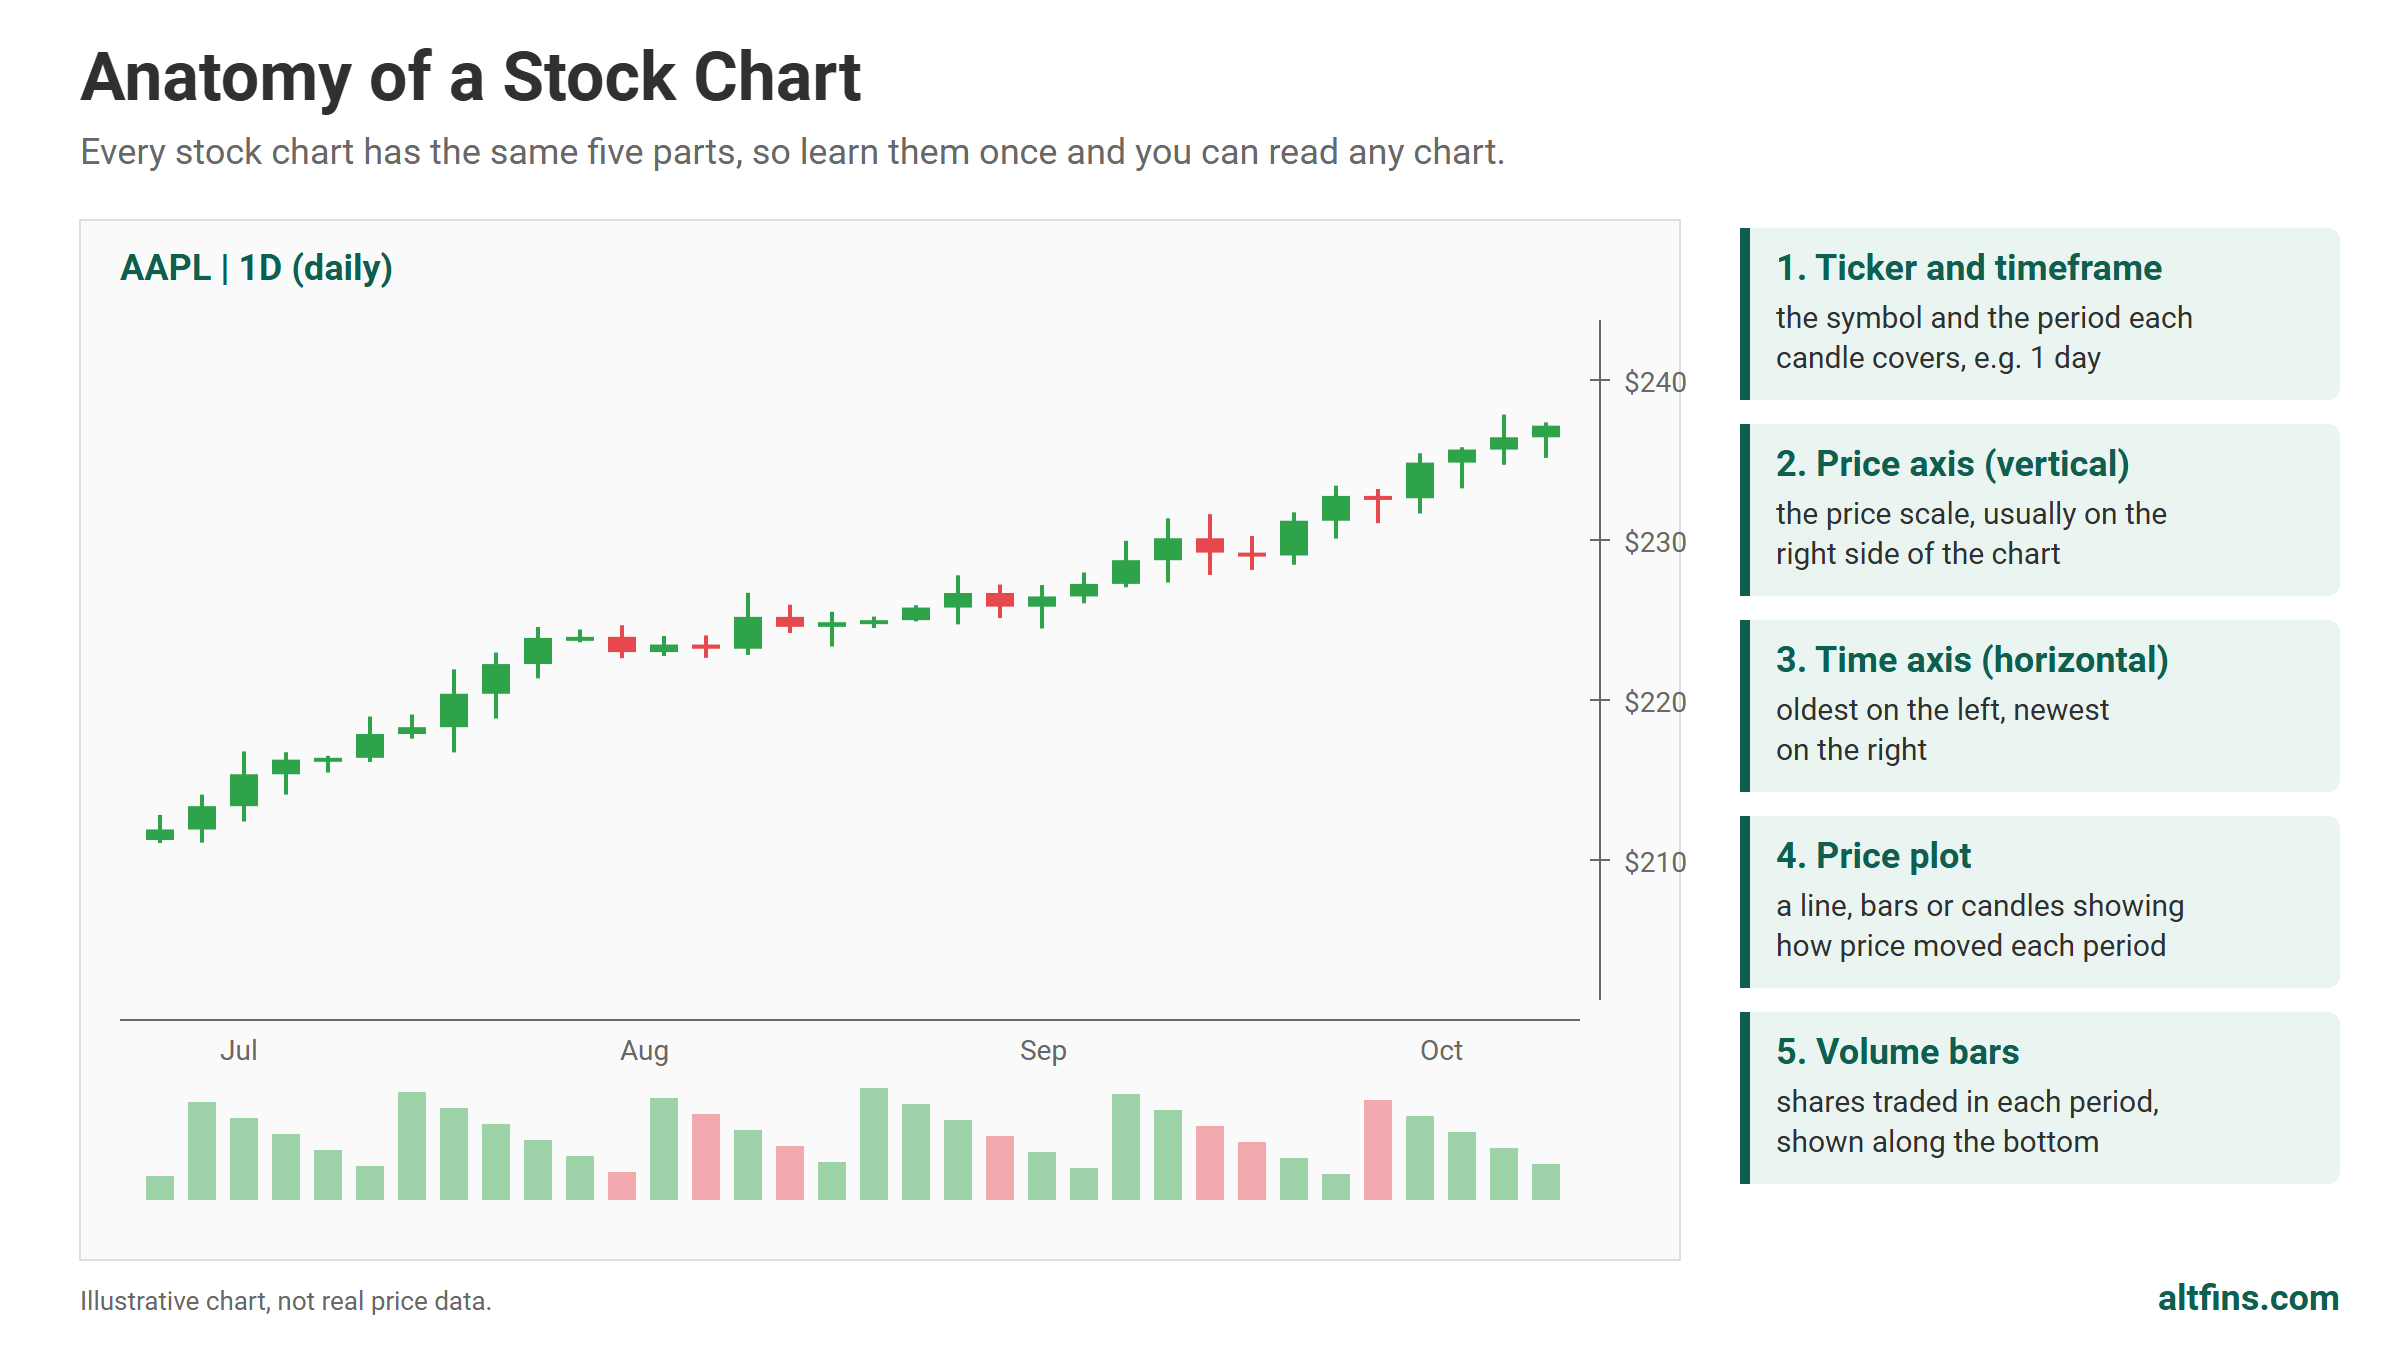
Takeaway: every stock chart has the same five parts, so learn them once and you can read any chart.
- Ticker and timeframe: the symbol (for example AAPL for Apple) and the period each candle covers, such as 1 day or 1 hour.
- Price axis (vertical): the price scale, usually on the right side of the chart.
- Time axis (horizontal): dates or times, oldest on the left and newest on the right.
- Price plot: a line, bars or candles that show how price moved in each period.
- Volume bars: the number of shares traded in each period, shown along the bottom.
Most platforms also let you switch between a linear and a logarithmic price scale. A log scale shows equal percentage moves as equal distances, which makes long-term charts of fast-growing stocks much easier to read.
The 3 types of stock charts compared
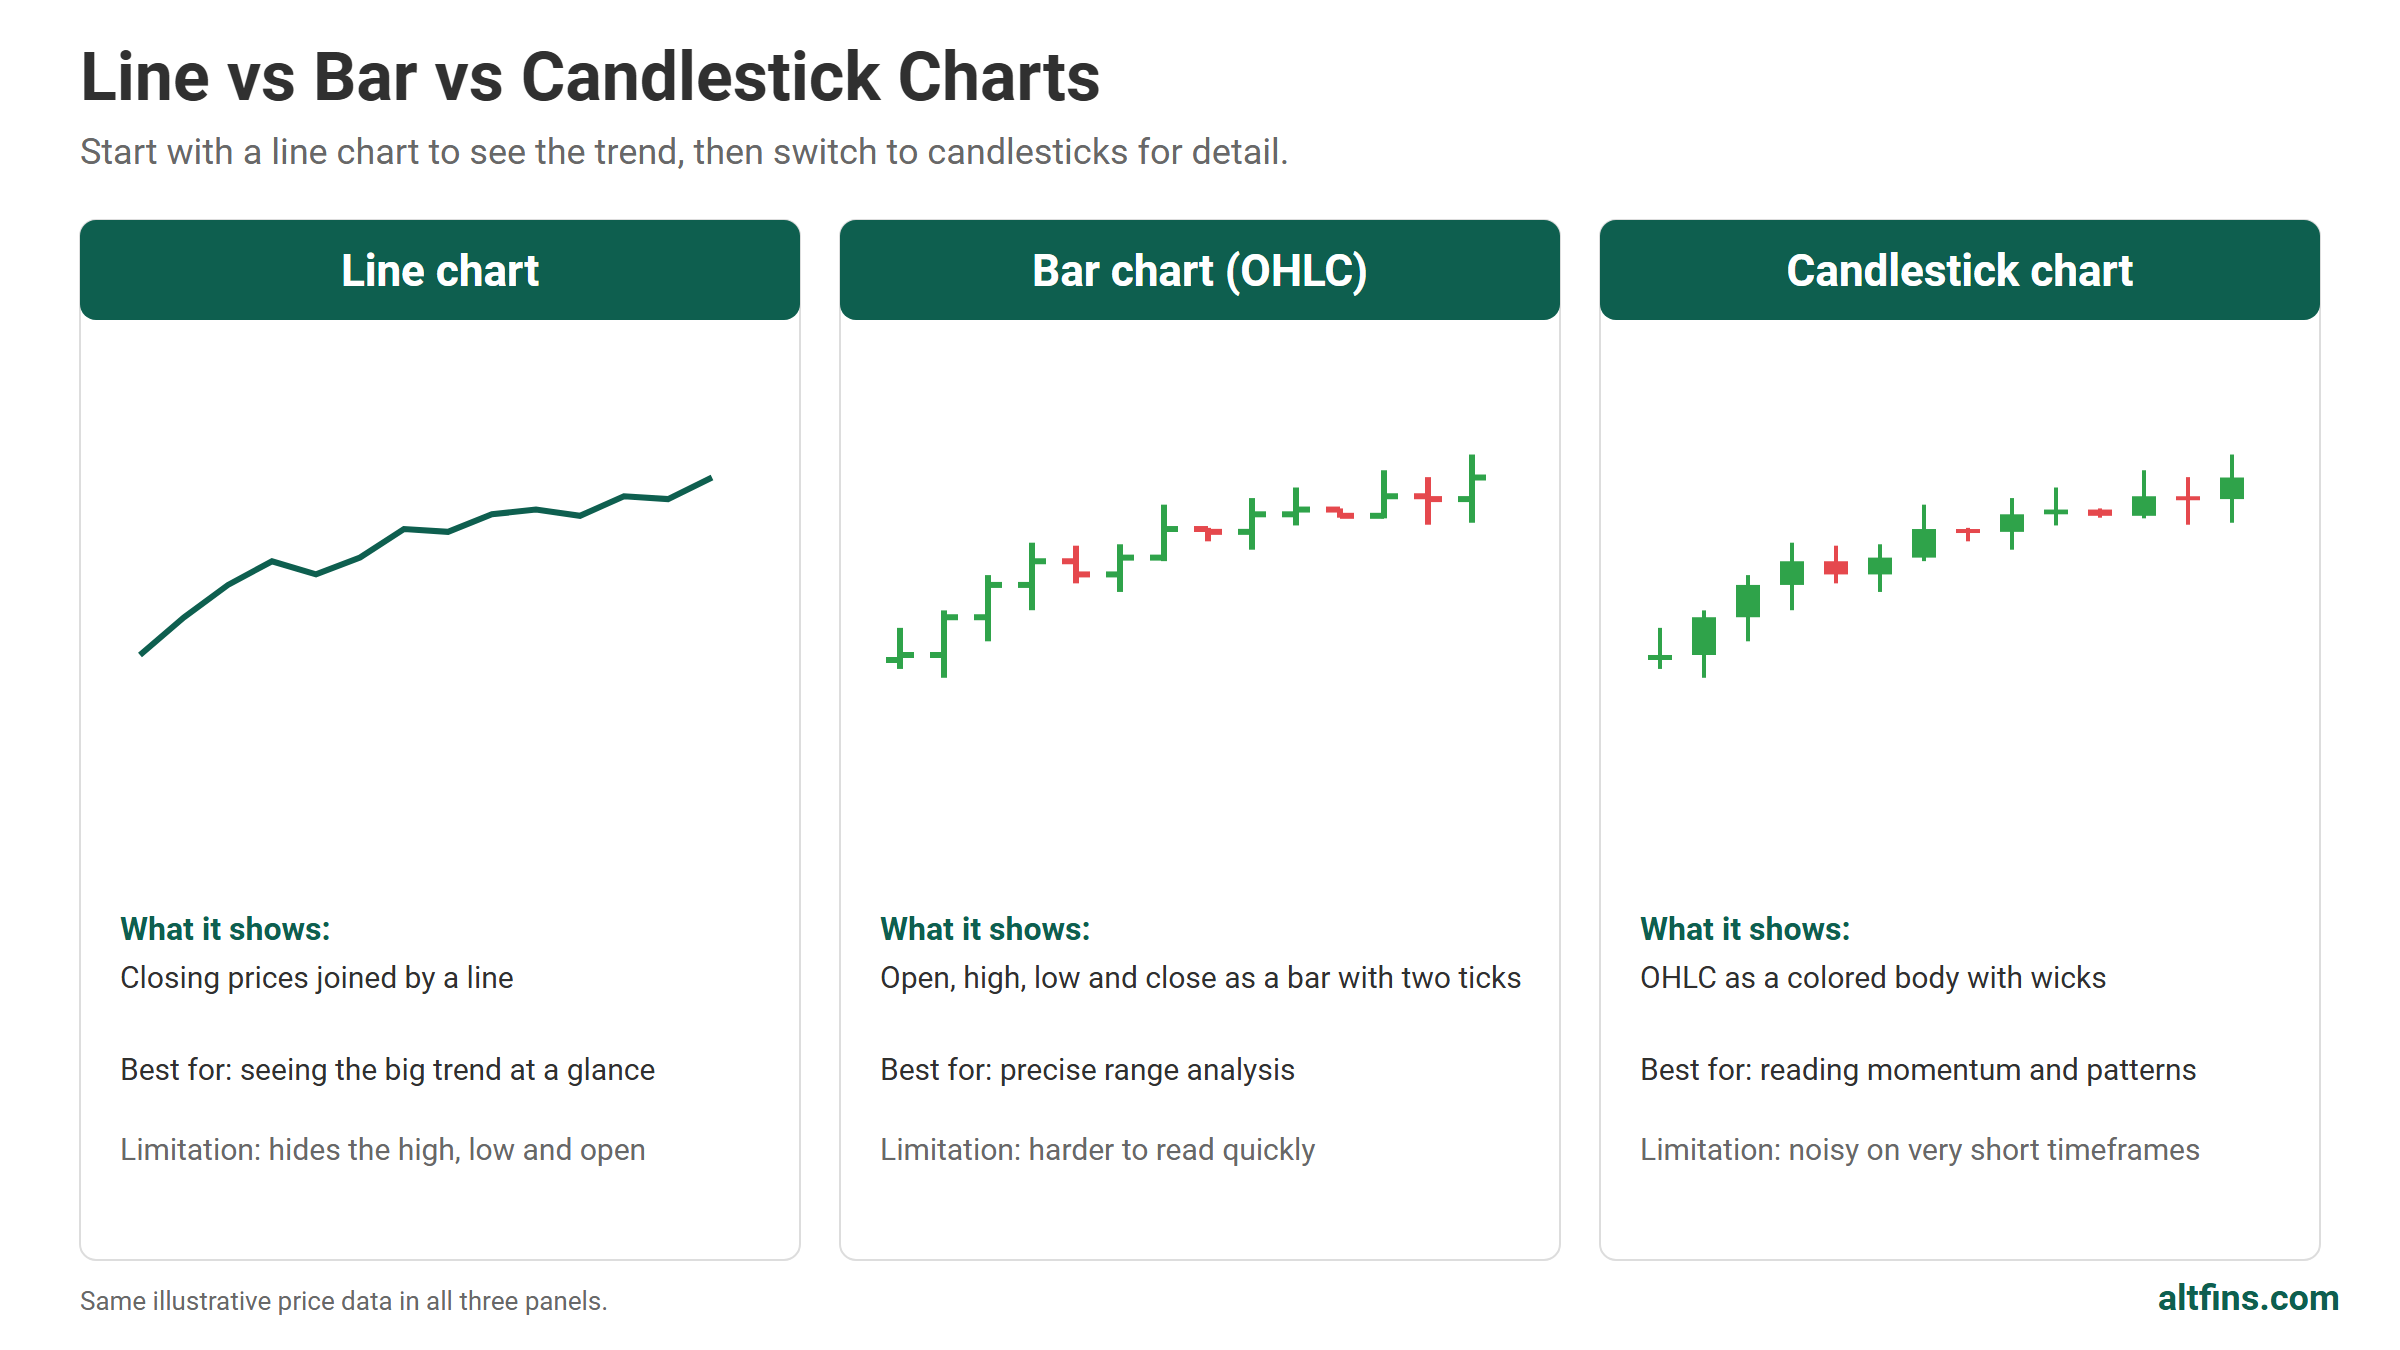
Takeaway: start with a line chart to see the trend, then switch to candlesticks for detail.
| Chart type | What it shows | Best for | Limitation |
|---|---|---|---|
| Line chart | Closing prices joined by a line | Seeing the big trend at a glance | Hides the high, low and open |
| Bar chart (OHLC) | Open, high, low and close as a vertical bar with two ticks | Precise range analysis | Harder to read quickly |
| Candlestick chart | Open, high, low and close as a colored body with wicks | Reading momentum and spotting patterns | Can look noisy on very short timeframes |
How to read a candlestick
Takeaway: one candle holds four prices, and its color tells you who won the period.
The thick body spans the open and the close. The thin lines above and below, called wicks or shadows, mark the highest and lowest prices of the period. A green (or hollow) candle closed above its open, so buyers won. A red (or filled) candle closed below its open, so sellers won.
What candle shapes tell you
- Long body, short wicks: strong conviction in one direction.
- Long lower wick: sellers pushed price down but buyers pushed it back up (as in a hammer).
- Long upper wick: buyers were rejected near the high (as in a shooting star).
- Tiny body (doji): buyers and sellers ended in a draw, often a sign of indecision.
Learn the most common shapes in our guide to essential candlestick patterns. They work the same way on stocks and crypto.
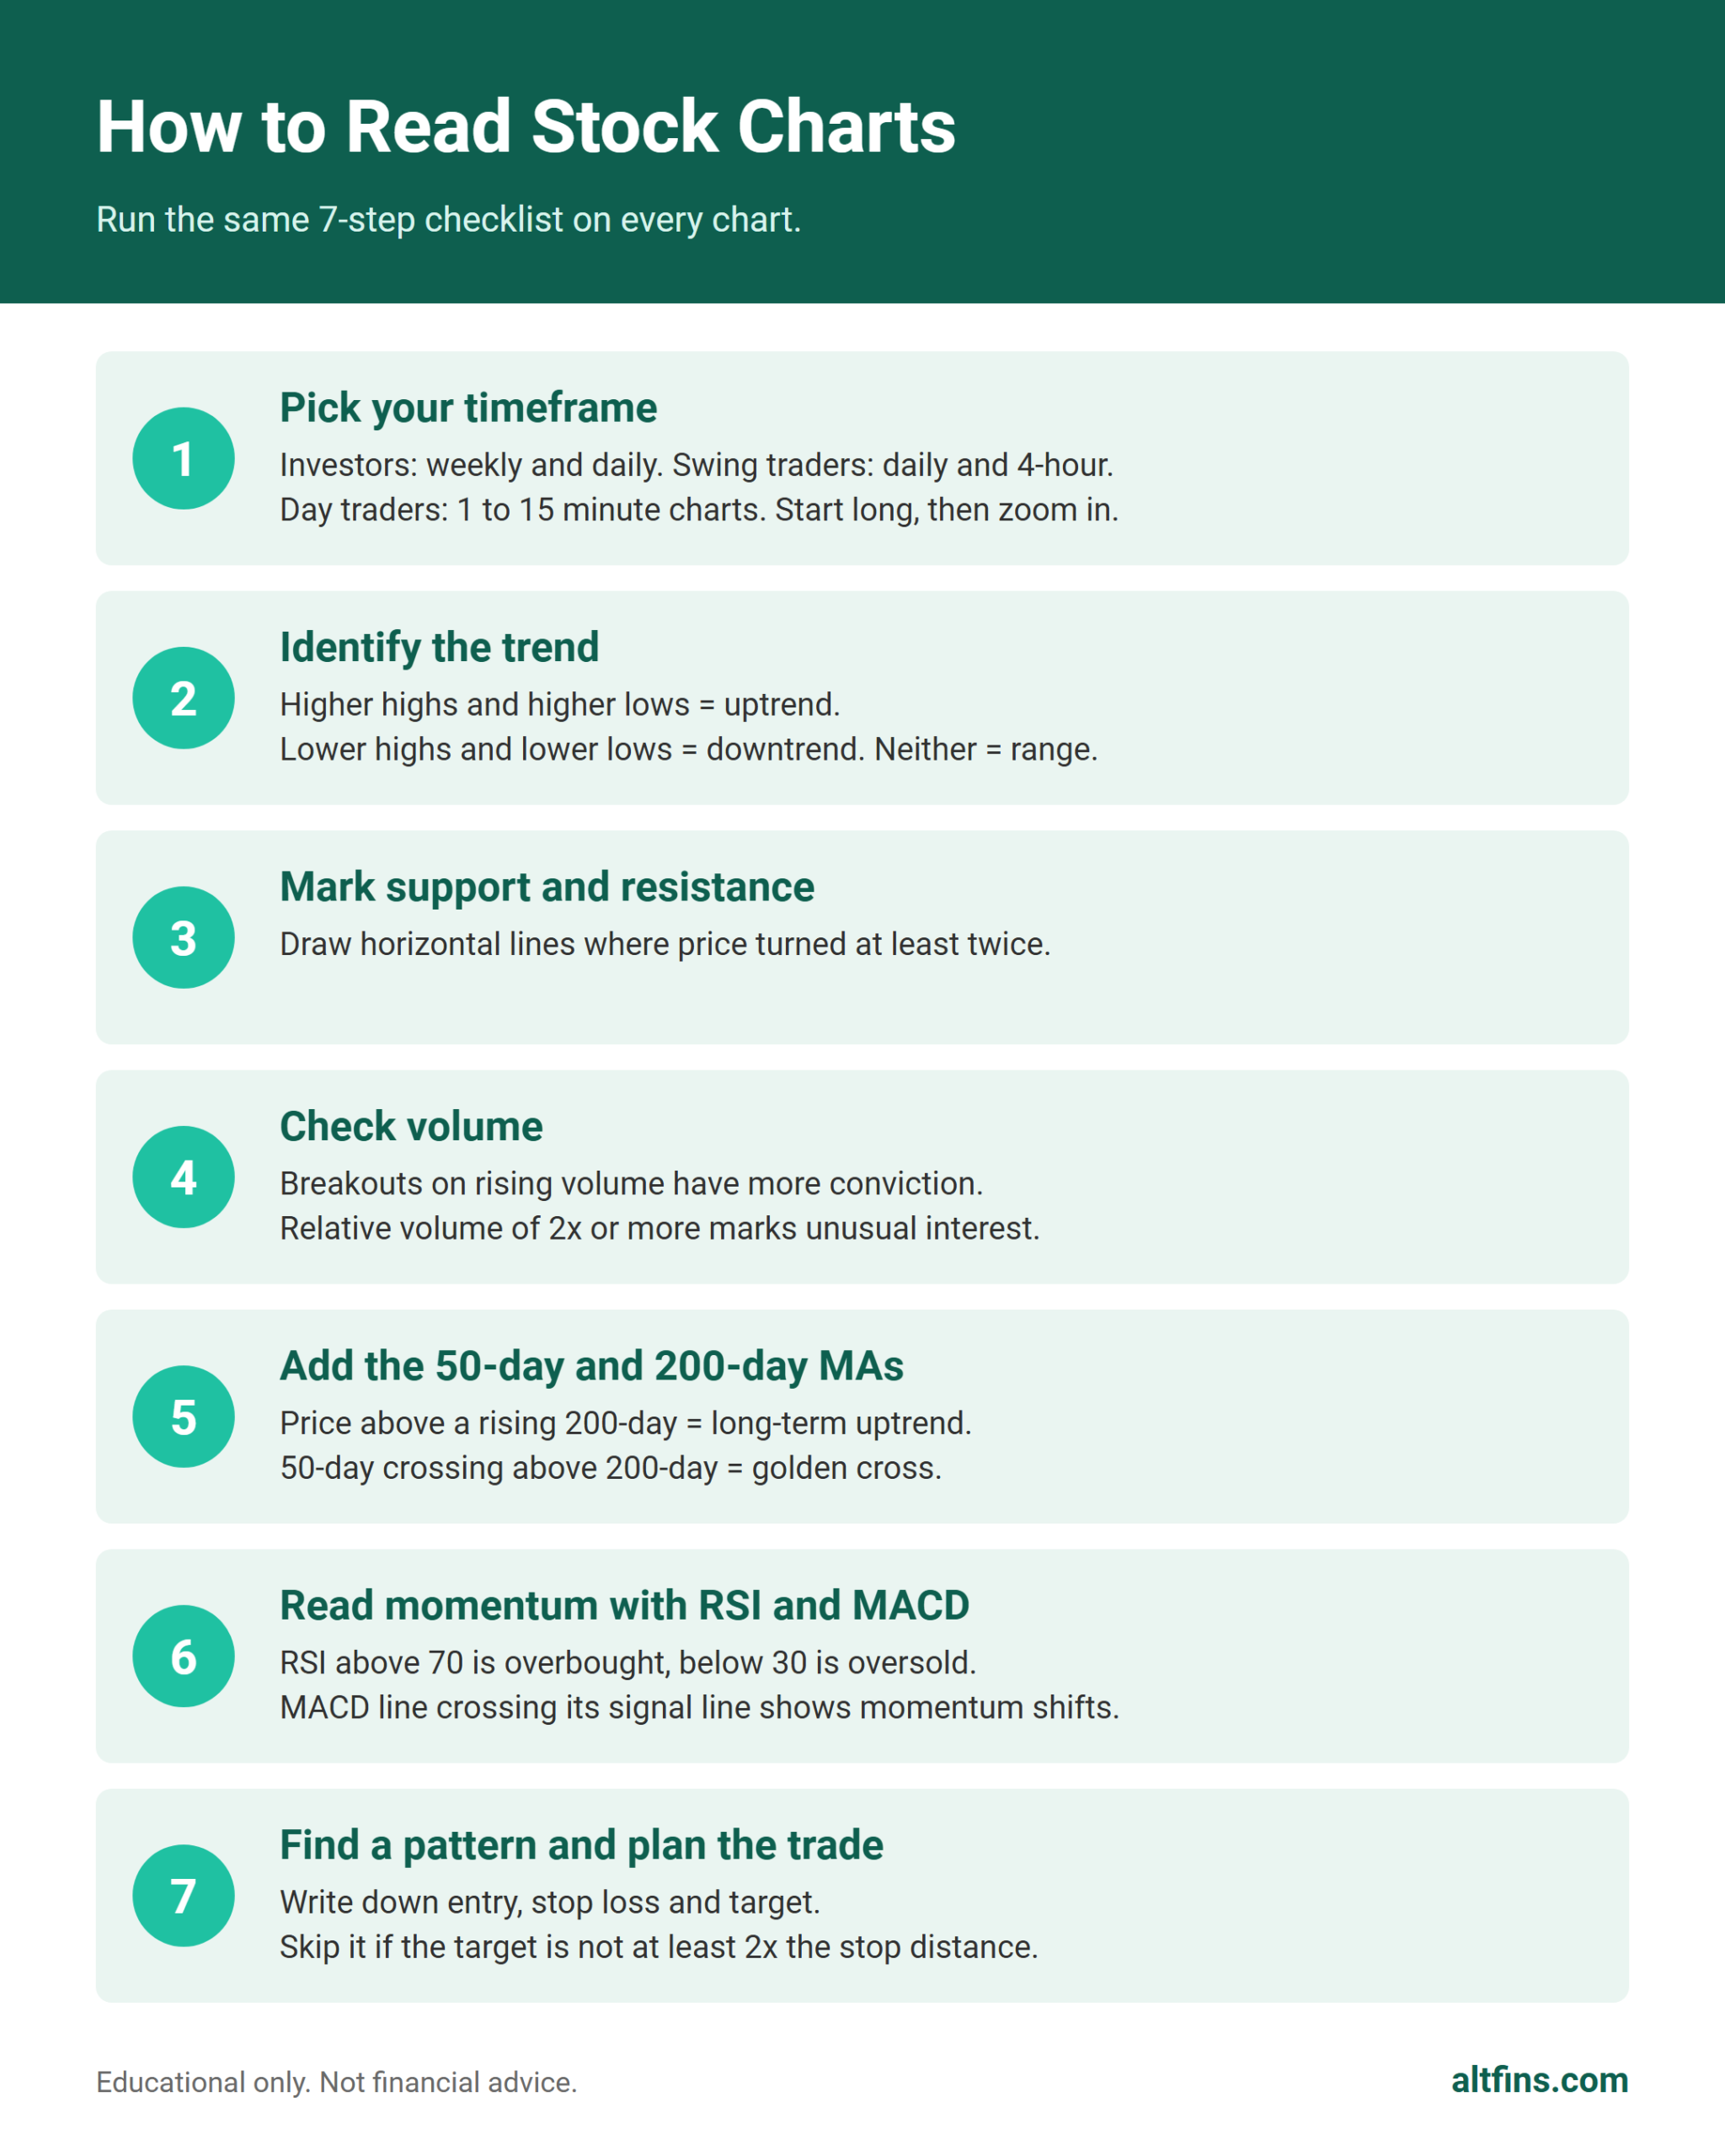
How to read stock charts in 7 steps
Takeaway: run the same 7-step checklist on every chart so emotion does not choose your trades.
Step 1: Pick your timeframe
Investors usually read weekly and daily charts. Swing traders use daily and 4-hour charts. Day traders use 1 to 15 minute charts. Start on a longer timeframe to see the big picture, then zoom in.
Step 2: Identify the trend
Higher highs and higher lows mean an uptrend. Lower highs and lower lows mean a downtrend. Neither means a sideways range. Trade with the trend until the chart proves it has changed.
Step 3: Mark support and resistance
Support is a price zone where buying has stopped declines before. Resistance is a zone where selling has capped rallies. Draw horizontal lines where price turned at least twice. Our guide to support and resistance lines shows how to draw them.
Step 4: Check volume
A breakout on rising volume has more conviction than one on thin volume. Compare today’s volume with the recent average: relative volume of 2x or more marks unusual interest worth a closer look.
Step 5: Add the 50-day and 200-day moving averages
A moving average smooths price into one line. Price above a rising 200-day average is a long-term uptrend. When the 50-day crosses above the 200-day, traders call it a golden cross; the opposite is a death cross. See SMA vs EMA to choose the right type.
Step 6: Read momentum with RSI and MACD
The Relative Strength Index (RSI) runs from 0 to 100; above 70 is overbought and below 30 is oversold. MACD (Moving Average Convergence Divergence) shows momentum shifts when its line crosses the signal line. Learn both in our RSI guide and MACD guide.
Step 7: Look for a pattern and plan the trade
Chart patterns such as triangles, flags, double bottoms and head and shoulders show where a breakout may come. Before entering, write down three prices: entry, stop loss and target. If the target is not at least twice the distance to the stop, skip the trade.
Do it in altFINS: steps 2 to 7 are already filters. In the altFINS screener you can filter by short, medium and long-term trend, SMA50 and SMA200, RSI14, MACD, relative volume and 52-week highs and lows, then let automated chart pattern recognition find triangles, wedges and flags for you. It works on crypto and tokenized stocks today.
The indicators beginners should learn first
Takeaway: two or three indicators are enough; more lines on the chart rarely mean better decisions.
| Indicator | What it tells you | Common setting | Beginner rule |
|---|---|---|---|
| Simple moving average (SMA) | Trend direction | 50 and 200 days | Favor longs above a rising 200-day |
| Volume | Conviction behind a move | Compare with 20-day average | Trust breakouts on above-average volume |
| RSI | Momentum, overbought or oversold | 14 periods | Above 70 is stretched, below 30 is washed out |
| MACD | Momentum shifts | 12, 26, 9 | Line crossing above signal hints at upside momentum |
| Bollinger Bands | Volatility | 20 periods, 2 standard deviations | A tight squeeze often comes before a big move |
Common chart patterns on stock charts
Takeaway: patterns are maps of supply and demand, and they appear on every liquid market.
- Continuation patterns (flags, pennants, ascending triangles) suggest the trend will resume. See how to trade ascending triangles.
- Reversal patterns (double tops and bottoms, head and shoulders, rising and falling wedges) suggest the trend may turn.
- Bilateral patterns (symmetrical triangles, rectangles) can break either way, so wait for the breakout.
For a full visual library, read Trading Patterns Explained and the chart patterns cheat sheet.
Stock charts vs crypto charts: what changes
Takeaway: the reading method is identical, but market hours create gaps on stock charts that crypto charts do not have.
| Feature | Stock charts | Crypto charts |
|---|---|---|
| Trading hours | NYSE core session 9:30 a.m. to 4:00 p.m. ET on weekdays, plus early and late sessions (NYSE) | 24 hours a day, 7 days a week |
| Price gaps | Common at the open after news or earnings | Rare, because trading never stops |
| Daily candle | One regular session | A full 24 hours, usually closing at 00:00 UTC |
| Volume | Consolidated across US exchanges | Split across many exchanges |
| Event risk | Earnings, dividends, splits | Token unlocks, listings, protocol news |
Tokenized stocks sit in between: they track a share price but trade around the clock, so their charts can move while the stock market is closed. Our tokenized stocks tutorial explains how to analyze them.
Do’s and don’ts when reading stock charts
| ✅ Do | ❌ Don’t |
|---|---|
| Start on the weekly or daily chart, then zoom in | Make decisions from a single 1-minute candle |
| Wait for a candle to close before acting | Chase a breakout in the middle of a candle |
| Confirm breakouts with volume | Stack ten indicators that all say the same thing |
| Set a stop loss before you enter | Ignore earnings dates on stock charts |
🚀 How altFINS helps you read charts faster
Takeaway: altFINS turns the 7-step checklist into filters, so you read only the charts that already pass.
- Screener: filter thousands of coins and 200+ tokenized stocks by trend, moving averages, RSI, MACD, unusual volume and 52-week levels in the altFINS screener. Full stock coverage is coming to the screener soon.
- Chart patterns: AI recognition flags triangles, wedges, flags, channels and more from 15-minute to daily charts, with entry, stop and target levels on Chart Patterns.
- Signals: the Signals Summary lists fresh crossovers, breakouts and oversold readings in one feed.
- Analyst charts: see how professionals mark trend, support and resistance on the Technical Analysis page.
Try it now: open the screener, add the filters “price above SMA200” and “relative volume above 2”, and you have a short list of strong trends with fresh interest to read with the 7 steps. Start screening for free.
Frequently asked questions
How do you read stock charts for beginners?
Start with a daily candlestick chart. Find the trend by checking for higher highs and higher lows, then draw support and resistance where price turned before. Check that volume rises on big moves, add the 50-day and 200-day moving averages, and only then look at RSI or MACD. Practice on several tickers before risking money.
What do green and red candles mean on a stock chart?
A green candle closed higher than it opened, so buyers controlled that period. A red candle closed lower than it opened, so sellers controlled it. Some platforms use hollow and filled candles instead. Color alone is not a signal; read it together with the candle’s size, its wicks and the volume behind it.
What is the best timeframe to read stock charts?
It depends on how long you plan to hold. Long-term investors use weekly and daily charts. Swing traders who hold for days to weeks use daily and 4-hour charts. Day traders use 1 to 15 minute charts. Whatever you choose, check one higher timeframe first so you trade with the larger trend, not against it.
What does volume tell you on a stock chart?
Volume shows how many shares changed hands in each period. A price move on high volume shows strong participation and is more likely to hold. A move on low volume can reverse easily. Traders compare current volume with the 20-day average; readings of two times average or more often appear around breakouts and news.
Which indicators should I use on stock charts?
Start with three: the 50-day and 200-day moving averages for trend, volume for conviction, and the 14-period RSI for momentum. Add MACD later if you want a second momentum view. Avoid stacking many indicators that measure the same thing, because they will agree with each other and give false confidence.
Is reading stock charts the same as reading crypto charts?
The method is the same: candles, trend, support and resistance, volume and indicators all work identically. The main difference is time. Stocks trade in set sessions, so their charts show gaps at the open, while crypto trades 24/7 with almost no gaps. Earnings reports also move stock charts in ways crypto charts do not see.
Verdict
Reading stock charts is a skill you can learn in a weekend and refine for years. Keep the order fixed: timeframe, trend, support and resistance, volume, moving averages, momentum, then a written trade plan. Charts do not predict the future, but they show you where the odds and the risk sit.
Ready to read charts with less guesswork? Let altFINS do the scanning: trend filters, pattern recognition and signals on thousands of coins and 200+ tokenized stocks, with stocks joining the screener soon. Open the altFINS screener or compare plans.
Disclaimer: This article is for educational purposes only and is not financial or investment advice. Trading stocks, tokenized stocks and cryptocurrencies involves substantial risk, and you can lose some or all of your capital. Past chart behavior does not guarantee future results. Do your own research and consider speaking with a licensed financial professional before making investment decisions.
