Search Knowledge Base by Keyword
Day Trading Stock Scanner: The 5 Scans Day Traders Use in 2026
A day trading stock scanner is a real-time tool that searches the whole market during the session and flags stocks that are moving right now, based on rules such as gap size, relative volume, new highs of day and breakouts. Instead of watching 8,000 tickers, you watch the 10 to 20 that meet your criteria, and you trade only the ones with a clean setup.
This guide is for new and intermediate day traders who want a repeatable process, and for crypto traders who already use scanners on 24/7 markets and want to apply the same logic to US stocks.
You will learn the five core scans, the exact filter settings, what features a scanner needs, how the 2026 change to the pattern day trader rule affects you, and how to build a pre-market routine. Updated October 2026.
Quick answer: A day trading stock scanner filters stocks in real time for intraday opportunities. The five most used scans are pre-market gappers, relative volume spikes, new high of day momentum, breakouts above key levels and reversal scans. Good starting filters are price between $2 and $50, relative volume above 2, float under 100 million shares and a gap of at least 4%. Real-time data is essential for day trading.
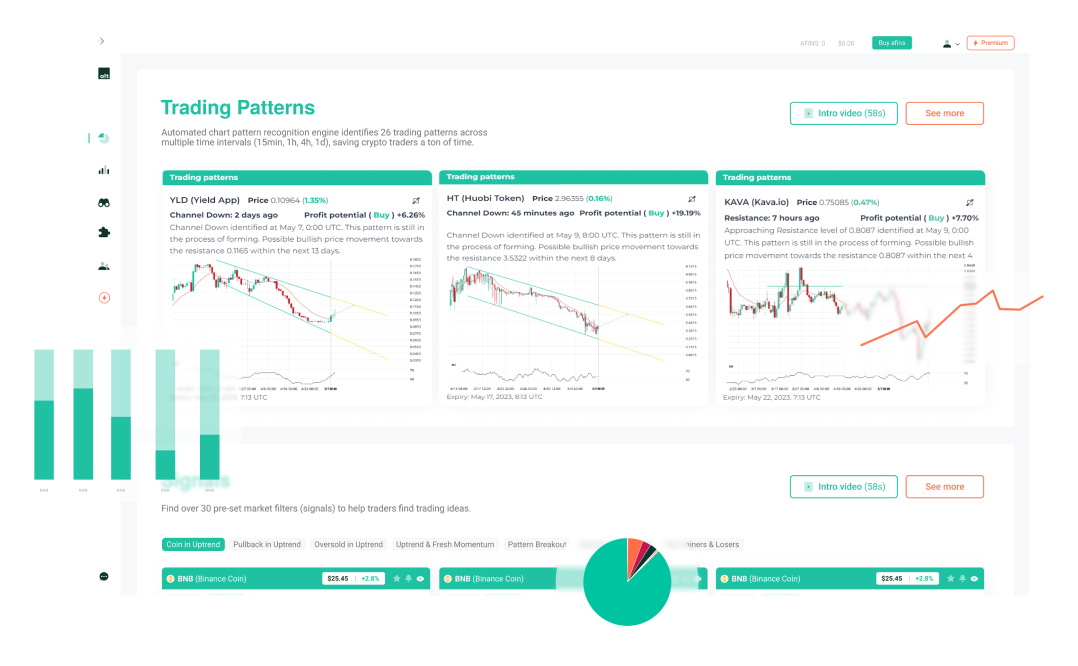
Learn scanning on a market that never sleeps: the altFINS screener runs relative volume, breakout and momentum scans on 15-minute, hourly and 4-hour candles across 2,000+ coins and 200+ tokenized stocks, with full stock coverage coming soon. Run your first intraday scan in altFINS.
⚡ What a day trading scanner does (and a screener does not)
Takeaway: a scanner reacts to live price action; a screener filters on end-of-day data.
People use “scanner” and “screener” interchangeably, but there is a useful difference. A stock screener usually runs on daily data and helps swing traders and investors build watchlists. A day trading scanner updates continuously during the session and alerts you the moment a stock meets your conditions, often within seconds.
| Feature | Day trading scanner | Stock screener |
|---|---|---|
| Data | Real-time, tick or 1-minute updates | End-of-day or delayed |
| Typical filters | Gap %, relative volume, high of day, halts | P/E, market cap, moving averages, 52-week range |
| Holding period | Minutes to hours | Days to months |
| Alerts | Instant pop-ups and sounds | Daily or saved-screen alerts |
| Best for | Day traders, scalpers | Swing traders, investors |
If you mostly swing trade, start with our list of the best free stock screeners instead.
The 5 day trading scans and their settings
Takeaway: five scans cover most intraday setups; master one before you add the next.
1. Pre-market gappers
Finds stocks opening well above or below the prior close, usually on news or earnings. Settings: gap of 4% or more, pre-market volume above 100,000 shares, price $2 to $50. Run it from 7:00 to 9:30 a.m. Eastern Time.
2. Relative volume spike
Relative volume (RVOL) compares current volume with the normal volume for that time of day. An RVOL of 2 means twice the usual activity. Settings: RVOL above 2, average volume above 500,000 shares. Stocks in play attract the liquidity day traders need. Read more in our RVOL indicator guide.
3. New high of day (momentum)
Flags stocks making a new intraday high, a sign that buyers are still in control. Settings: new high of day, RVOL above 1.5, price above VWAP (volume-weighted average price). Best in the first 90 minutes of the session.
4. Breakout above key levels
Catches stocks crossing the pre-market high, the prior day’s high or a multi-day resistance level. Settings: price crossing above the level, volume on the breakout candle at least 1.5 times the average. Learn how to mark levels in our guide to support and resistance.
5. Reversal (oversold bounce)
Finds stocks that have dropped hard and are starting to turn. Settings: down 10% or more on the day, RSI(14) on the 5-minute chart below 25, then a higher low. This is the riskiest scan; keep size small. Our RSI and RSI divergence guide explains the signal.
| Scan | Core filter | Confirmation | Best time (ET) |
|---|---|---|---|
| Pre-market gappers | Gap 4%+ | Pre-market volume 100k+ | 7:00 to 9:30 |
| Relative volume spike | RVOL above 2 | Average volume 500k+ | All session |
| New high of day | New intraday high | Price above VWAP | 9:30 to 11:00 |
| Breakout | Cross above key level | Volume 1.5x average | 9:45 to 11:30 |
| Reversal | Down 10%+, RSI below 25 | Higher low forms | 10:00 to 15:00 |
Scan intraday setups in altFINS: choose the 15-minute or hourly interval, then filter by relative volume, new highs, support and resistance breakouts or oversold RSI. Save the scan and get alerts. Build your intraday scan.
What the scanner showed today: relative volume in October 2026
Takeaway: relative volume quickly separates stocks in play from stocks on autopilot.
Here is a daily relative volume snapshot from the altFINS screener on 21 October 2026, using tokenized versions of US stocks. Tokenized stocks track the underlying shares but trade around the clock, so prices can differ slightly from the exchange.
| Tokenized stock | Price | Relative volume | RSI(14) | Read |
|---|---|---|---|---|
| AbbVie (ABBVx) | 289.47 | 1.86 | 65.3 | Heavy volume near the 52-week high of 293.54 |
| Tesla (TSLAx) | 380.16 | 1.53 | 57.7 | Volume pushing price back above the 200-day SMA |
| Thermo Fisher (TMOx) | 678.19 | 1.50 | 57.6 | Uptrend with above-average participation |
| Merck (MRKx) | 147.92 | 1.48 | 53.1 | Volume rising, price flat: watch for a range break |
| Amazon (AMZNx) | 263.58 | 1.41 | 59.5 | 50-day SMA just above the 200-day SMA |
Source: altFINS screener data, 21 October 2026. Examples only, not recommendations; values change through the day.
Features to look for in a day trading scanner
Takeaway: speed, custom filters and alerts matter more than the number of indicators.
- Real-time data: delayed quotes are useless for day trading. Check whether real-time exchange data is included or costs extra.
- Custom filters: gap %, RVOL, float, price, volume, VWAP and new high of day at a minimum.
- Multiple timeframes: 1-minute, 5-minute and 15-minute conditions.
- Instant alerts: audio, desktop or mobile alerts when a stock qualifies.
- News and halts: a catalyst column so you know why a stock is moving.
- Charting link: one click from the scanner to a chart with your levels.
Popular options in 2026 include Trade Ideas, Benzinga Pro, TradingView paid plans, Finviz Elite and broker tools from Webull, Moomoo and thinkorswim. Most offer a trial; test the filters you actually use before you pay.
Day trading rules changed in 2026: the end of the $25,000 minimum
Takeaway: the pattern day trader rule is being replaced by intraday margin standards, but your broker sets the details.
For years, US margin accounts flagged as “pattern day traders” needed at least $25,000 in equity. On 14 April 2026 the SEC approved FINRA’s amendments to Rule 4210 that remove the pattern day trader designation and the $25,000 minimum and replace them with new intraday margin requirements. FINRA Regulatory Notice 26-10 set the effective date as 4 June 2026, with a phase-in period for firms that runs to 20 October 2027.
In practice, brokers are rolling out the change on their own timelines and can apply stricter house rules. Check your broker’s current policy before you plan a day trading account, and remember that margin increases both gains and losses. FINRA’s investor guide to intraday margin explains the new framework.
A simple day trading scanner routine
Takeaway: a fixed routine stops the scanner from turning into a slot machine.
- 7:30 a.m. ET: run the gapper scan and note the catalyst for each name.
- 8:30 a.m.: cut the list to 3 to 5 stocks with clean daily charts and clear levels.
- 9:15 a.m.: mark the pre-market high and low, prior day high and low, and VWAP.
- 9:30 to 11:00 a.m.: trade only breakouts or pullbacks at your marked levels, with RVOL above 2.
- Every trade: stop below the level, risk 0.5% to 1% of the account, first target at 2:1.
- After the close: journal each trade, including what the scanner showed when you entered.
| Do | Don’t |
|---|---|
| Trade 1 or 2 scans you understand well | Run 10 scans and chase every alert |
| Check the catalyst before you enter | Buy a spike without knowing why it moved |
| Set a daily loss limit, such as 2% of the account | Revenge trade after a stop-out |
| Prefer liquid stocks with tight spreads | Trade low-float names you cannot exit |
How altFINS helps
Takeaway: altFINS gives you intraday scanning, pattern detection and alerts in one place.
- Intraday screener: 15-minute, hourly, 4-hour, 12-hour and daily intervals with relative volume, RSI, MACD, new high and breakout filters.
- Chart pattern recognition: triangles, flags, channels and wedges detected automatically, with breakout levels.
- Signals Summary: fresh bullish and bearish signals in one live feed.
- Alerts: saved scans can notify you when new assets qualify.
- Coverage: 2,000+ coins and 200+ tokenized stocks today, with full stocks coming soon. See the tokenized stocks screener guide.
Frequently asked questions
What is the best stock scanner for day trading?
The best scanner is the one with real-time data, the filters you use (gap %, relative volume, float, new high of day) and fast alerts at a price that fits your account. Well-known options include Trade Ideas, Benzinga Pro, TradingView paid plans and broker scanners such as thinkorswim and Webull. Test any tool on a trial with your own scans before paying.
What settings should I use on a day trading scanner?
A common starting point is price between $2 and $50, relative volume above 2, average volume above 500,000 shares, float under 100 million shares and a gap of at least 4% for pre-market scans. Add new high of day or a breakout above the pre-market high as the trigger. Adjust based on your account size and style.
Are free stock scanners good enough for day trading?
Free scanners usually show delayed data and limited intraday filters, which makes them weak for fast day trading. They work well for building a pre-market watchlist or for swing trading. If you day trade actively, real-time data from your broker or a paid scanner is worth considering, but only once your strategy is proven.
Do you still need $25,000 to day trade stocks?
The SEC approved FINRA’s removal of the $25,000 pattern day trader minimum in April 2026, effective 4 June 2026, replacing it with intraday margin standards. Brokers have until 20 October 2027 to fully implement the change and may keep stricter house rules. Check your broker’s current requirements before opening a margin account for day trading.
What is relative volume in a stock scanner?
Relative volume compares a stock’s current volume with its average volume over the same period, often the last 10 to 30 days. A reading of 1 is normal, while 2 or higher means the stock is trading at least twice its usual activity. Day traders use it to find stocks in play, because higher volume brings tighter spreads and cleaner moves.
Verdict
A day trading stock scanner is a filter, not a strategy. Pick one or two scans, set strict liquidity and volume rules, mark your levels before the open and trade only the setups you have tested. The scanner finds movers; your risk rules decide whether you are still trading next month.
Practise intraday scanning before stocks launch. Run relative volume, breakout and momentum scans on 15-minute to daily candles in altFINS, with alerts on new matches. Start scanning for free or see altFINS plans.
Disclaimer: This article is for educational purposes only and is not financial or investment advice. Day trading stocks, tokenized stocks and cryptocurrencies is highly risky, and most day traders lose money. Margin rules vary by broker. Tool names are listed for information only; altFINS does not receive payment for mentioning them. Do your own research and consider speaking with a licensed financial professional before trading.