Search Knowledge Base by Keyword
When to Sell Crypto: 4 AI Prompts to Exit, Trim, Cut or Hold (Tested Live, 2026)
Last updated: October 21, 2026 | Data tested: October 21, 2026 (live altFINS MCP data) | Reading time: 11 minutes
Every trader has a plan for buying. Very few have a plan for selling. That is where most of the money is made or lost.
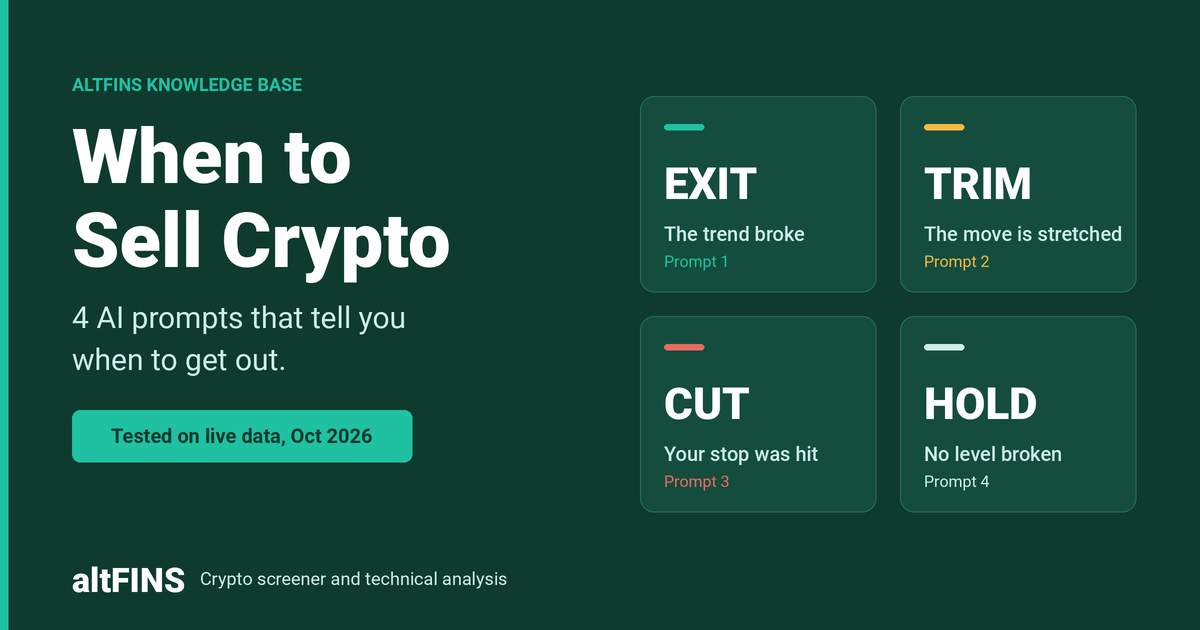
This guide answers one question: when should you sell crypto? You get a simple framework with four decisions (Exit, Trim, Cut and Hold), one AI prompt for each, and real results from live altFINS MCP data on October 21, 2026. Every prompt works with any coin you hold, and none of them needs a connected portfolio.
⚡ QUICK ANSWER: WHEN TO SELL CRYPTO
Sell when the reason you bought is no longer true. In practice, that comes down to four decisions:
- Exit when the trend you bought has turned down.
- Trim part of the position when the move is stretched (RSI above 70).
- Cut when price closes below the stop you set before entering.
- Hold when none of your invalidation levels have been hit.
In our live test, the Exit prompt flagged Dogecoin’s trend break on October 7, about 8% above today’s price. The Trim prompt flagged Quant (QNT) at RSI 96 before a 31% pullback.
📑 In this guide
- The one rule for selling crypto
- How to connect your AI to live data
- Prompt 1: Exit (the trend broke)
- Prompt 2: Trim (the move is stretched)
- Prompt 3: Cut (set your stop loss)
- Prompt 4: Hold (check your invalidation levels)
- Bonus: the daily watchlist warning scan
- 5 selling mistakes to avoid
- Cheat sheet
- FAQ
The One Rule for Selling Crypto
You bought for a reason. Maybe the trend was strong, maybe price bounced off support, maybe the project was undervalued. Your sell decision should test that same reason. That is what a good crypto exit strategy does: it defines, before you buy, what would make you sell.
This is why “should I sell?” is the wrong question to ask an AI. The AI does not know your entry, your timeframe or why you bought. The right question is: “Which of my conditions are still true?” The AI checks the data. You make the call.
| Decision | What it means | Data that triggers it |
|---|---|---|
| 🚪 Exit | Close the whole trade | Medium-term trend downgrade, close below the 50-day SMA |
| ✂️ Trim | Take partial profit, let the rest run | RSI above 70, price near resistance or ATH |
| 🛑 Cut | Take the planned loss | Daily close below support plus an ATR buffer |
| ✅ Hold | Do nothing, on purpose | None of your invalidation levels are hit |
How to Connect Your AI to Live Crypto Data
The altFINS MCP server is a read-only connection that gives AI assistants live access to altFINS data: the screener, trend scores, indicators, support and resistance levels, analyst trade setups, signals and indicator history across 2,000+ assets. MCP stands for Model Context Protocol, an open standard for connecting AI tools to outside data.
- Get a free API key. The free plan includes 1,000 credits per month. See the step-by-step API key guide.
- Add the server
https://mcp.altfins.com/mcpto your AI client. Guides: Claude Desktop and Perplexity Pro. - Paste a prompt below. Setup takes about 2 minutes.
It also works with VS Code (GitHub Copilot), Microsoft Copilot Studio, n8n and the Claude API. Full setup is in the altFINS MCP documentation.
Prompt 1: Exit When the Trend Breaks
Use it if: you bought a coin because it was trending up and you hold for weeks.
COPY THIS PROMPT
Using altFINS, I bought DOGE as a medium-term trend trade. Is the medium-term trend still Up? Is price above or below the 50-day SMA? Show the medium-term trend history for the last 30 days and tell me the first day it was downgraded.
Live result (October 21, 2026):
| Date | Medium-term trend | DOGE close |
|---|---|---|
| Oct 6 | Maximum score | $0.0937 |
| Oct 7 | First downgrade (exit signal) | $0.0890 |
| Oct 15 | Below the midpoint | $0.0811 |
| Oct 21 (today) | Strong Down (1/10) | $0.0821 |
Today DOGE trades below its 50-day SMA ($0.0880). Its short-term trend is 0/10 and its medium-term trend is 1/10. Yet its long-term trend still reads Strong Up (8/10).
💡 How to use it
This is the classic “zoom out” trap. The long-term chart says everything is fine, while the trend you actually traded broke two weeks ago. A trader who acted on the first downgrade on October 7 sold near $0.089, about 8% above today’s price. Match the exit trend to the trend you bought. Learn more: Short, Medium and Long-Term Trend.
Run these prompts on your own coins
Free plan with 1,000 credits per month. Setup takes about 2 minutes.
Prompt 2: Trim When the Move Is Stretched
Use it if: you are in profit and the coin is running fast.
An RSI above 70 is not a reason to sell everything. In strong uptrends, RSI can stay overbought for days. It is a reason to take some profit. The signal to sell the rest is momentum fading, which a bearish MACD crossover shows.
COPY THIS PROMPT
Using altFINS, I’m in profit on [COIN]. Check: is RSI 14 above 70? Is price within 5% of resistance or the all-time high? Is the MACD line below its signal line? Show the last 30 days of RSI 14 and MACD history.
Live result, looking back at Quant (QNT):
| Date | Signal | QNT close |
|---|---|---|
| Sep 22 | RSI 67.5, rally starting | $73.82 |
| Sep 24 to 30 | RSI above 70 for 7 days in a row (trim zone) | $90 to $287 |
| Sep 27 | RSI peaked at 96.4 | $286.27 |
| Oct 9 | MACD crossed below signal (momentum gone) | $248.15 |
| Oct 21 (today) | RSI 50 | $197.59 |
QNT rose 289% from September 22 to September 30. Since the Sep 30 close it has fallen 31%. A trader who trimmed in the RSI zone and sold the rest on the MACD cross exited between $248 and $287. Holding through it meant giving back a large part of the gain.
The same check on two coins today:
| Coin | RSI 14 | MACD vs signal | Read |
|---|---|---|---|
| Quantum (Q), +377% in a month | 77.9 | Above (still bullish) | In the trim zone, momentum intact |
| Pepe (PEPE), +14.8% in a month | 60.9 | Above (still bullish) | No warnings, next resistance about 17% higher |
💡 How to use it
Split the decision in two. RSI above 70 tells you to bank part of the move. A bearish MACD cross tells you the move is over. Learn more: Trading RSI, MACD explained and How to take profits in crypto.
Prompt 3: Cut With a Crypto Stop Loss You Set in Advance
Use it if: you have just entered a trade, or you are holding one without a stop.
A stop exactly at support gets hit by normal noise. A stop far below support turns a trade into hope. The fix is to place the stop below support with a buffer of one Average True Range (ATR), which measures how much the coin normally moves in a day.
COPY THIS PROMPT
Using altFINS, I bought SOL at $110. Find the nearest support below my entry and the daily ATR. Put my stop one ATR below that support. How far is the stop from my entry in %, and has price already closed below it? Also pull the altFINS analyst trade setup for SOL.
Live result (October 21, 2026):
| SOL price now | $106.81 |
| Nearest support below $110 | $100.42 |
| Daily ATR | $4.82 |
| Stop (support minus 1 ATR) | $95.60, which is 13.1% below entry |
| Closed below the stop? | No, keep the trade |
| altFINS analyst setup | Entry near $100 support, target $120, stop $93 |
💡 How to use it
Same coin, same support, very different math. From a $110 entry, the trade risks 13% to reach a $120 target that is only 9% away. From the analyst entry near $100, it risks 7% for 20% upside. Your exit is decided by your entry. Set the stop before you buy, then let a price alert watch it for you. Learn more: ATR indicator and Support and Resistance.
Prompt 4: Hold Until an Invalidation Level Breaks
Use it if: a coin is down and you feel the urge to sell, but you are not sure the setup is broken.
This is the most useful prompt in the guide because it stops emotional selling. Instead of asking for a verdict, it asks the AI for a checklist with exact price levels.
COPY THIS PROMPT
Using altFINS, list the conditions that would invalidate holding AVAX on the daily timeframe, with exact price levels: support, the 50-day SMA, the medium-term trend and MACD. Which of them are true today, and how far is price from each level?
Live result (October 21, 2026), AVAX at $9.69, down 14.4% in a month:
| Invalidation condition | Level | True today? |
|---|---|---|
| Daily close below support | $9.26 (4.4% below price) | ❌ No |
| Daily close below 50-day SMA | $9.55 (1.4% below price) | ❌ No |
| Medium-term trend turns down | Currently Up (7/10) | ❌ No |
| MACD below signal line | MACD -0.056 vs signal 0.109 | ⚠️ Yes |
💡 How to use it
A 14% monthly drop feels like a sell. The data says only 1 of 4 conditions is true: momentum is weak, but the structure is intact. The level to watch is the 50-day SMA at $9.55, just 1.4% away. A daily close below it is the first real crack. Holding is a decision too, as long as you know the price that changes it. Learn more: Trading Risk Management.
Bonus: The Daily Watchlist Warning Scan
This scan is not a sell signal. It is a list of large coins whose trend has already broken, so you can check whether any of them are in your bag.
COPY THIS PROMPT
Using altFINS, find coins above $500M market cap with a Strong Down short-term and medium-term trend, trading below the 50-day SMA. Exclude stablecoins and gold-backed tokens. Show the 1-month change.
Live result (October 21, 2026): TRON (TRX, -3.2% in a month), Dogecoin (DOGE, -6.1%), Toncoin (TON, -3.0%), MemeCore (M, -48.3%) and OFFICIAL TRUMP (TRUMP, -12.2%). If you hold one of them, run Prompt 1 or Prompt 4 on it next.
🧩 THE ALL-IN-ONE SELL CHECK
Save this one. It runs all four decisions in a single question:
Using altFINS, I bought [COIN] at $[PRICE] as a [short / medium / long]-term trade. Check four things: (1) has my trend been downgraded, (2) is RSI 14 above 70 or is MACD below signal, (3) where is support minus one ATR and has price closed below it, (4) which invalidation levels are true today. Show the data behind each answer. Do not tell me what to do.
5 Selling Mistakes to Avoid
- Moving your stop lower. A stop you move is not a stop. Decide it before you enter.
- Using the wrong timeframe. A medium-term trade judged by the long-term trend hides the exit, as DOGE showed.
- Selling everything at RSI 70. Overbought can last. Trim first, then let MACD decide the rest.
- Selling on a red day alone. A drop is not an invalidation. Check your levels, like the AVAX example.
- Asking AI “should I sell?” Ask for conditions and levels instead. The AI should show data, and you should decide.
Cheat Sheet: When to Sell Crypto
| Decision | Trigger | Live example (Oct 21, 2026) |
|---|---|---|
| Exit | Trend downgrade, close below 50-day SMA | DOGE downgraded Oct 7 at $0.089 |
| Trim | RSI above 70, then bearish MACD cross | QNT RSI 96 on Sep 27, MACD cross Oct 9 |
| Cut | Close below support minus 1 ATR | SOL stop $95.60 from a $110 entry |
| Hold | No invalidation level broken | AVAX: 1 of 4 true, watch $9.55 |
🔑 Key takeaways
- Sell when the reason you bought stops being true.
- Judge the exit on the same timeframe as the entry.
- Trim on overbought, exit on fading momentum.
- Set the stop before you buy, using support and ATR.
- Ask AI for levels and conditions, never for a verdict.
Frequently Asked Questions
When should you sell crypto?
Sell when the reason you bought is no longer valid: the trend you traded has turned down, the price has closed below your stop, or the move is so stretched that taking partial profit makes sense. If none of those are true, holding is a valid decision.
How do you know when to sell crypto for profit?
Take partial profit when the move is stretched, for example when RSI 14 rises above 70 or price nears resistance or the all-time high. Sell the rest when momentum fades, which a bearish MACD crossover shows. In our QNT example, that meant trimming between September 24 and 30 and exiting the rest on October 9.
Is RSI above 70 a sell signal?
Not on its own. RSI above 70 means a coin is overbought, but strong uptrends can stay overbought for days. QNT stayed above 70 for 7 days in a row in September 2026. Use it as a signal to take partial profit, and use a bearish MACD crossover to decide on the rest.
Where should I put a crypto stop loss?
A common method is to place it below the nearest support level with a buffer of one Average True Range (ATR). This keeps the stop out of normal daily noise. Decide it before you enter, not after the price drops.
Can AI tell me when to sell crypto?
AI can check live data against your rules much faster than you can by hand. It cannot know your entry, timeframe or goals unless you tell it. With the altFINS MCP, the AI reads real trend scores, indicators and levels instead of guessing. The decision stays with you.
Do I need to connect my portfolio?
No. Every prompt in this guide works by naming the coin and your entry price in the prompt itself.
Is the altFINS MCP free?
You can start free. The Basic API plan includes 1,000 credits per month, and paid API plans start at $39 per month. The MCP is read-only, so it cannot place trades or access your funds.
Can I do this without AI?
Yes. Trend scores, RSI, MACD, ATR and support levels are all in the altFINS Crypto Screener, and analyst setups are in Technical Analysis. Looking for entry prompts instead? See 10 Best AI Prompts for Crypto Trading.
Know your exit before you need it
Connect your AI to live altFINS data and run the all-in-one sell check on any coin. Free plan, about 2 minutes to set up.
Disclaimer: This article is for educational purposes only and is not financial advice. All results reflect live altFINS data on October 21, 2026, and will differ when you run the prompts. Entry prices used in the examples are hypothetical. The coins shown are examples, not recommendations. Crypto assets are volatile. Always do your own research and manage your risk.