Search Knowledge Base by Keyword
Death Cross Stocks: What the Signal Means and How to Trade It in 2026
Death cross stocks are stocks whose 50-day moving average has just crossed below their 200-day moving average. The signal tells you that medium-term momentum has turned weaker than the long-term trend, and it often marks the start of a longer downtrend. It is also a lagging signal: on major indexes, many death crosses have appeared close to short-term lows, so it works best as a risk filter, not as an automatic sell button.
This guide is for investors who want a simple rule for when to reduce risk, and for swing traders who short or avoid weak stocks. If you already trade the death cross on Bitcoin and altcoins, you will see how the same signal behaves on equities.
You will learn how the death cross forms, what history says about it, how to screen for death cross stocks, which large caps show the signal in October 2026, and how to act on it.
Quick answer: A death cross happens when a stock’s 50-day simple moving average (SMA) crosses below its 200-day SMA. It confirms that a downtrend is in place rather than predicting one. To find death cross stocks, screen for a fresh 50/200 bearish crossover, then check that price is below both averages, the 200-day SMA is turning down and volume is rising on declines. Its bullish opposite is the golden cross.
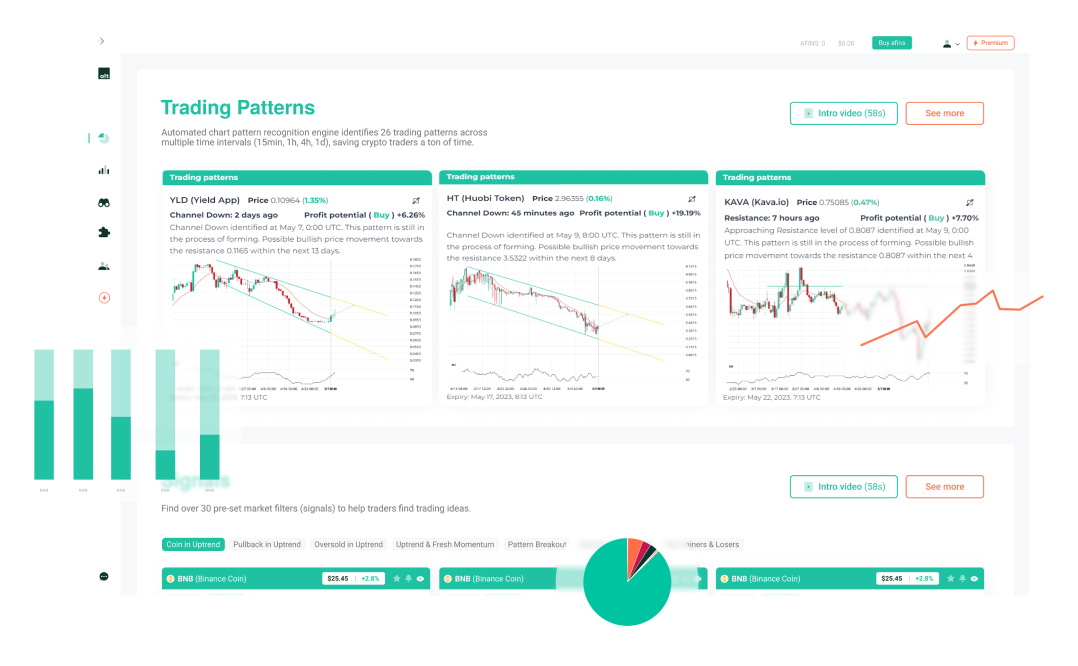
Spot weakening trends early: altFINS scans SMA 50/200 bearish crossovers, trend downgrades and support breakdowns across 2,000+ coins and 200+ tokenized stocks, with full stocks coming soon. Scan for death crosses in altFINS.
☠️ What is a death cross?
Takeaway: the death cross confirms a downtrend; it is a warning to manage risk, not a prediction of a crash.
A moving average is the average closing price over a set number of days. The 50-day SMA reflects the medium-term trend; the 200-day SMA reflects the long-term trend and is the line many funds use to decide whether a stock is in a bull or bear phase. If the 50-day line falls through the 200-day line, recent prices have been weak enough to drag the medium-term average below the long-term one.
A death cross usually unfolds in three stages:
- Topping: an uptrend stalls and price starts making lower highs.
- The cross: the 50-day SMA crosses below the 200-day SMA, confirming the turn.
- Continuation: price stays below both averages, and rallies stall at the 50-day or 200-day line, which now act as resistance.
New to moving averages? Start with our guide to the 200-day simple moving average and our comparison of SMA vs EMA.
Death cross vs golden cross
Takeaway: the two signals mirror each other; both work best as trend context.
| Feature | Death cross | Golden cross |
|---|---|---|
| Definition | 50-day SMA crosses below 200-day SMA | 50-day SMA crosses above 200-day SMA |
| Trend message | Long-term downtrend likely starting | Long-term uptrend likely starting |
| Typical action | Reduce exposure, tighten stops, avoid new longs | Look for long entries on pullbacks |
| Best confirmation | 200-day SMA turning down, volume rising on declines | 200-day SMA flat or rising, volume rising on advances |
| Main weakness | Often arrives after much of the drop | Often arrives after much of the rally |
For the bullish version on equities, read our guide to golden cross stocks. For crypto, see golden cross vs death cross in crypto.
Does the death cross work? What history shows
Takeaway: on the S&P 500 the average outcome a year later has been positive, but the worst cases were severe.
The death cross has a scary name and a mixed record. Fundstrat’s analysis of 48 S&P 500 death crosses since 1929, reported by Business Insider via Yahoo Finance, found average returns of 2.8%, 4.3% and 5.0% over the following three, six and 12 months. The same analysis highlighted the exceptions: after the death cross in late 2007, the index fell 41.5% over the next 12 months as the financial crisis unfolded.
That pattern explains how to use the signal. Most death crosses are followed by choppy markets that eventually recover, but the few that come before a recession or a bear market are very costly. A death cross is your cue to check the trend, the economy and your stops, not to panic.
Individual stocks are less forgiving than the index. A single company in a death cross may be facing falling earnings or a broken business model, and there is no guarantee it recovers.
How to screen for death cross stocks
Takeaway: screen for the cross, then confirm the downtrend before acting.
- Core filter: 50-day SMA crossed below 200-day SMA in the last 1 to 10 sessions.
- Liquidity: average volume above 500,000 shares and price above $5.
- Position: price below both the 50-day and 200-day SMA.
- Slope: 200-day SMA flat or falling. A cross while the 200-day is still rising is often a false signal.
- Momentum: RSI(14) below 50 and MACD below its signal line.
- Breakdown: a recent close below a major support level adds conviction.
Do it in altFINS: open the screener, choose the SMA 50/200 bearish crossover filter, add RSI14 below 50 and a medium-term trend of Down or Strong Down, then save the scan with an alert.
Know when a trend breaks. altFINS tracks SMA and EMA crossovers, trend downgrades and support breakdowns 24/7 and alerts you when a holding turns. Set up your death cross alert.
Death cross stocks: real data from October 2026
Takeaway: the cleanest death crosses combine price below both averages with a falling 200-day line.
Snapshot from the altFINS screener on 21 October 2026, using tokenized versions of US stocks. Tokenized stocks track the underlying shares but trade 24/7, so prices can differ slightly from the exchange close.
| Tokenized stock | Price | 50-day SMA | 200-day SMA | Status |
|---|---|---|---|---|
| Bank of America (BACx) | 50.71 | 56.79 | 56.96 | Early-stage death cross, 50-day just 0.3% below 200-day; RSI 25, oversold |
| Cisco (CSCOx) | 109.34 | 111.75 | 111.11 | Death cross candidate: price below both, 50-day only 0.6% above 200-day |
| Alphabet (GOOGLx) | 342.02 | 344.42 | 354.25 | Death cross in force; price below both averages |
| Broadcom (AVGOx) | 341.49 | 355.34 | 387.07 | Death cross in force; down 5.4% in a month |
| Oracle (ORCLx) | 133.40 | 144.08 | 158.81 | Established downtrend; down 9.7% in a month |
| UnitedHealth (UNHx) | 420.87 | 389.59 | 394.89 | Death cross fading: price back above both, a golden cross could follow |
Source: altFINS screener data, 21 October 2026. Examples only, not recommendations. UnitedHealth shows why the death cross lags: price can recover well before the averages cross back.
How to trade death cross stocks
Takeaway: investors use it to cut risk; traders use the first rally into resistance.
If you own the stock
Review the position. Many investors trim, tighten the stop to below the most recent swing low, or hedge. If the fundamentals are intact and you hold for years, you may choose to sit tight, but decide in advance what would make you exit.
If you want to short or avoid it
Selling short right after the cross often means selling near a short-term low. A lower-risk entry is the first rally back toward the 50-day SMA or a broken support level, followed by a bearish candle such as a gravestone doji.
Stop and exit
For short trades, place the stop above the 200-day SMA or the last swing high. Cover part at the next support level and the rest if price closes back above the 50-day SMA or a golden cross forms.
| Do | Don’t |
|---|---|
| Check whether the 200-day SMA is falling | Act on a cross while the 200-day is still rising steeply |
| Confirm with RSI below 50 and MACD bearish | Short a deeply oversold stock right after the cross |
| Check the broader market and sector | Ignore an earnings date in the next few days |
| Size so one loss costs 1% to 2% of your account | Treat the death cross as a guaranteed crash signal |
For a second confirmation, pair the cross with a bearish MACD signal line crossover.
How altFINS helps
Takeaway: altFINS finds the crossovers and adds the confirmation layers automatically.
- Crossover filters: SMA 50/200, SMA 100/200, EMA 12/50 and EMA 50/200, bullish or bearish.
- Trend ratings: short, medium and long-term trend scores from Strong Down to Strong Up, plus trend upgrade and downgrade alerts.
- Chart patterns: head and shoulders, rising wedges and support breakdowns that often accompany a death cross.
- Signals Summary: a live feed of fresh bearish and bullish signals.
- Coverage: 2,000+ coins and 200+ tokenized stocks today, with full stocks coming to the screener soon.
Frequently asked questions
What is a death cross in stocks?
A death cross in stocks is a chart signal that forms when the 50-day simple moving average crosses below the 200-day simple moving average. It shows that medium-term momentum has fallen below the long-term trend and often confirms a new downtrend. Because both averages are based on past prices, the signal lags and usually appears after a stock has already fallen.
Is a death cross bearish?
Yes, it is a bearish trend signal, but its track record on indexes is mixed. Fundstrat found that the S&P 500 averaged a 5.0% gain in the 12 months after 48 death crosses since 1929, yet some signals, such as late 2007, came before steep losses. Treat it as a reason to review risk, not a guaranteed decline.
Should I sell a stock after a death cross?
It depends on your timeframe and the reason for the drop. Short-term traders often reduce or exit positions, while long-term investors check whether the business has changed. A practical approach is to tighten your stop below the recent swing low and sell if that level breaks, rather than selling everything on the day of the cross.
How long does a death cross last?
There is no fixed duration. Some death crosses reverse within weeks as price recovers and a golden cross forms, while others mark the start of downtrends lasting many months. Watch price relative to the 200-day SMA: if price climbs back above both averages, the bearish signal is losing force even before the averages cross back.
What is the difference between a death cross and a golden cross?
They are opposites. A death cross is the 50-day SMA crossing below the 200-day SMA and signals a weakening trend. A golden cross is the 50-day SMA crossing above the 200-day SMA and signals a strengthening trend. Both are lagging trend confirmations and work best with volume, momentum and support or resistance confirmation.
Verdict
Death cross stocks deserve attention, not fear. Use the 50/200 crossover as a filter that tells you when a trend has turned, confirm it with a falling 200-day SMA, weak momentum and broken support, and then act according to your plan: trim, hedge, tighten stops or wait for a rally to short. For a neutral definition, see Investopedia’s death cross entry.
Let altFINS watch your trends. Scan bullish and bearish moving average crossovers, trend downgrades and breakdowns on 2,000+ coins and 200+ tokenized stocks, with stocks joining soon. Start scanning in altFINS or compare plans.
Disclaimer: This article is for educational purposes only and is not financial or investment advice. Trading stocks, tokenized stocks and cryptocurrencies involves substantial risk, and short selling can lead to losses larger than your initial investment. Historical statistics do not guarantee future results. The tickers shown are examples from a dated data snapshot, not recommendations. Do your own research and consider speaking with a licensed financial professional before making investment decisions.