Search Knowledge Base by Keyword
Breakout Stocks: How to Find and Trade Stock Breakouts in 2026
Breakout stocks are stocks whose price moves decisively above a resistance level, such as the top of a trading range, a chart pattern boundary or a 52-week high, usually on volume well above average. A real breakout shows that buyers have absorbed the supply that capped the price, and it often starts a new leg higher. The catch: many breakouts fail, so volume, the base before the move and the market trend decide which ones are worth trading.
This guide is for swing traders and active investors who want a clear, rules-based way to buy strength. It also suits crypto traders who already trade breakouts on altcoins and want to apply the same playbook to stocks.
You will learn what makes a valid breakout, the main breakout patterns, how to screen for breakout stocks, a real October 2026 watchlist, and entry, stop and exit rules that limit the damage from false breakouts.
Quick answer: A breakout stock closes above a well-defined resistance level on volume at least 1.5 times its 50-day average. The best breakouts come from tight bases of several weeks, happen in a rising market and occur near 52-week highs. Buy on the breakout close or the first retest of the level, place a stop just below the breakout level, and exit if price closes back inside the base.
Find breakouts as they happen: altFINS scans resistance breakouts, chart pattern breakouts and new highs across 2,000+ coins and 200+ tokenized stocks, with full stocks coming soon. Scan for breakouts in altFINS.
🚀 What is a breakout stock?
Takeaway: a breakout is a close above resistance with volume; anything less is just a test.
Resistance is a price level where selling has repeatedly stopped a rally. Each time price returns to it, sellers who bought earlier or want to take profit unload shares. When demand finally outweighs that supply, price closes above resistance and the level often flips into support. Our guide to support and resistance shows how to draw these levels.
Three ingredients separate a real breakout from noise:
- A clear level: resistance touched at least two or three times, ideally over several weeks.
- A close above it: intraday pokes above resistance that close back below do not count.
- Volume: breakout-day volume at least 50% above the 50-day average, a sign that larger buyers are involved.
The main breakout patterns
Takeaway: the base before the breakout tells you how much fuel the move has.
| Pattern | What it looks like | Breakout level | Reliability notes |
|---|---|---|---|
| Flat base / range | Sideways range of 5 to 15% for several weeks | Top of the range | Simple and common; tighter ranges work better |
| Ascending triangle | Flat top, rising lows | Flat resistance line | Rising lows show buyers getting more aggressive |
| Bull flag | Sharp rally, then a short, tight pullback | Top of the flag | Continuation pattern; works best in strong trends |
| Cup and handle | Rounded base, then a small pullback | Top of the handle | Slower to form; popular with growth investors |
| 52-week high breakout | Price clears the highest level of the past year | 52-week high | No overhead supply from trapped buyers |
Want the full catalogue? See our chart patterns guide, and for the strongest version of this setup read 52-week high stocks.
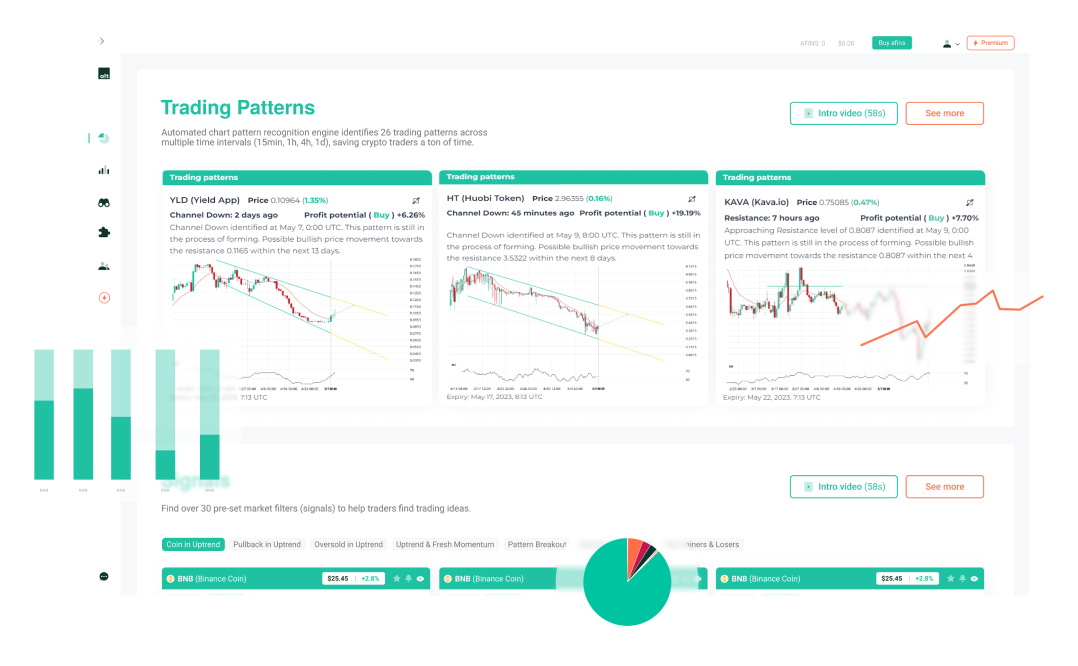
Do it in altFINS: altFINS chart pattern recognition detects triangles, flags, channels, wedges and more automatically, marks the breakout level and shows the pattern’s target.
How to screen for breakout stocks
Takeaway: screen for stocks near or above resistance, then demand volume and trend.
Pre-breakout watchlist (stocks about to break out)
- Price within 5% of the 52-week high or of a defined resistance level.
- Price above the 50-day and 200-day SMA, with the 50-day above the 200-day.
- Average volume above 500,000 shares and price above $5.
- Volatility contracting: a narrowing range or Bollinger Bands squeezing.
Breakout confirmation scan (stocks breaking out today)
- Close above resistance or a new 52-week high in the last 1 to 2 sessions.
- Relative volume above 1.5. Learn more in our RVOL indicator guide.
- RSI(14) between 55 and 75: strong, but not extremely stretched.
- Market filter: S&P 500 or Nasdaq 100 above its 50-day SMA.
Do it in altFINS: in the screener, use the resistance breakout or “approaching resistance” presets, add relative volume above 1.5 and an Up or Strong Up trend rating, then save the scan with an alert.
Stop refreshing charts. altFINS scans resistance breakouts, chart pattern breakouts and new highs around the clock and alerts you when a new asset qualifies. Set up your breakout alert.
Breakout watchlist: real data from October 2026
Takeaway: the best candidates sit just under their 52-week high in a confirmed uptrend.
Snapshot from the altFINS screener on 21 October 2026, using tokenized versions of US stocks. Tokenized stocks track the underlying shares but trade 24/7, so prices can differ slightly from the exchange close.
| Tokenized stock | Price | 52-week high | Below high | Relative volume | Read |
|---|---|---|---|---|---|
| AbbVie (ABBVx) | 289.47 | 293.54 | 1.4% | 1.86 | Volume already rising into resistance; uptrend above both SMAs |
| Visa (Vx) | 403.15 | 409.63 | 1.6% | 0.94 | Near the high, but needs a volume surge to confirm |
| Chevron (CVXx) | 231.48 | 237.28 | 2.4% | 0.52 | Strong trend, RSI 67.7; volume quiet |
| Eli Lilly (LLYx) | 1,280.25 | 1,324.98 | 3.4% | 0.63 | RSI 71.2, overbought; better to wait for a base or retest |
| Coca-Cola (KOx) | 92.95 | 96.49 | 3.7% | 0.50 | Steady uptrend; defensive breakout candidate |
Source: altFINS screener data, 21 October 2026. Examples for education only, not recommendations; values change daily.
How to trade breakout stocks
Takeaway: define the level, the stop and the size before the breakout happens.
Entry options
- Breakout close: buy near the close of the day that finishes above resistance on strong volume. You catch the move but risk a failed breakout.
- Retest: wait for price to pull back to the old resistance, now support, and buy when it holds. Lower risk, but some breakouts never retest.
Stop-loss
Place the stop just below the breakout level or below the low of the breakout day. Many breakout traders also exit if the loss reaches 7% to 8%, whichever comes first.
Targets and exits
Use the pattern’s measured move as a first target: the height of the base added to the breakout level. Take partial profits there or at 2:1 reward-to-risk, and trail the rest under the 10-day or 20-day moving average.
Why breakouts fail and how to avoid false breakouts
Takeaway: most failures share the same warning signs.
| Do | Don’t |
|---|---|
| Require volume at least 1.5 times average | Buy a breakout on below-average volume |
| Trade breakouts from tight, multi-week bases | Chase a stock already 5% or more above the breakout level |
| Trade with the market trend | Buy breakouts when the index is below its 50-day SMA |
| Check the earnings date first | Hold a fresh breakout through earnings without a plan |
| Exit fast if price closes back inside the base | Hope a failed breakout will “come back” |
A failed breakout is information too: when a stock breaks out and quickly falls back into the range, trapped buyers often sell on the next rally. Crypto traders will recognise the same behaviour; see our guide to crypto breakouts.
How altFINS helps
Takeaway: altFINS combines breakout scans, pattern detection and alerts in one workflow.
- Breakout presets: resistance breakouts, approaching resistance, new 1-month highs and near all-time high filters.
- Automated chart patterns: 26 pattern types with breakout levels, direction and targets.
- Relative volume and trend ratings: confirm participation and trend strength in the same scan.
- Signals Summary: a live feed of new breakout and trend signals.
- Coverage: 2,000+ coins and 200+ tokenized stocks today, with full stocks coming soon. Learn more in the tokenized stocks tutorial.
Frequently asked questions
What is a breakout in stocks?
A breakout happens when a stock’s price closes above a resistance level, such as the top of a trading range, a chart pattern line or a 52-week high, usually on higher than normal volume. It signals that buyers have overcome the sellers who capped the price before. Breakouts often start new uptrends, but they need volume and follow-through to be reliable.
How do you know if a breakout is real?
Look for a daily close above resistance, not just an intraday move, and volume at least 50% above the 50-day average. Strong breakouts come from tight bases of several weeks, happen while the broader market is rising and hold above the breakout level in the following days. A quick close back inside the range suggests a false breakout.
What volume confirms a breakout?
A common rule is breakout-day volume at least 1.5 times the 50-day average volume, or a relative volume reading above 1.5. Higher readings, such as 2 or 3 times normal, show stronger institutional demand. Low-volume breakouts fail more often because there are not enough buyers to absorb further selling.
Where should I put my stop-loss on a breakout trade?
Most traders place the stop just below the breakout level or below the low of the breakout day. If price falls back under the old resistance, the breakout has likely failed. Some traders also use a maximum loss of 7% to 8% from entry. Size the position so the stop-out costs only 1% to 2% of your account.
Is it better to buy the breakout or wait for a pullback?
Both work. Buying the breakout close catches strong moves that never look back, but you take more false breakouts. Waiting for a retest of the breakout level gives a tighter stop and better reward-to-risk, but you miss stocks that run without pulling back. Many traders split their position between the two entries.
Verdict
Breakout stocks reward traders who are prepared. Build a watchlist of stocks basing just below resistance, demand a strong close and heavy volume on the breakout, and know your stop before you buy. Keep losses small on the breakouts that fail, and let the ones that work run with a trailing stop. For neutral background on risk, see the SEC’s Investor.gov.
Never miss the next breakout. Scan resistance breakouts, chart patterns and new highs on 2,000+ coins and 200+ tokenized stocks in altFINS, with stocks joining soon. Start scanning for free or compare altFINS plans.
Disclaimer: This article is for educational purposes only and is not financial or investment advice. Trading stocks, tokenized stocks and cryptocurrencies involves substantial risk, and you can lose some or all of your capital. Breakout strategies produce false signals. The tickers shown are examples from a dated data snapshot, not recommendations. Do your own research and consider speaking with a licensed financial professional before making investment decisions.