

Search Knowledge Base by Keyword
52-Week High Stocks: How to Find and Trade New Highs in 2026
52-week high stocks are stocks trading at, or very close to, their highest price of the past year. Many investors avoid them because they look expensive, but research shows the opposite tends to hold: stocks near their 52-week high have historically kept outperforming stocks far from it. The best trades come from new highs made on strong volume, after a tight consolidation, in a rising market.
This guide is for momentum traders, breakout traders and investors who want to buy strength instead of guessing bottoms. It also covers the other side, stocks near their 52-week low, so you know when a low is a warning rather than a bargain.
You will learn what the 52-week high means, why it works, how to screen for it, real examples from October 2026 and a step-by-step plan for trading breakouts to new highs. Updated October 2026.
Quick answer: A 52-week high is the highest price a stock has traded at over the last 52 weeks (about 250 trading days). Stocks at or within 5% of that level show strong relative strength and often break higher, because there are few trapped sellers above. To trade them, screen for price within 2% to 5% of the 52-week high, confirm with relative volume above 1.5, and buy the breakout or the first pullback that holds.
Spot new highs before the crowd: altFINS scans new highs, assets within 5% of their all-time high and pullbacks after a recent high across 2,000+ coins and 200+ tokenized stocks today, with full stock coverage coming soon. Scan for new highs in altFINS.
📈 What is a 52-week high?
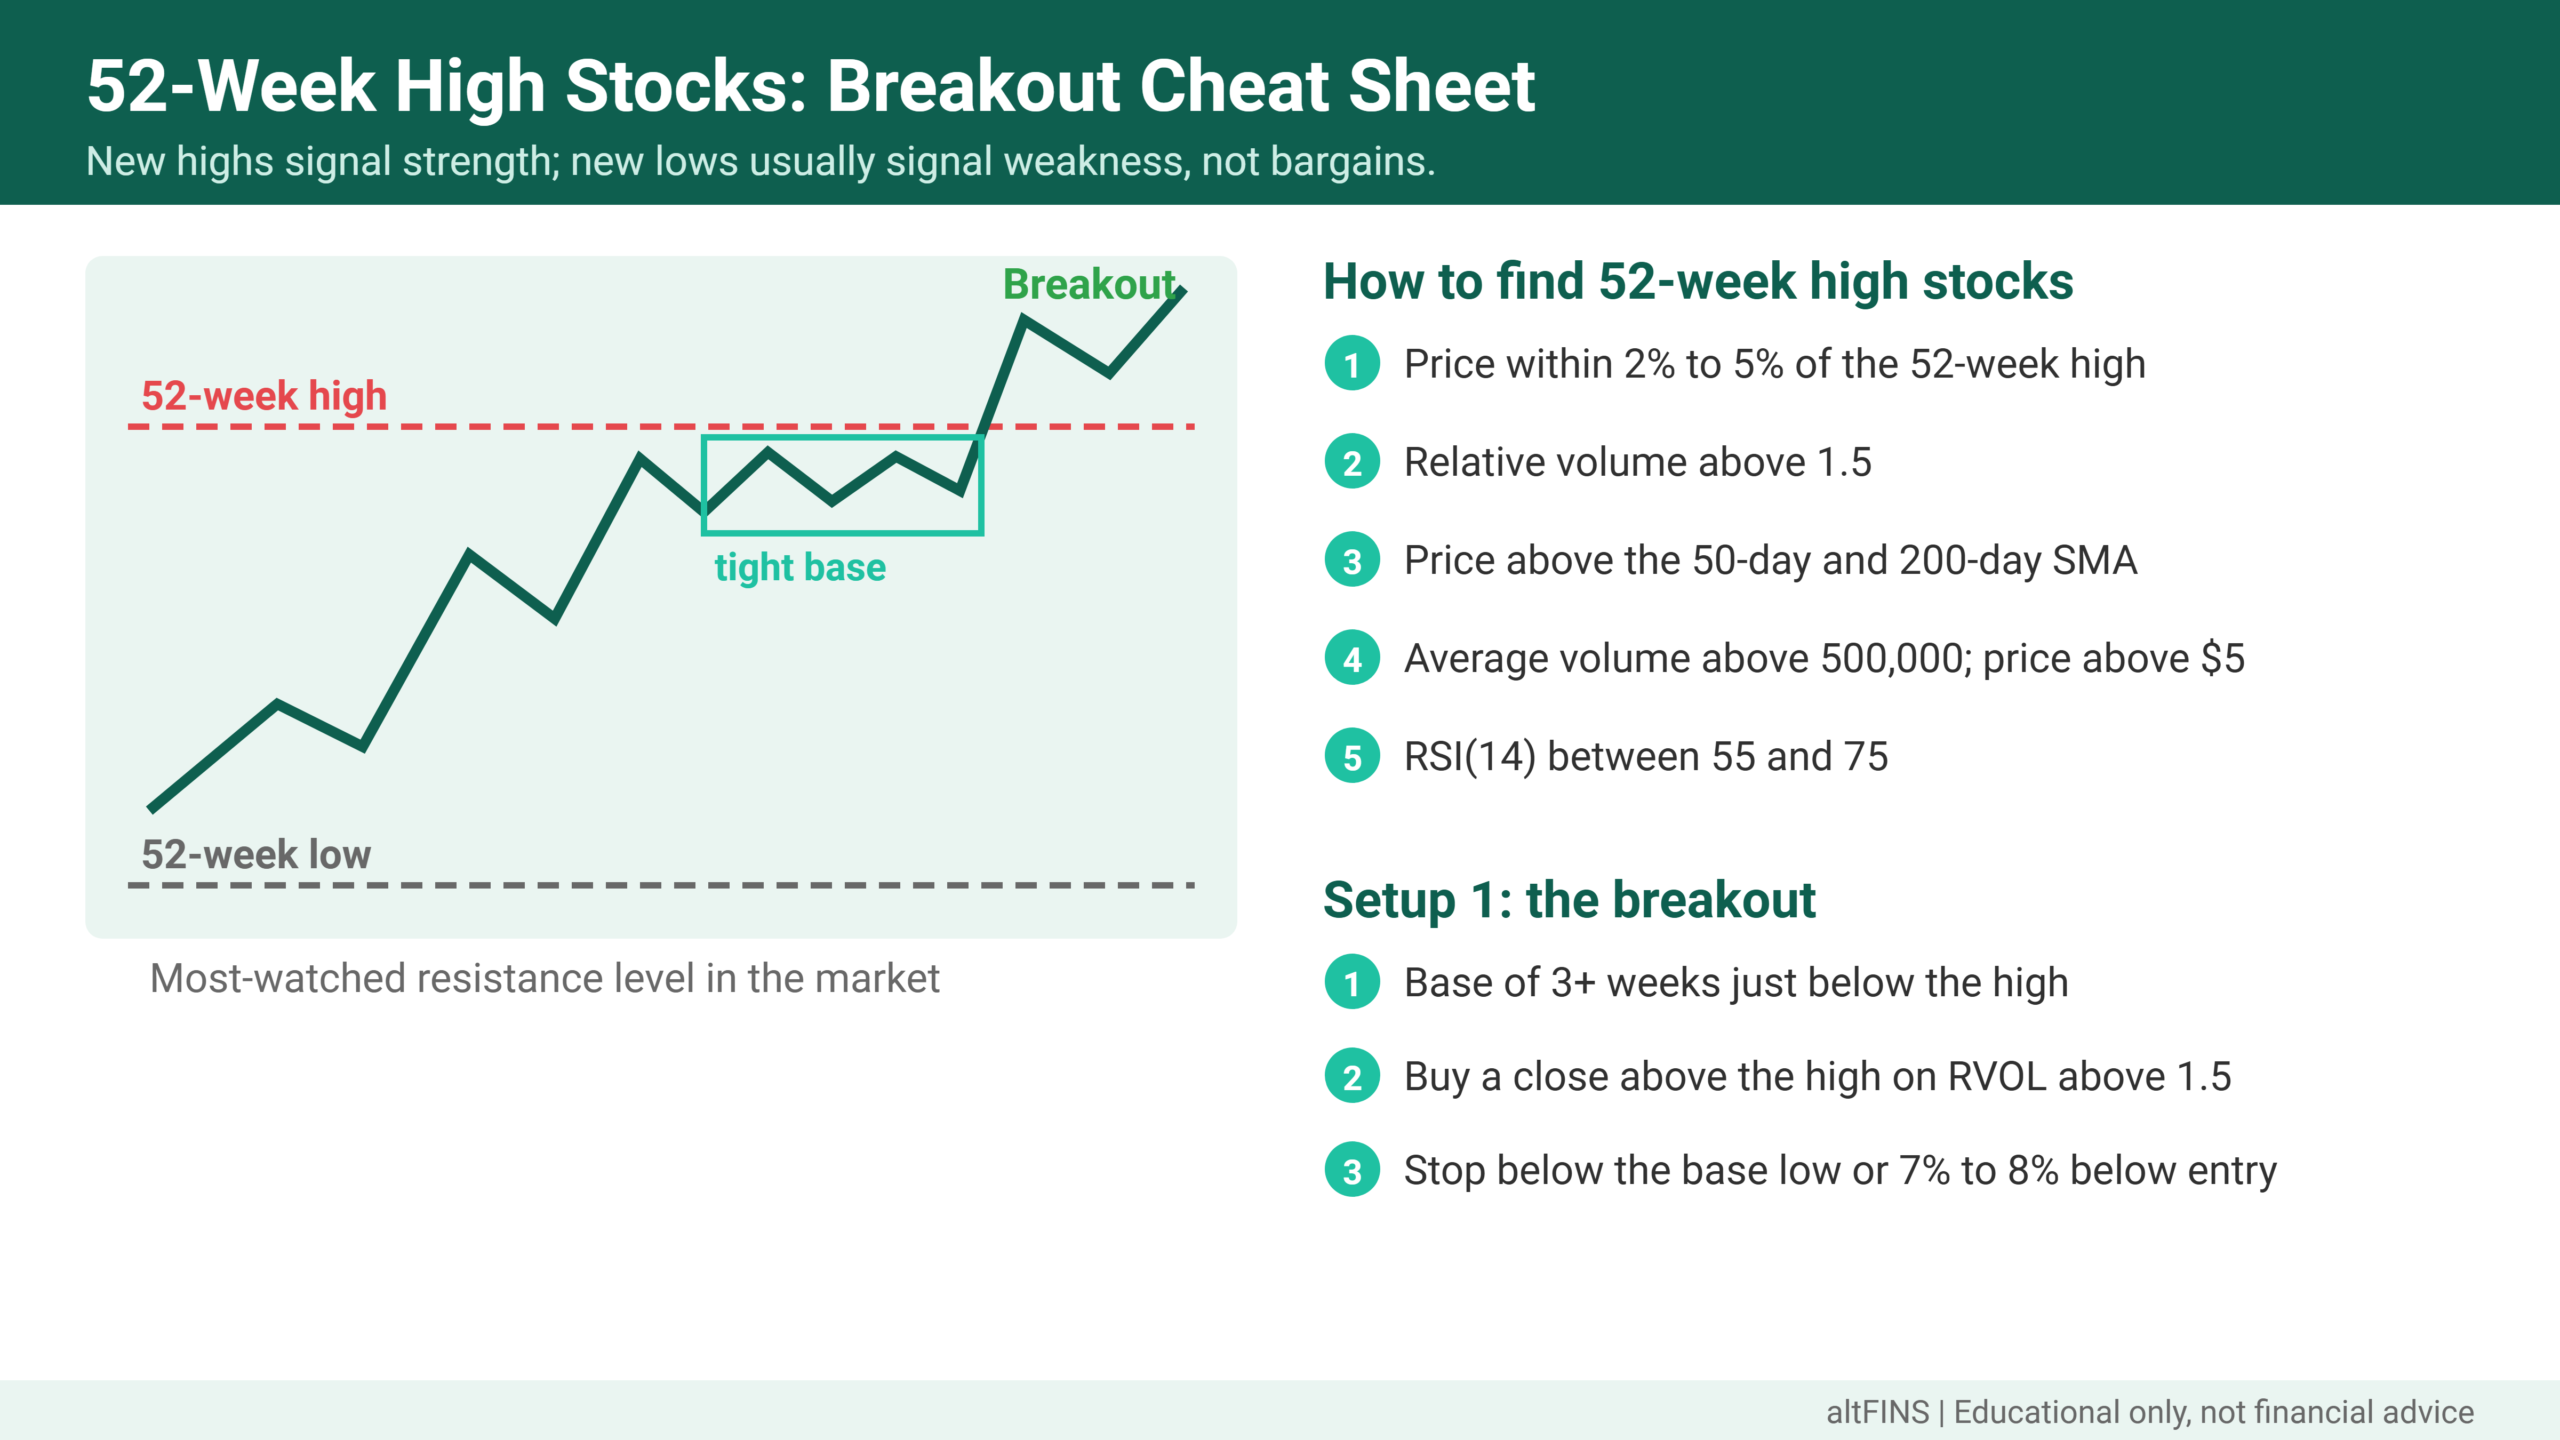
Takeaway: the 52-week high is the most-watched resistance level in the stock market.
The 52-week high is the highest traded price over the past year. The 52-week low is the lowest. Together they form the 52-week range shown on every quote page. Because almost every investor sees this number, it acts as a psychological line: buyers who bought near the old high want to get out at breakeven, so the level often holds as resistance until demand is strong enough to absorb that supply.
When a stock finally closes above its 52-week high, every holder from the past year is in profit. There is no overhead supply left, which is why clean breakouts to new highs can move fast.
Why buying 52-week highs works: the research
Takeaway: nearness to the 52-week high has predicted future returns better than past returns alone.
The best-known study is “The 52-Week High and Momentum Investing” by Thomas J. George and Chuan-Yang Hwang, published in the Journal of Finance in 2004. Using US stock data, they found that how close a stock trades to its 52-week high explains a large part of momentum profits, and forecasts future returns better than past returns do. Returns predicted this way also did not reverse in the long run.
The usual explanation is anchoring. Investors treat the 52-week high as a reference point and are slow to bid a stock above it, even when the news is good. When the price finally breaks through, it catches up.
Later studies found the effect is weaker in some markets, such as emerging-market indexes, so treat it as an edge, not a guarantee.
52-week high vs 52-week low stocks
Takeaway: new highs signal strength; new lows usually signal weakness, not bargains.
| Feature | Near 52-week high | Near 52-week low |
|---|---|---|
| What it shows | Strong relative strength and demand | Weak demand and persistent selling |
| Overhead supply | Little or none after a breakout | Heavy, from every buyer above |
| Typical strategy | Breakout or pullback buying | Avoid, short, or wait for a base and reversal |
| Common mistake | Selling winners because they “look expensive” | Buying because the stock “looks cheap” |
| Best confirmation | Relative volume above 1.5, rising market | Bullish divergence, higher low, reclaim of 50-day SMA |
Stocks near 52-week highs: real data from October 2026
Takeaway: leaders near their highs often have momentum readings above 60; above 70 means wait for a pullback.
Snapshot of tokenized US stocks and ETFs in the altFINS screener on 14 October 2026. Tokenized stocks track the underlying shares but trade 24/7, so prices can differ slightly from the exchange close.
| Tokenized asset | Price | 52-week high | Distance from high | RSI (14) |
|---|---|---|---|---|
| S&P 500 ETF (SPYx) | 781.96 | 783.24 | 0.2% below | 62.1 |
| Palantir (PLTRx) | 210.06 | 212.92 | 1.3% below | 76.5 |
| Microsoft (MSFTx) | 545.09 | 553.03 | 1.4% below | 74.4 |
| Apple (AAPLx) | 342.98 | 348.31 | 1.5% below | 62.4 |
| Meta (METAx) | 763.79 | 781.25 | 2.2% below | 68.6 |
And at the other end, assets sitting on their 52-week low: USA Rare Earth (USARx) at 11.31 against a 52-week low of 11.25, with RSI 15.7 and a Strong Down trend. Source: altFINS screener data, 14 October 2026. Examples only, not recommendations.
Palantir and Microsoft are within 1.5% of their highs but have RSI above 70, so they are overbought. A patient trader would wait for a pause or a pullback before buying. Apple and the S&P 500 ETF are close to their highs with more moderate momentum.
How to find 52-week high stocks in a screener
Takeaway: proximity plus volume plus trend is the core recipe.
- Proximity: price within 2% to 5% of the 52-week high (or a new high made today).
- Volume: relative volume above 1.5, meaning today’s volume is at least 50% above average.
- Trend: price above the 50-day and 200-day SMA, and 50-day above 200-day.
- Liquidity: average volume above 500,000 shares, price above $5.
- Momentum check: RSI(14) between 55 and 75; above 75 often means the move is stretched.
Do it in altFINS: in the screener, use the new high presets (5 to 50 periods), the within 5% of all-time high presets, or sort any scan by percentage down from the 52-week high to list the assets closest to breaking out.
Catch breakouts to new highs as they happen. Combine new high scans with automated chart pattern breakouts and get alerted 24/7. See live breakout patterns in altFINS.
How to trade 52-week high breakouts
Takeaway: the best breakouts start from a tight base, not from a vertical spike.
Setup 1: the breakout
- Find a stock that has consolidated sideways for 3 or more weeks just below its 52-week high (a flat base, ascending triangle or bull flag).
- Buy when price closes above the 52-week high on relative volume above 1.5.
- Place the stop below the base low or about 7% to 8% below entry, whichever is tighter.
Setup 2: the pullback after the breakout
- After a breakout, wait for price to pull back toward the old 52-week high, which should now act as support.
- Buy when it holds that level and prints a bullish candle on lighter volume during the dip.
- Place the stop just below the retest low.
Exits
Take partial profits after a 2:1 reward-to-risk move, trail the rest under the 20-day or 50-day moving average, and exit on a close back inside the old range on high volume, which signals a failed breakout.
Do and don’t: trading new highs
Takeaway: buy strength with confirmation, and respect the failed breakout.
| Do | Don’t |
|---|---|
| Buy breakouts from tight bases on rising volume | Chase a stock already 10% or more above its breakout level |
| Check that the S&P 500 is also near its highs | Buy new highs in a falling market |
| Check the earnings date first | Hold through earnings without a plan |
| Cut quickly if price falls back into the base | Turn a failed breakout into a long-term hold |
| Treat stocks near 52-week lows as weak until proven otherwise | Buy a stock just because it is near its low |
How altFINS helps
Takeaway: altFINS finds the leaders and the breakout patterns, then alerts you when they trigger.
- New high and near all-time high presets: new highs over 5 to 50 periods, within 5% of ATH, and recent ATH pullbacks with a MACD turn.
- 52-week data in every scan: 52-week high and low columns, plus sorting by distance from the 52-week high or low.
- Automated chart patterns: triangles, flags, channels and rectangles with breakout levels.
- Signals Summary and alerts: fresh breakout and momentum signals, plus 24/7 alerts.
- Coverage: 2,000+ coins and 200+ tokenized stocks today; full stocks coming to the screener soon.
Frequently asked questions
What does it mean when a stock hits a 52-week high?
It means the stock is trading at its highest price in the past year. That shows strong demand and relative strength versus the market. Because every buyer from the past 12 months is now in profit, there is little overhead selling pressure, so stocks breaking to new highs on strong volume often keep rising for a while.
Is it good to buy a stock at its 52-week high?
It can be. Research by George and Hwang (2004) found stocks near their 52-week high tended to outperform. The risk is buying a stretched move. Better entries come from breakouts out of tight bases on high volume, or pullbacks that hold the old high as support, with a stop-loss below the base.
How do you find stocks near their 52-week high?
Use a screener filter such as “price within 5% of 52-week high,” then add relative volume above 1.5, price above the 50-day and 200-day moving averages, and a minimum volume of 500,000 shares. Sort by distance from the high. altFINS offers ready new-high presets for crypto and tokenized stocks, with full stocks coming soon.
Are stocks near their 52-week low a good buy?
Usually not on their own. Stocks near 52-week lows are often in downtrends with weak demand and heavy overhead supply. Some become good buys after they build a base, show a bullish RSI divergence, make a higher low and reclaim the 50-day moving average. Without those signs, a low price is a warning, not a bargain.
How is the 52-week high calculated?
The 52-week high is the highest price the stock traded at during the past 52 weeks, about 250 trading days. Most data providers use the intraday high, while some use the highest closing price. The window rolls forward every day, so the level changes as old prices drop out of the 52-week period.
Verdict
52-week high stocks are where leadership shows up first. Instead of fearing new highs, screen for them, demand volume and a tight base, and manage risk with a stop below the breakout. Treat stocks near 52-week lows with suspicion until the chart proves otherwise. For neutral investor education, see the SEC’s Investor.gov and FINRA’s investor center.
Trade strength, not hope. Scan new highs, breakout patterns and momentum signals on 2,000+ coins and 200+ tokenized stocks, with stocks joining soon. Find new highs in altFINS or compare plans.
Disclaimer: This article is for educational purposes only and is not financial or investment advice. Trading stocks, tokenized stocks and cryptocurrencies involves substantial risk, and you can lose some or all of your capital. Academic findings and past breakouts do not guarantee future results. The tickers shown are examples from a dated data snapshot, not recommendations. Do your own research and consider speaking with a licensed financial professional before making investment decisions.
