

Search Knowledge Base by Keyword
Stock Screener for Free: The 7 Best Free Stock Screeners in 2026
The best stock screener for free in 2026 depends on what you screen for. Finviz is the strongest all-round free screener for US stocks, TradingView is best when you want the screener tied to charts, and Yahoo Finance is the simplest for basic fundamentals. If you trade on technical setups such as breakouts, oversold RSI or chart patterns, pick a screener with ready-made technical presets so you do not have to build every filter by hand.
This guide is for investors and active traders who want to find stock ideas without paying for a terminal. It is also for crypto traders who already use a screener and want the same workflow for equities.
You will get a side-by-side comparison of 7 free stock screeners, the filters that matter most, 5 ready-to-copy screens, and the limits of every free plan. Updated October 2026.
Quick answer: A free stock screener filters thousands of stocks down to a short list using rules such as market cap, price, volume, P/E ratio, RSI or moving averages. The best free options in 2026 are Finviz (most filters), TradingView (best charts), Yahoo Finance (easiest), Barchart (good technical presets) and StockAnalysis (deep fundamentals). Free plans usually mean delayed data, fewer filters and no alerts.
Want technical presets that do the work for you? altFINS already runs 150+ preset scans (breakouts, oversold RSI, golden crosses, chart patterns) on 2,000+ coins and 200+ tokenized stocks such as AAPLx, NVDAx and TSLAx. Full stock coverage is coming to the screener soon. Try the altFINS screener free.
🔎 What is a stock screener?
Takeaway: a screener turns a market of thousands of tickers into a short list you can actually analyze.
A stock screener is a tool that filters stocks by rules you set. You might ask for “US stocks above $2 billion market cap, above the 200-day moving average, with average volume over 1 million shares.” The screener returns only the stocks that pass every rule.
Screeners use two kinds of filters:
- Fundamental filters: data from the business, such as market capitalization, P/E ratio (price divided by earnings per share), revenue growth, dividend yield and debt.
- Technical filters: data from the chart, such as price change, volume, the RSI (Relative Strength Index, a 0 to 100 momentum gauge), moving averages and 52-week highs and lows.
Long-term investors lean on fundamentals. Swing traders and day traders lean on technicals. Most good free screeners offer both, but the depth varies a lot.
Do it in altFINS: open the altFINS screener, pick a preset such as oversold uptrend or resistance breakout, then add your own filters for market cap, RSI or trend score.
The 7 best free stock screeners compared
Takeaway: no single free screener wins every category, so match the tool to your strategy.
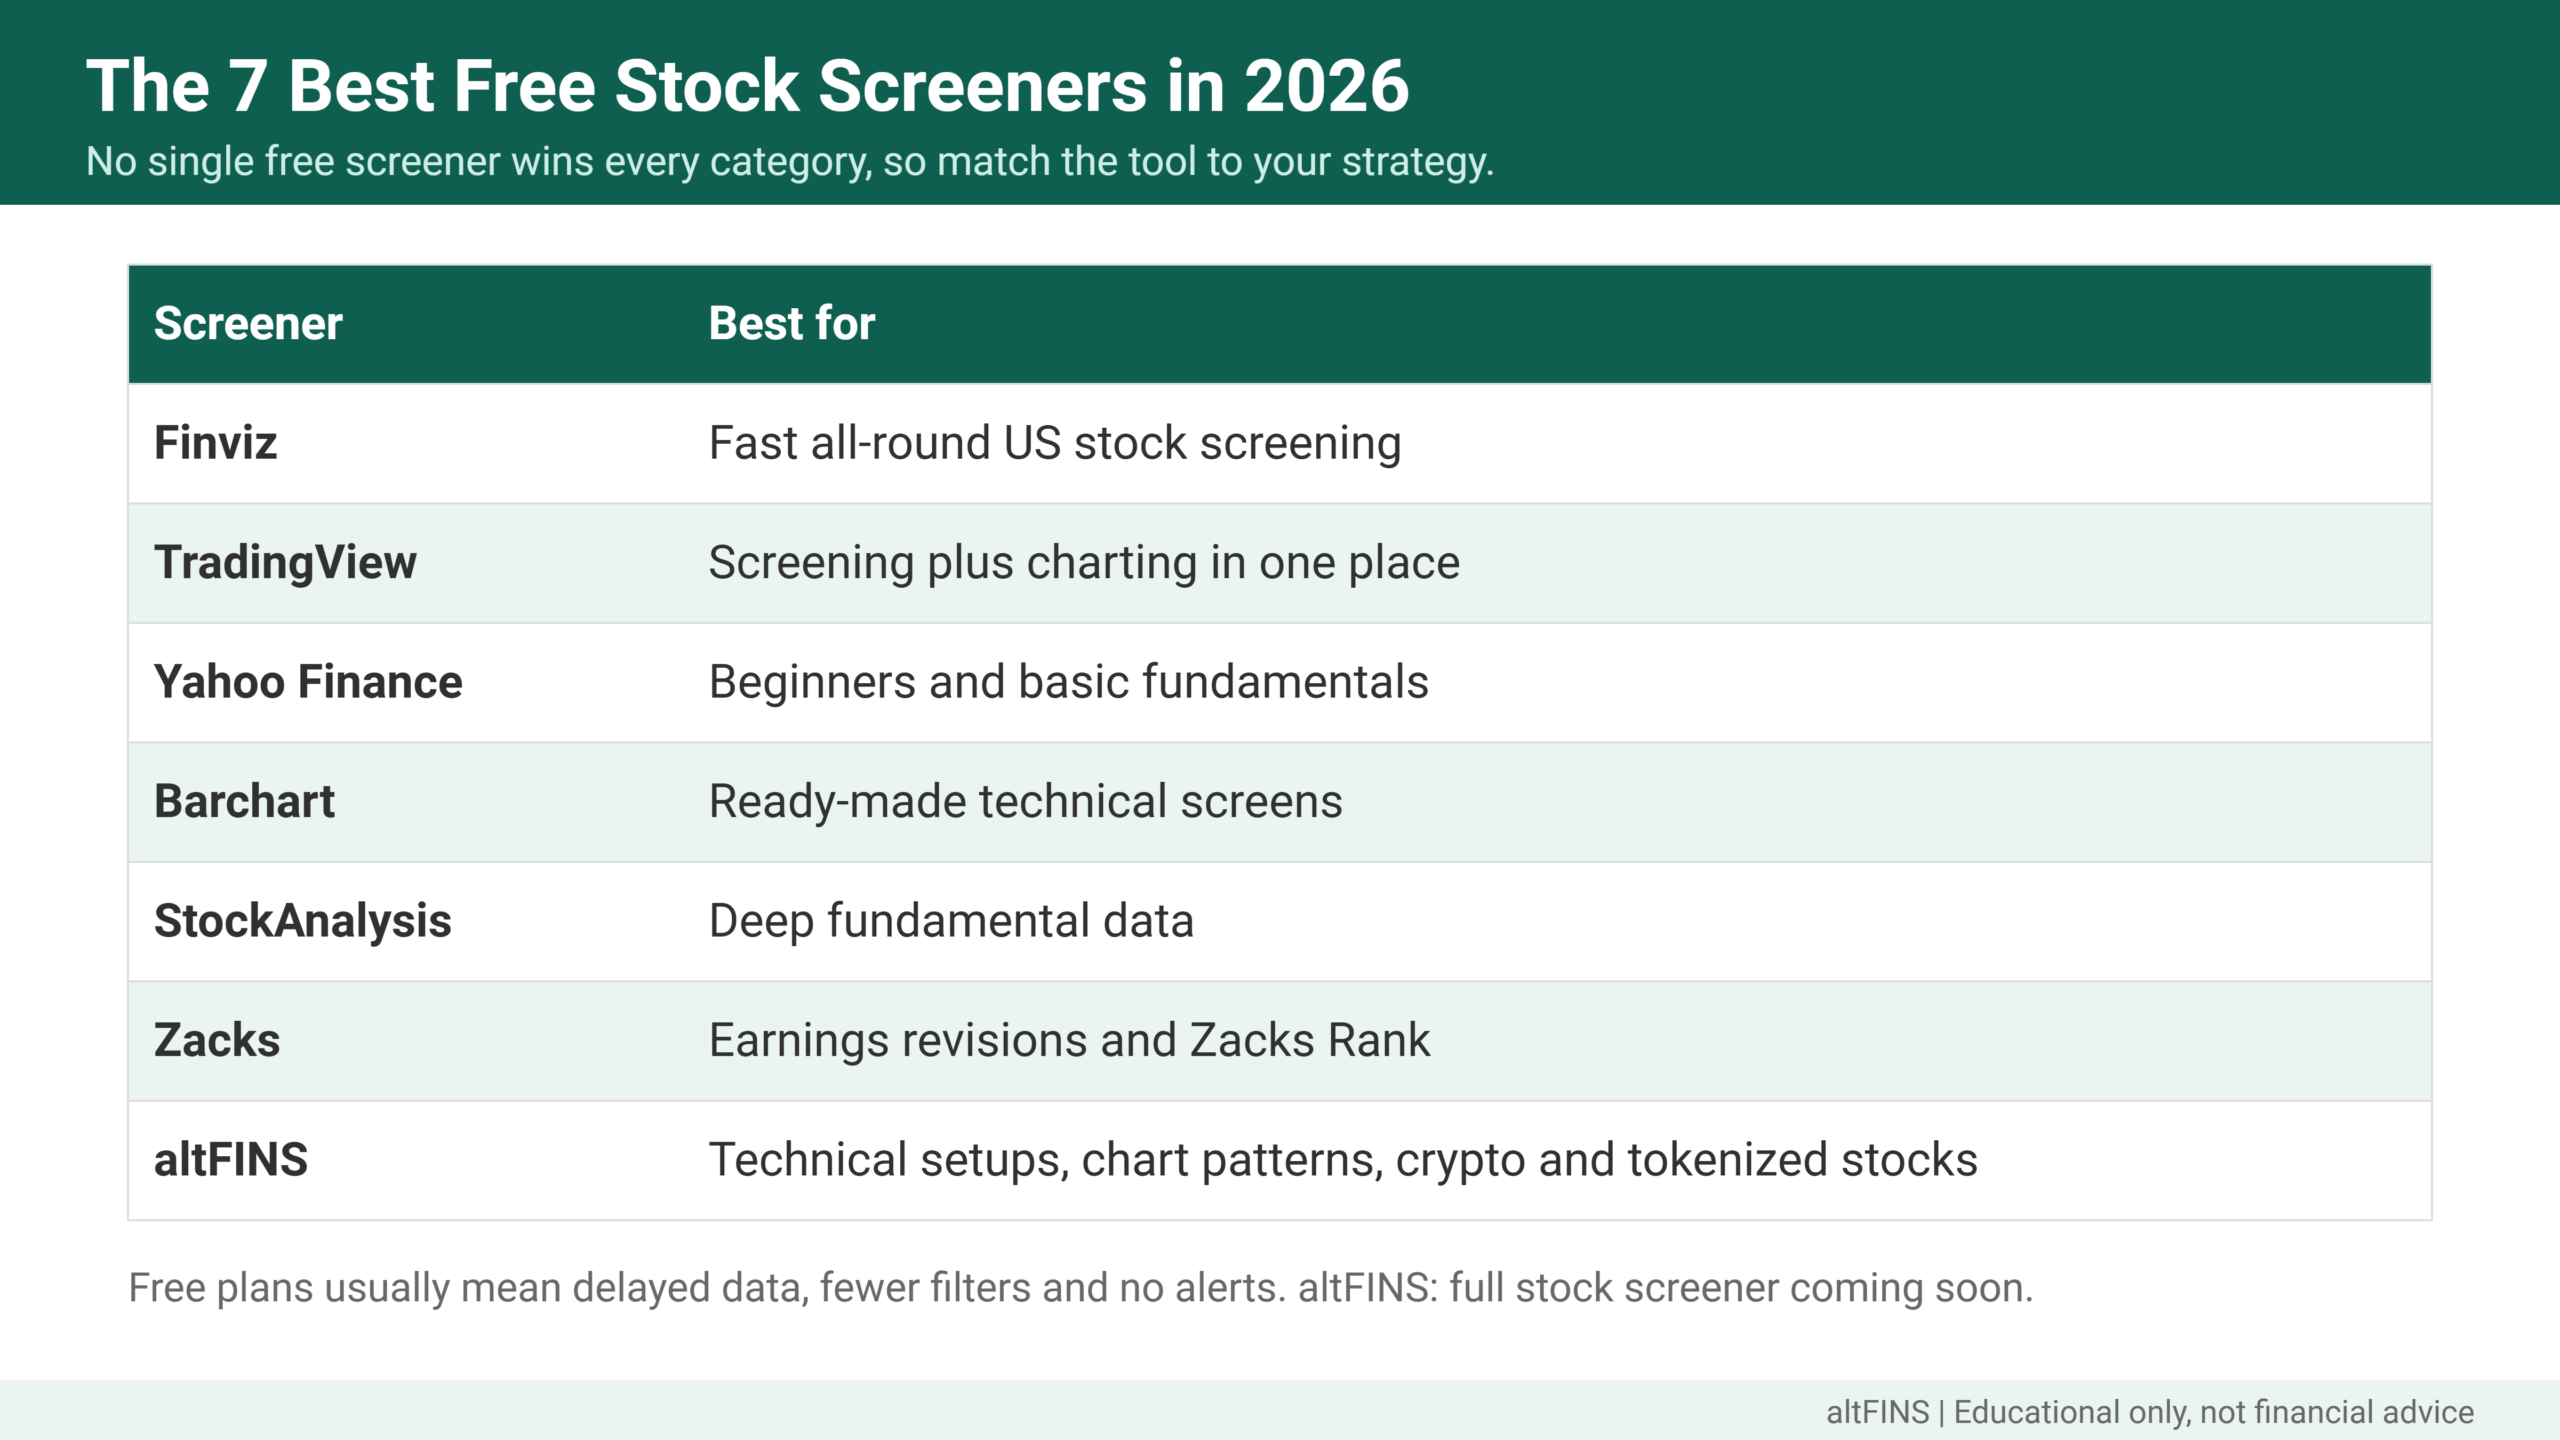
| Screener | Best for | Free plan strengths | Free plan limits |
|---|---|---|---|
| Finviz | Fast all-round US stock screening | Dozens of descriptive, fundamental and technical filters; heat maps; chart pattern filters | Delayed quotes, ads, no alerts; real-time data and backtests sit in the paid Elite plan |
| TradingView | Screening plus charting in one place | Fundamental and technical filters linked straight to charts; global markets | Ads; limited indicators per chart and limited alerts on the free plan |
| Yahoo Finance | Beginners and basic fundamentals | Simple filters for sector, market cap, P/E and analyst rating; free watchlists | Few technical filters; advanced screeners need a paid plan |
| Barchart | Ready-made technical screens | Pre-built screens such as RSI oversold and new highs; sort by volume | Saving screens and some data need a free or paid membership |
| StockAnalysis | Deep fundamental data | Hundreds of data columns, clean tables, long financial history | Light on technical filters; some history limited to the paid tier |
| Zacks | Earnings revisions and Zacks Rank | Pre-built screens built around earnings estimate changes | Many premium screens and full rank lists are paid |
| altFINS | Technical setups, chart patterns, crypto and tokenized stocks | 150+ preset scans, automated chart pattern detection, trend scores, alerts | Covers crypto and 200+ tokenized stocks today; full stock screener coming soon |
Free plans change often. Check each vendor’s current plan page before you commit, because data delays and filter counts are the first things to move behind a paywall.
1. Finviz
Finviz is the default free screener for US stocks. Its filters sit on three tabs (descriptive, fundamental and technical), and you can screen for signals such as “new high,” “oversold” or simple chart patterns in a few clicks. The free version shows delayed data and has no alerts, which is fine for end-of-day research but weak for intraday trading.
2. TradingView
TradingView’s screener shines because every result opens in a full chart. That makes it quick to check a setup visually. The free plan is ad-supported and caps how many indicators and alerts you can use, so heavy users often hit the limits fast.
3. Yahoo Finance
Yahoo Finance is the easiest place to start. Filters cover region, sector, market cap, P/E and analyst rating. It is great for building a long-term watchlist and weak for technical trading, because it offers few chart-based filters.
4. Barchart
Barchart offers useful pre-built technical screens. For example, its RSI oversold screen lists stocks with an RSI below 30, which you can then sort by volume to find the most actively traded names.
5. StockAnalysis
StockAnalysis is a strong free option for fundamentals. It shows many data columns in clean tables, which suits investors who screen on revenue growth, margins or valuation.
6. Zacks
Zacks is built around earnings estimate revisions and its Zacks Rank system. The free tier gives you a taste of the screens; the full lists sit behind a subscription.
7. altFINS
altFINS is a technical analysis platform with a screener that already covers 2,000+ cryptocurrencies and 200+ tokenized stocks and ETFs (for example AAPLx, NVDAx, MSFTx, SPYx and QQQx from issuers such as xStocks and Ondo). Instead of building filters from zero, you start from presets such as oversold RSI, golden cross, new 52-week highs or bullish chart pattern breakouts. Full stock coverage is coming soon, so you can learn the workflow now and apply it to equities on day one.
Skip the manual filter building. altFINS presets combine trend, momentum and pattern rules into one click, and alerts tell you when a new ticker qualifies. Run a preset scan now or see plans and pricing.
Which filters matter most in a free stock screener
Takeaway: 6 filters cover 90% of useful screens; learn these before anything exotic.
- Market cap: sets the size of company. Large caps are above $10 billion, mid caps $2 to $10 billion, small caps $300 million to $2 billion.
- Average volume: keeps you in liquid stocks. Many traders require at least 500,000 shares a day.
- Price: a floor such as $5 removes most penny stocks and their wide spreads.
- Trend (moving averages): price above the 50-day and 200-day moving averages keeps you on the right side of the trend.
- Momentum (RSI): RSI above 50 shows bullish momentum; below 30 marks oversold; above 70 marks overbought.
- Valuation (P/E or P/S): stops you from paying any price for growth.
Learn the indicators behind these filters in our guides to RSI and RSI divergence and the 200-day simple moving average.
5 free stock screens you can copy today
Takeaway: start from a proven template and adjust one filter at a time.
| Screen | Filters | Who it suits |
|---|---|---|
| Golden cross | 50-day SMA crossed above 200-day SMA; volume above 500K; price above $5 | Swing and position traders |
| Oversold in an uptrend | RSI(14) below 30; price above 200-day SMA | Pullback buyers |
| New 52-week highs | Price within 2% of 52-week high; relative volume above 1.5 | Breakout and momentum traders |
| Unusual volume | Relative volume above 2; price change above 3% | Day traders and news traders |
| Quality at a fair price | Market cap above $10B; P/E below sector average; revenue growth above 10% | Long-term investors |
Go deeper on each screen in our guides to golden cross stocks, oversold stocks, 52-week high stocks and momentum stocks.
Do it in altFINS: each of these screens has a matching one-click preset (SMA 50/200 crossover, oversold uptrend, new highs and unusual volume gainers). Run it on tokenized stocks today and save it for when stocks go live.
How to use a free stock screener in 5 steps
Takeaway: a screener gives you candidates, not trades; the chart check is where decisions happen.
- Define the setup. Write one sentence: “I buy liquid stocks in an uptrend that pull back to support.”
- Translate it into filters. Uptrend = price above 200-day SMA. Pullback = RSI(14) below 40. Liquid = volume above 500K.
- Run and sort. Sort by volume or trend strength so the best names rise to the top.
- Check every chart. Confirm support and resistance, earnings dates and news before you act.
- Plan the trade. Set entry, stop-loss and target before you buy, and size the position so one loss costs 1% to 2% of your account.
Free vs paid stock screeners: pros and cons
Takeaway: free is enough for end-of-day research; pay when you need real-time data or alerts.
| Free screeners: pros | Free screeners: cons |
|---|---|
| No cost, so you can test several tools | Delayed quotes on many platforms |
| Enough filters for most swing and long-term screens | Few or no alerts, so you must re-run screens by hand |
| Good for learning how filters work | Ads, export limits and fewer saved screens |
| Pre-built screens on Finviz, Barchart and altFINS | Little or no backtesting |
A simple rule: if you check screens once a day after the close, a free plan is fine. If you trade intraday or want a ping the moment a stock qualifies, you need real-time data and alerts. altFINS alerts run 24/7 on price, indicators and chart patterns; see how altFINS alerts work.
How altFINS helps
Takeaway: altFINS turns screening rules into presets, patterns and alerts so you spend time on decisions, not filters.
- Screener with 150+ presets: trend, momentum, oversold, new highs, moving average crossovers and unusual volume, all one click away.
- Automated chart pattern recognition: triangles, wedges, flags, channels and head and shoulders detected for you, with breakout levels.
- Signals Summary: a live feed of fresh technical signals across the market.
- Tokenized stocks today, stocks soon: screen 200+ tokenized equities now, including mega caps and ETFs, and keep the same workflow when full stock coverage launches.
Frequently asked questions
What is the best free stock screener?
For most US investors, Finviz is the best free stock screener because it combines many fundamental and technical filters with a fast interface. TradingView is better if you want each result inside a full chart. Yahoo Finance suits beginners. For technical presets and chart pattern detection, altFINS covers crypto and tokenized stocks now, with full stocks coming soon.
Is Finviz free to use?
Yes. Finviz offers a free version with its full screener layout, many filters, heat maps and charts. The free version shows delayed quotes and has ads and no alerts. The paid Elite plan adds real-time data, alerts, data export and backtesting. Check Finviz’s current plan page for the latest price and features.
Does TradingView have a free stock screener?
Yes. TradingView’s stock screener is available on the free Basic plan, with fundamental and technical filters across many global markets. Its strength is that every result links to a full interactive chart. The free plan is ad-supported and limits the number of indicators per chart and active alerts, so frequent traders often upgrade.
What filters should a beginner use in a stock screener?
Start with five: market cap above $2 billion, average volume above 500,000 shares, price above $5, price above the 200-day moving average and RSI between 40 and 70. This keeps you in liquid, established stocks in an uptrend that are not overheated. Add one new filter at a time so you understand what each rule changes.
Are free stock screeners accurate?
Free screeners use the same exchange data as paid tools, but often with a delay of up to 15 to 20 minutes. That makes them accurate for end-of-day research and less reliable for fast intraday trading. Always open the chart to confirm a result, because screeners can miss news, earnings gaps and corporate actions such as splits.
Can I screen stocks and crypto in the same tool?
Yes. TradingView covers both, and altFINS lets you screen 2,000+ cryptocurrencies plus 200+ tokenized stocks and ETFs with the same technical presets today. altFINS is adding full stock coverage to its screener soon, so crypto traders can use one workflow across both markets.
Verdict
You do not need to pay to screen stocks well in 2026. Use Finviz or TradingView for broad US coverage, Yahoo Finance or StockAnalysis for fundamentals, and a technical tool with presets when your strategy depends on chart setups. Whatever you pick, remember that a screener only builds the shortlist; your chart check and risk plan make the trade. For unbiased investor education, see the SEC’s Investor.gov and FINRA’s investor center.
Screen smarter, not longer. Run 150+ technical presets, automated chart patterns and 24/7 alerts on crypto and 200+ tokenized stocks today, with full stocks coming soon. Open the altFINS screener or compare plans.
Disclaimer: This article is for educational purposes only and is not financial or investment advice. Trading stocks, tokenized stocks and cryptocurrencies involves substantial risk, and you can lose some or all of your capital. Third-party features and plans described here were checked in October 2026 and can change. altFINS does not receive payment from the other tools mentioned. Do your own research and consider speaking with a licensed financial professional before making investment decisions.
