

Search Knowledge Base by Keyword
Momentum Stocks: How to Find and Trade Them in 2026
Momentum stocks are stocks that have risen faster than the market over the past 3 to 12 months and keep attracting buyers. Momentum traders buy these leaders on the idea that strong trends tend to persist for a while. To trade them well, you need three things: a screen for relative strength, a confirmation from indicators such as RSI, MACD and volume, and strict exit rules, because momentum can reverse sharply.
This guide is for swing traders and active investors who want to ride strong trends instead of predicting turning points. It also works for crypto traders, since momentum behaves the same way in Bitcoin and altcoins as it does in equities.
You will learn what momentum stocks are, the research behind momentum investing, the 5 indicators that measure it, real momentum leaders from October 2026, and a step-by-step plan for entries, stops and exits. Updated October 2026.
Quick answer: A momentum stock is a stock with strong recent price performance, usually measured by 3 to 12 month returns, that is trading above its rising moving averages. To find momentum stocks, screen for top performers over 3 to 6 months, price above the 50-day and 200-day SMA, RSI(14) between 50 and 75, ADX above 25 and above-average volume. Buy on pullbacks or breakouts and exit when price closes below the 50-day SMA.
Find momentum leaders automatically: altFINS runs momentum uptrend, bullish RSI momentum, uptrend momentum inflection and unusual volume scans on 2,000+ coins and 200+ tokenized stocks today, with full stock coverage coming soon. Scan for momentum in altFINS.
🚀 What are momentum stocks?
Takeaway: momentum means buying what is already working, then getting out when it stops.
Momentum describes the speed and persistence of a price move. A momentum stock has outperformed the market and keeps making higher highs and higher lows. The strategy rests on a simple observation: stocks that have done well over the past several months have tended to keep doing well over the next several months, while losers have tended to keep lagging.
Momentum traders do not need to know why a stock is rising. They follow price, volume and trend, and they accept that they will rarely buy the bottom or sell the top.
Does momentum investing work? The research
Takeaway: momentum is one of the most studied return patterns in finance, but it comes with sharp crashes.
In their 1993 Journal of Finance paper, Narasimhan Jegadeesh and Sheridan Titman showed that buying past winners and selling past losers, based on 3 to 12 month returns, produced significant positive returns in US stocks over the following 3 to 12 months. Later research by Thomas George and Chuan-Yang Hwang (2004) linked much of that effect to how close a stock trades to its 52-week high.
The catch: momentum can crash. When the market turns sharply, often after a bear market bottom, yesterday’s leaders can fall fastest. That is why exits matter as much as entries.
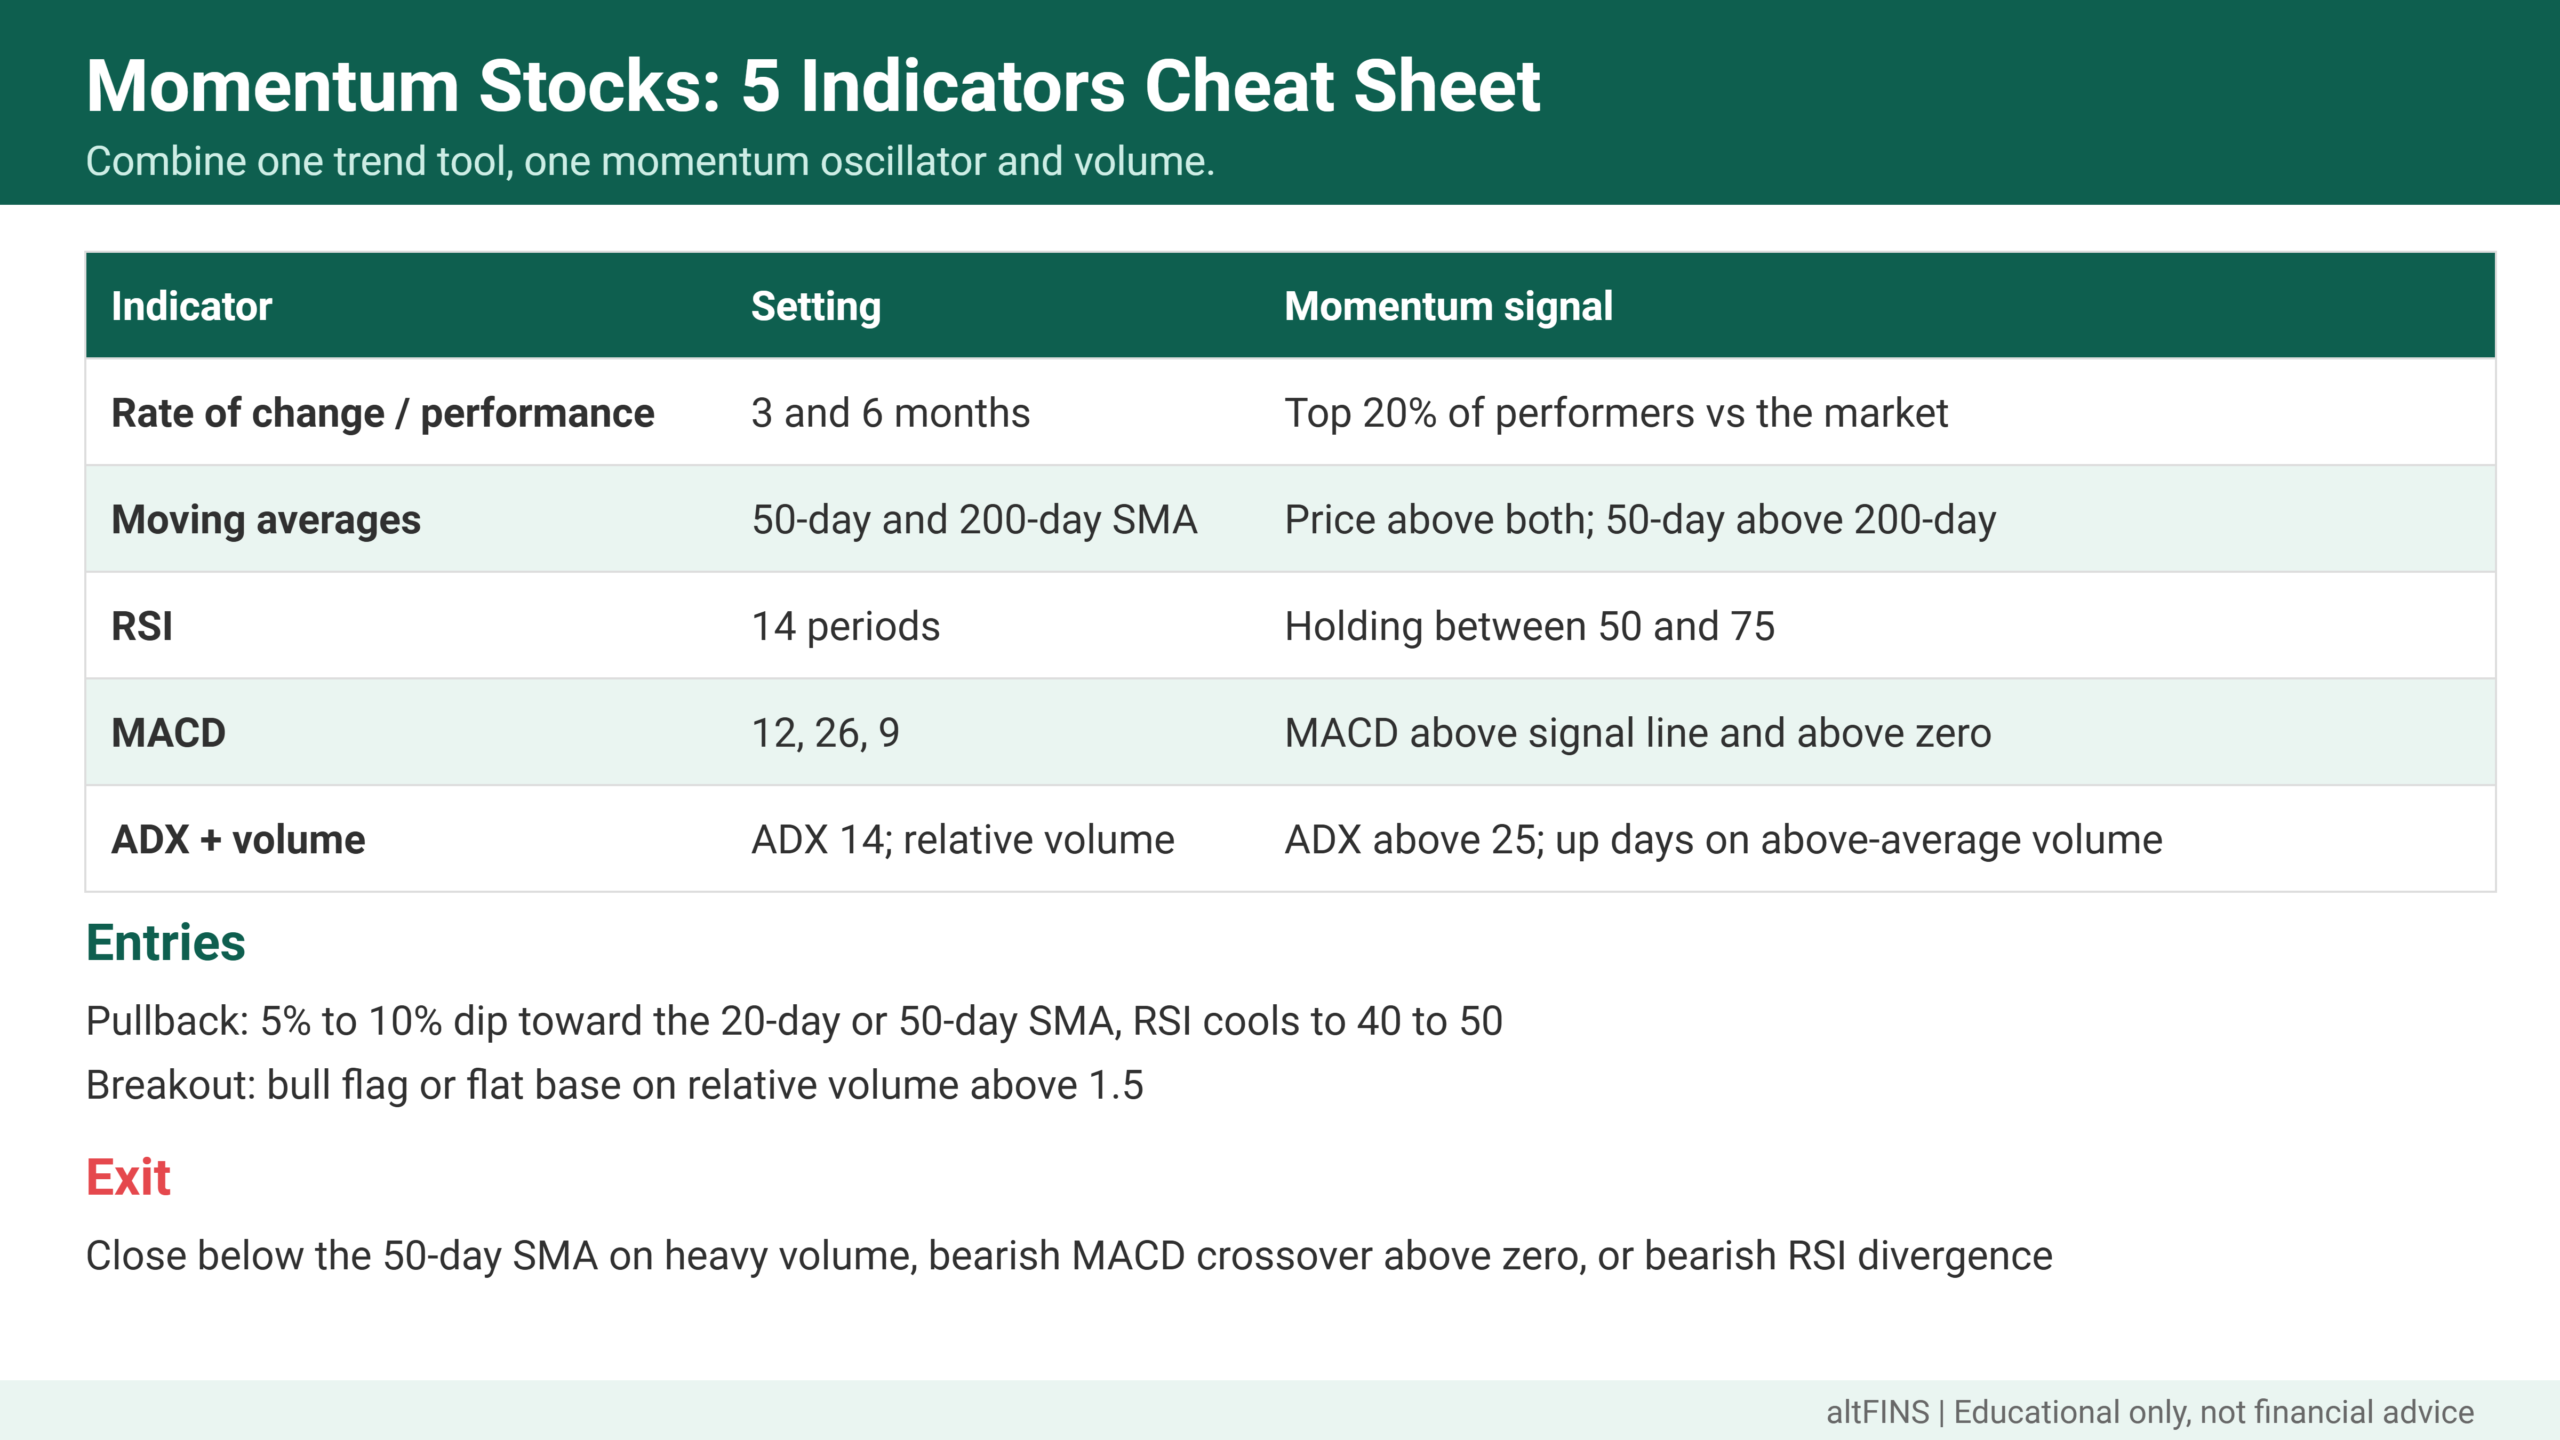
5 indicators to measure momentum
Takeaway: combine one trend tool, one momentum oscillator and volume; more indicators add noise.
| Indicator | Setting | Momentum signal | Warning sign |
|---|---|---|---|
| Rate of change / performance | 3 and 6 months | Top 20% of performers vs the market | Performance stalling while the index rises |
| Moving averages | 50-day and 200-day SMA | Price above both; 50-day above 200-day | Close below the 50-day SMA |
| RSI | 14 periods | Holding between 50 and 75 | Above 80 (stretched) or bearish divergence |
| MACD | 12, 26, 9 | MACD above signal line and above zero | Bearish crossover above zero |
| ADX + volume | ADX 14; relative volume | ADX above 25; up days on above-average volume | Falling ADX, rallies on thin volume |
Learn each tool in our guides to RSI, MACD, ADX and the momentum indicator.
Do it in altFINS: every screener result can show RSI, MACD, ADX, relative volume and short, medium and long-term trend scores side by side, so you can rank momentum without opening each chart.
Momentum leaders: real data from October 2026
Takeaway: the strongest 3-month performers often carry RSI above 70, so plan to buy the pullback.
Snapshot of tokenized US stocks in the altFINS screener on 14 October 2026. Tokenized stocks track the underlying shares but trade 24/7, so prices can differ slightly from the exchange close.
| Tokenized stock | 3-month change | 1-month change | RSI (14) | Medium-term trend |
|---|---|---|---|---|
| MicroStrategy (MSTRx) | +67.0% | +19.3% | 50.1 | Strong Up (9/10) |
| Palantir (PLTRx) | +62.8% | +27.2% | 76.5 | Strong Up (10/10) |
| Accenture (ACNx) | +55.2% | +16.8% | 68.1 | Strong Up (10/10) |
| Microsoft (MSFTx) | +39.8% | +10.7% | 74.4 | Strong Up (10/10) |
| Marvell (MRVLx) | +25.2% | +17.7% | 54.4 | Strong Up (10/10) |
Source: altFINS screener data, 14 October 2026. Examples only, not recommendations.
Palantir and Microsoft show classic late-stage momentum: big gains and RSI above 70. MicroStrategy and Marvell have strong 3-month gains with RSI near 50, which often means the stock has already cooled off and could offer a lower-risk pullback entry if the trend holds.
How to find momentum stocks in a screener
Takeaway: rank by performance, then keep only clean uptrends with volume.
- Performance: 3-month and 6-month price change in the top 20% of your universe.
- Trend: price above the 50-day and 200-day SMA; 50-day above 200-day.
- Momentum: RSI(14) between 50 and 75.
- Trend strength: ADX above 25.
- Liquidity: average volume above 500,000 shares and price above $5.
- Proximity to highs: within 10% of the 52-week high.
Let the screener rank momentum for you. altFINS momentum presets, trend scores and unusual volume scans surface leaders in seconds, and alerts flag new entries. Run a momentum scan now.
How to trade momentum stocks: entries, stops and exits
Takeaway: buy pullbacks or breakouts inside the trend, and let the 50-day SMA tell you when to leave.
Entry 1: the pullback
Wait for a momentum stock to pull back 5% to 10% toward its 20-day or 50-day moving average while RSI cools to 40 to 50. Buy when price bounces with a bullish candle and volume picks up. This is usually the best risk-to-reward entry.
Entry 2: the breakout
Buy when the stock breaks out of a short consolidation such as a bull flag or flat base on relative volume above 1.5. Breakouts to new highs are often the strongest momentum signals.
Stop-loss
Place the stop below the pullback low or the breakout base. Many momentum traders also use a maximum loss of 7% to 8% from entry.
Exit
Take partial profits after a 2:1 reward-to-risk move. Trail the rest under the 20-day SMA for fast trades or the 50-day SMA for longer swings. Exit on a close below the 50-day SMA on heavy volume, a bearish MACD crossover above zero, or a bearish RSI divergence at new highs.
Momentum investing: pros and cons
Takeaway: momentum is simple and rules-based, but it demands discipline and active management.
| Pros | Cons |
|---|---|
| Backed by decades of academic research | Sharp crashes when market leadership flips |
| Clear, rules-based entries and exits | Frequent trading raises costs and taxes |
| Keeps you in the strongest stocks | Often buys after a large move has happened |
| Works across stocks, ETFs and crypto | Whipsaws in sideways, choppy markets |
Do and don’t: momentum trading rules
Takeaway: most momentum losses come from chasing and from holding after the trend breaks.
- Do trade in the direction of the S&P 500 and Nasdaq 100 trend.
- Do buy pullbacks to the 20-day or 50-day SMA instead of extended spikes.
- Do check earnings dates; momentum stocks gap hard on results.
- Don’t buy a stock with RSI above 80 after a vertical run.
- Don’t hold through a close below the 50-day SMA on heavy volume.
- Don’t risk more than 1% to 2% of your account on one trade; see the altFINS risk management ebook.
How altFINS helps
Takeaway: altFINS ranks momentum, confirms it with patterns and signals, and alerts you when trends start or break.
- Momentum presets: momentum uptrend, bullish momentum RSI, uptrend momentum inflection, MACD signal crossover, RVOL spike uptrend and unusual volume gainers.
- Trend scores: short, medium and long-term trend ratings from Strong Down (0/10) to Strong Up (10/10).
- Signals Summary: a live feed of new momentum and trend signals.
- Coverage: 2,000+ coins and 200+ tokenized stocks today; full stocks coming to the screener soon.
Frequently asked questions
What are momentum stocks?
Momentum stocks are stocks with strong recent price performance, typically over the past 3 to 12 months, that trade above rising moving averages and keep attracting buyers. Momentum investors buy them because strong trends have historically tended to persist for a while. They sell when the trend weakens, usually on a close below the 50-day moving average.
How do you find momentum stocks?
Use a screener. Rank stocks by 3-month and 6-month performance, then keep those trading above their 50-day and 200-day moving averages, with RSI(14) between 50 and 75, ADX above 25 and above-average volume. Finally, check each chart for a clean uptrend and an entry such as a pullback or breakout.
What is the best indicator for momentum?
No single indicator is best. RSI is the most popular momentum oscillator, MACD shows momentum shifts through crossovers, and ADX measures trend strength. Price performance over 3 to 6 months is the core measure used in academic momentum research. Combining one trend tool, one oscillator and volume works better than any indicator alone.
How long should you hold a momentum stock?
Hold as long as the trend holds. Many traders stay in while price remains above the 20-day or 50-day moving average and exit on a close below it. Academic momentum strategies typically use holding periods of 3 to 12 months, while swing traders may hold for days to weeks.
Is momentum trading risky?
Yes. Momentum stocks are often volatile, can gap on earnings and can reverse sharply when market leadership changes. Momentum strategies have also suffered large drawdowns after market bottoms. Manage the risk with stop-losses, position sizing that limits each loss to 1% to 2% of your account, and by avoiding entries when RSI is above 80.
Verdict
Momentum stocks reward traders who follow the trend and respect their exits. Screen for relative strength, confirm with RSI, MACD, ADX and volume, buy pullbacks or clean breakouts, and step aside when price loses the 50-day moving average. For neutral investor education, see Investopedia’s momentum investing guide and the SEC’s Investor.gov.
Ride trends with rules, not emotions. Rank momentum, spot breakout patterns and get 24/7 alerts on 2,000+ coins and 200+ tokenized stocks, with stocks joining soon. Find momentum leaders in altFINS or compare plans.
Disclaimer: This article is for educational purposes only and is not financial or investment advice. Trading stocks, tokenized stocks and cryptocurrencies involves substantial risk, and you can lose some or all of your capital. Academic findings and past momentum do not guarantee future results. The tickers shown are examples from a dated data snapshot, not recommendations. Do your own research and consider speaking with a licensed financial professional before making investment decisions.
