

Search Knowledge Base by Keyword
Golden Cross Stocks: How to Find and Trade Them in 2026
Golden cross stocks are stocks whose 50-day moving average has just crossed above their 200-day moving average. Traders read this as a sign that a short-term recovery has turned into a longer-term uptrend. The signal works best when volume rises, the 200-day average flattens or turns up, and the broader market is also above its own 200-day line.
This guide is for swing traders, position traders and long-term investors who want a simple, rules-based trend filter. It is also for crypto traders who already know the golden cross from Bitcoin charts and want to apply it to equities.
You will learn how the signal works, how to screen for golden cross stocks, what the historical data says, which stocks are close to a golden cross right now, and how to avoid the false signals that trap most beginners. Updated October 2026.
Quick answer: A golden cross happens when a stock’s 50-day simple moving average (SMA) crosses above its 200-day SMA. It is a lagging, trend-following signal that confirms an uptrend rather than predicting one. To find golden cross stocks, screen for a fresh 50/200 crossover, then confirm with rising volume, price above both averages and a market in an uptrend. The opposite signal is the death cross.
Find crosses without checking charts one by one: the altFINS screener flags 50/200 SMA crossovers, EMA crossovers and trend upgrades across 2,000+ coins and 200+ tokenized stocks today, with full stock coverage coming soon. Scan for golden crosses in altFINS.
✨ What is a golden cross?
Takeaway: the golden cross is a trend confirmation, not an early entry signal.
A moving average is the average closing price over a set number of days. The 50-day SMA tracks the medium-term trend. The 200-day SMA tracks the long-term trend and is the line most institutions watch. When the faster 50-day line rises through the slower 200-day line, recent prices are strong enough to pull the medium-term average above the long-term one.
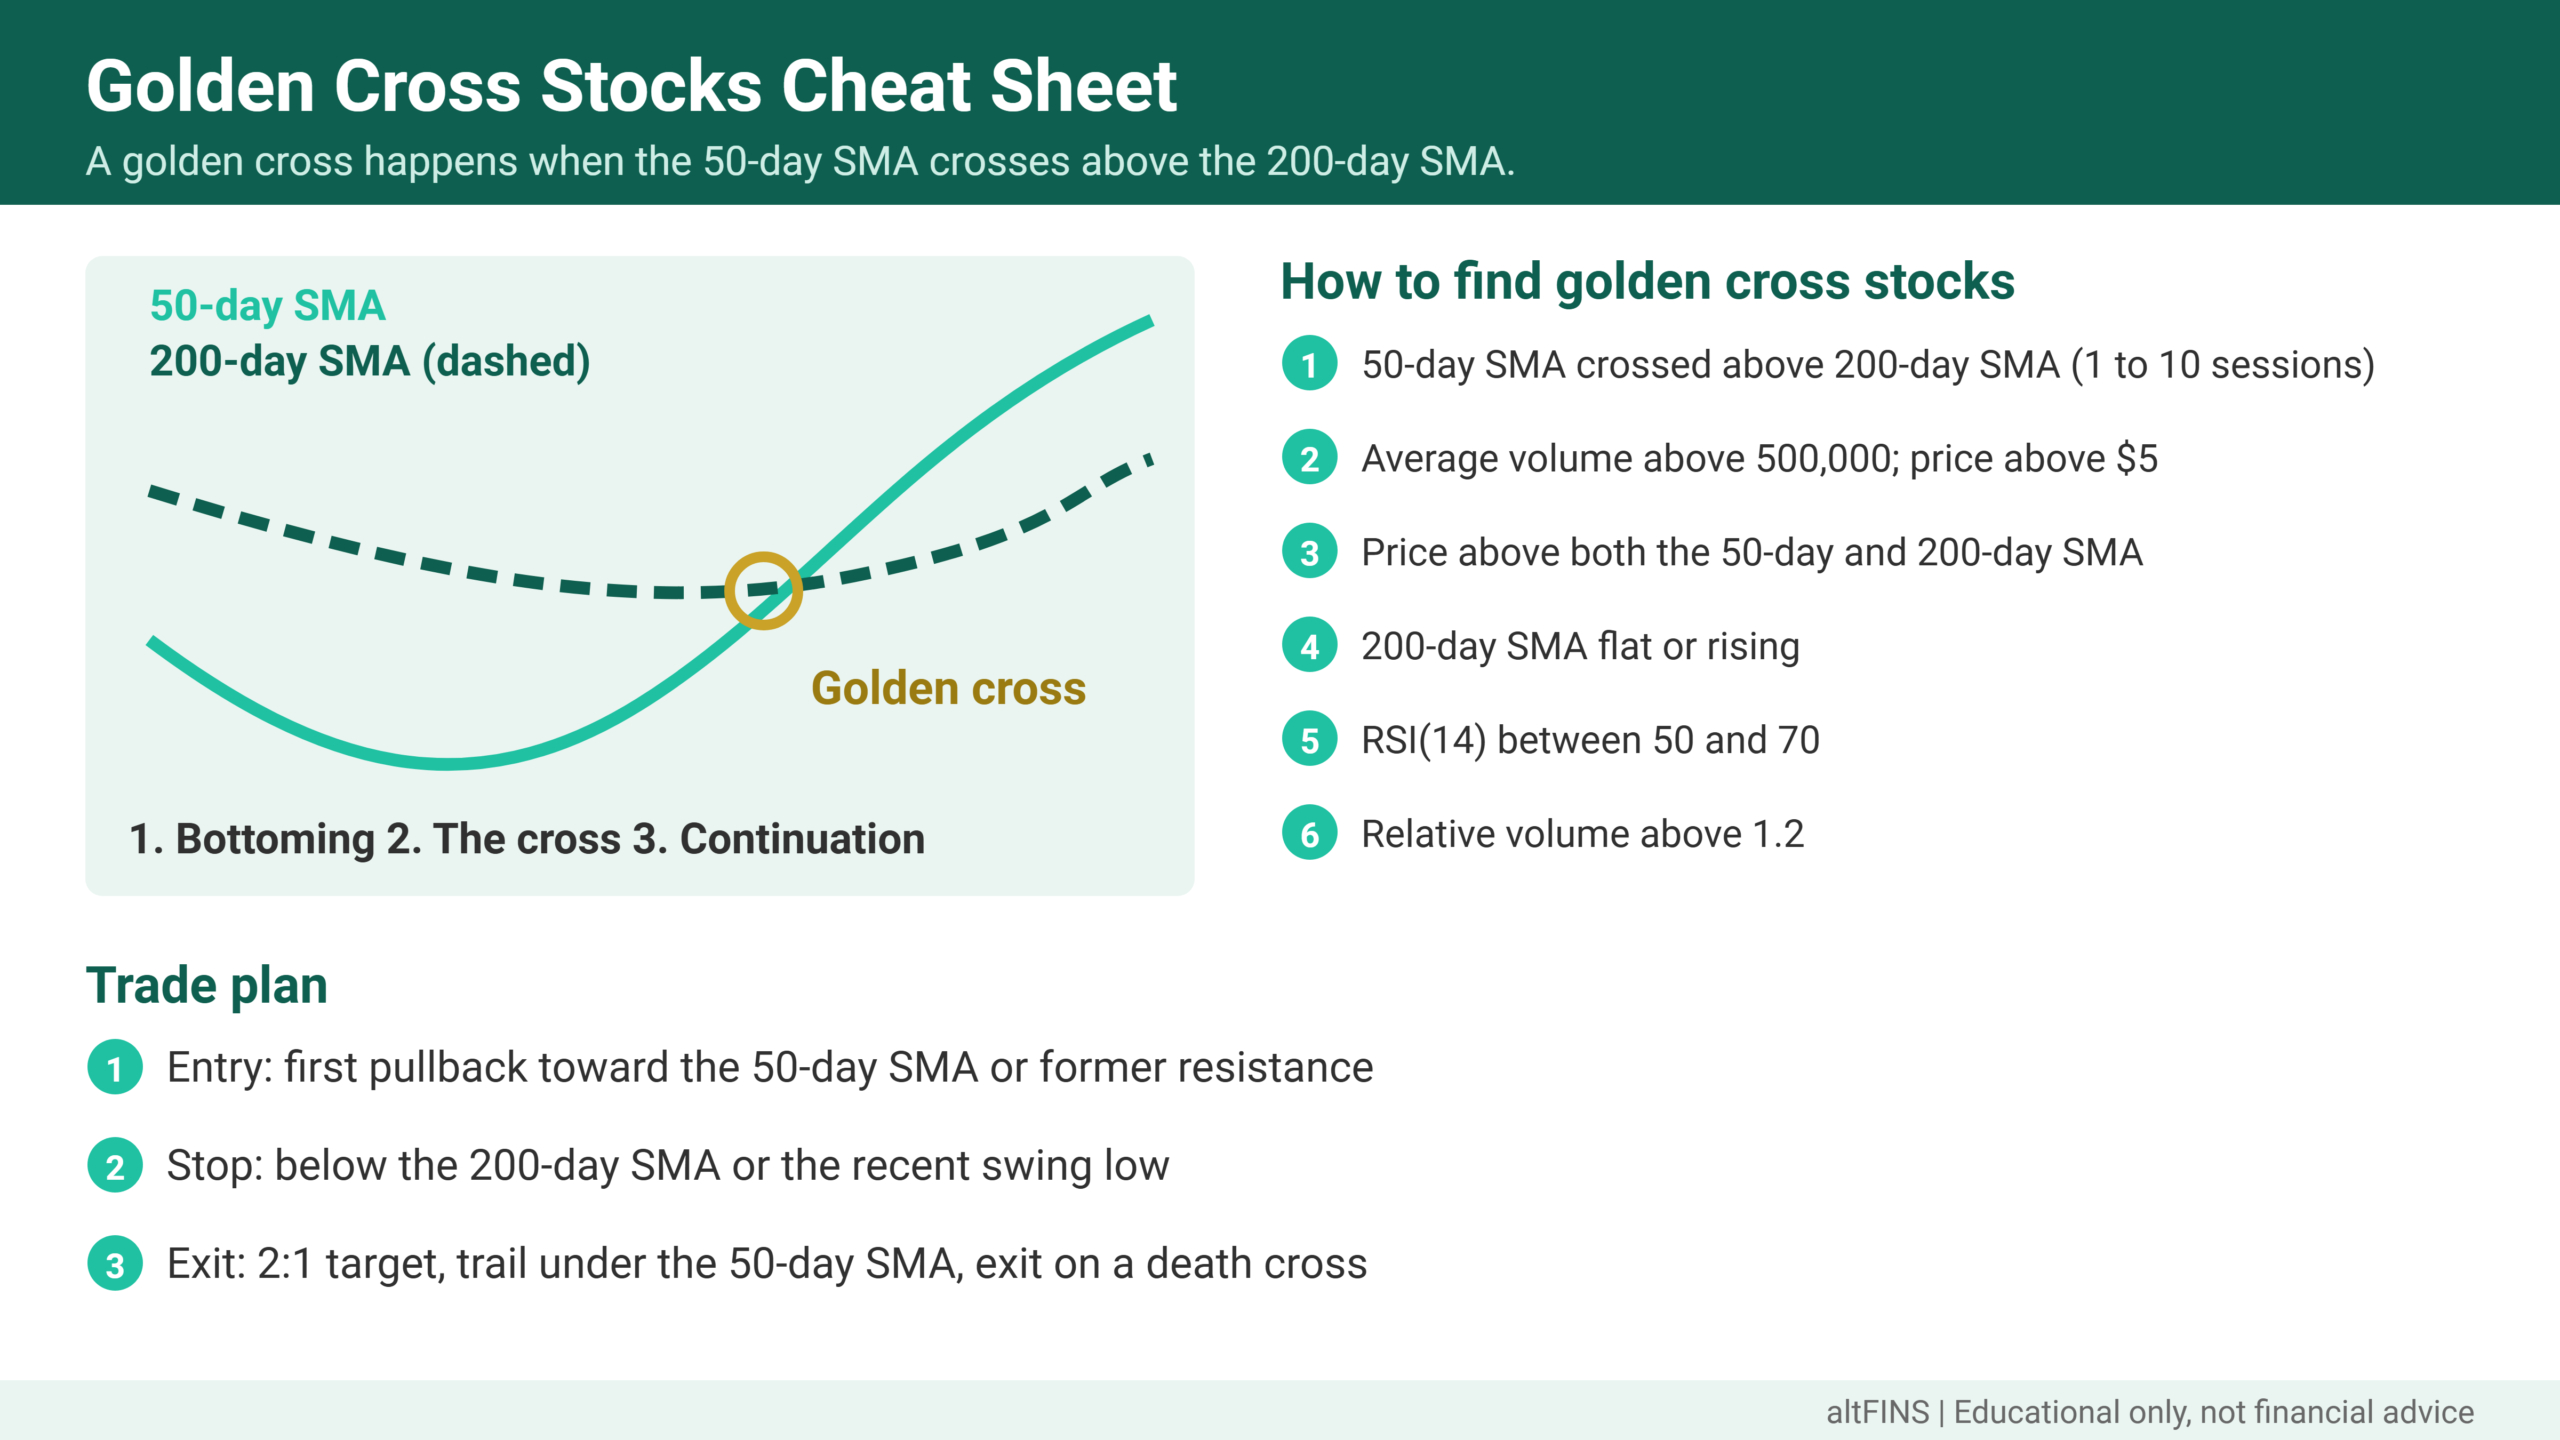
A golden cross unfolds in three stages:
- Bottoming: a downtrend ends and selling pressure fades.
- The cross: the 50-day SMA crosses above the 200-day SMA, confirming the turn.
- Continuation: price holds above both averages, and the 50-day and 200-day lines act as support on pullbacks.
New to moving averages? Read our guides to the 200-day simple moving average and SMA vs EMA, plus our general golden cross explainer.
Golden cross vs death cross
Takeaway: the two signals are mirror images; treat each as context for the trend, not a timing tool.
| Feature | Golden cross | Death cross |
|---|---|---|
| Definition | 50-day SMA crosses above 200-day SMA | 50-day SMA crosses below 200-day SMA |
| Trend message | Long-term uptrend likely starting | Long-term downtrend likely starting |
| Typical action | Look for long entries on pullbacks | Reduce exposure, tighten stops or avoid longs |
| Best confirmation | Rising volume, 200-day SMA flattening or rising | Rising volume on declines, 200-day SMA turning down |
| Main weakness | Arrives late, after a big part of the rally | Often appears near short-term lows |
Does the golden cross work on stocks? What the data says
Takeaway: on major indexes the record is positive, but individual stocks produce far more false signals.
On the S&P 500, the evidence is encouraging. A study by SentimenTrader (July 2025) found that every one of the last 23 golden cross signals since 1978 was followed by a gain in the index about nine months later. Results from 1920 to 1977 were more mixed, with 23 wins and 14 losses. The most recent daily S&P 500 golden cross in that study triggered on 1 July 2025.
Single stocks are noisier. A stock can cross, stall and then cross back down within weeks, especially small caps and stocks moving on news. That is why the confirmation rules below matter more than the cross itself.
How to find golden cross stocks in a screener
Takeaway: screen for the cross, then filter for quality and confirmation.
- Core filter: 50-day SMA crossed above 200-day SMA in the last 1 to 10 sessions.
- Liquidity: average volume above 500,000 shares and price above $5.
- Trend quality: price above both the 50-day and 200-day SMA.
- Slope: 200-day SMA flat or rising, not still falling steeply.
- Momentum: RSI(14) between 50 and 70, so momentum is positive but not overheated.
- Volume: relative volume above 1.2 on the day of the cross or the breakout that caused it.
Do it in altFINS: open the screener, choose the SMA 50/200 bullish crossover preset, then add RSI14 between 50 and 70 and sort by trend score. Save the scan and set an alert so new crosses come to you.
Never miss the next cross. altFINS scans moving average crossovers (SMA 50/200, EMA 12/50, EMA 50/200 and more) and sends alerts 24/7. Set up your golden cross scan.
Golden cross watchlist: real data from October 2026
Takeaway: the best candidates are stocks where price already sits above both averages and the gap is closing.
Here is a snapshot from the altFINS screener on 14 October 2026, using tokenized versions of US stocks (they track the underlying shares but trade 24/7, so prices can differ slightly from the exchange close).
| Tokenized stock | Price | 50-day SMA | 200-day SMA | Status |
|---|---|---|---|---|
| Alphabet (GOOGLx) | 356.64 | 344.68 | 352.40 | 50-day about 2.2% below 200-day; price above both: golden cross candidate |
| Tesla (TSLAx) | 376.11 | 366.29 | 377.52 | 50-day about 3.0% below 200-day; price testing the 200-day |
| Microsoft (MSFTx) | 545.09 | 511.85 | 440.55 | Golden cross in force; RSI 74, overbought |
| Apple (AAPLx) | 342.98 | 331.13 | 305.55 | Golden cross in force; strong uptrend |
| Oracle (ORCLx) | 143.09 | 147.16 | 159.46 | Death cross in force; avoid longs until trend repairs |
Source: altFINS screener data, 14 October 2026. Figures are for education and will change daily.
How to trade golden cross stocks
Takeaway: buy the first healthy pullback after the cross, not the cross candle itself.
Entry
Most of the move that creates a golden cross has already happened by the time the averages cross. A lower-risk entry is the first pullback toward the 50-day SMA or a prior resistance level that has turned into support. Wait for a bullish candle or a bounce with volume before you enter.
Stop-loss
Place the stop below the 200-day SMA or below the most recent swing low, whichever is closer and still logical. If price closes below the 200-day line, the golden cross thesis is weakening.
Exit
Take partial profits at the next major resistance or at a 2:1 reward-to-risk target. Trail the rest under the 50-day SMA. Exit fully on a death cross or a weekly close below the 200-day SMA.
Do and don’t: golden cross rules
Takeaway: confirmation and context turn a noisy signal into a useful filter.
| Do | Don’t |
|---|---|
| Confirm with rising volume and price above both averages | Buy the cross day blindly after a vertical rally |
| Check that the S&P 500 or Nasdaq 100 is also in an uptrend | Trade crosses in a stock that is going sideways around its 200-day SMA |
| Check the earnings date before you enter | Ignore gaps caused by earnings or guidance changes |
| Combine with RSI, MACD or a chart pattern breakout | Use the golden cross as your only signal |
| Size positions so one loss costs 1% to 2% of your account | Skip the stop-loss because the signal “is bullish” |
For a second confirmation, pair the cross with a MACD signal line crossover or a breakout from a bullish chart pattern found by altFINS chart pattern recognition.
How altFINS helps
Takeaway: altFINS automates the crossover hunt and adds the confirmation layers for you.
- Moving average crossover presets: SMA 50/200, SMA 100/200, EMA 12/50, EMA 50/200 and price above 200-day SMA.
- Trend scores: short, medium and long-term trend ratings from Strong Down (0/10) to Strong Up (10/10), so you can see whether a cross sits inside a real trend.
- Chart pattern breakouts: combine the cross with a triangle, flag or channel breakout for a stronger setup.
- Signals Summary: a live feed of fresh bullish and bearish technical signals.
- Coverage: 2,000+ coins and 200+ tokenized stocks and ETFs today; full stocks coming to the screener soon.
Frequently asked questions
What is a golden cross in stocks?
A golden cross in stocks is a chart signal that appears when the 50-day simple moving average crosses above the 200-day simple moving average. It shows that medium-term momentum has overtaken the long-term trend and often confirms the start of a new uptrend. Because both averages use past prices, the signal lags and works best with volume and trend confirmation.
How reliable is the golden cross?
On the S&P 500 it has a strong record: SentimenTrader found the index was higher about nine months after each of the last 23 signals since 1978. On individual stocks it is less reliable, because single names whipsaw around their 200-day average more often. Use it as a trend filter and confirm with volume, RSI or a chart pattern breakout.
Should you buy a stock on a golden cross?
Buying on the day of the cross often means buying after a large rally. A safer approach is to wait for the first pullback toward the 50-day SMA or a former resistance level, enter on a bullish candle, and place a stop below the 200-day SMA or the recent swing low. Always check earnings dates and the broader market first.
How long does a golden cross rally last?
There is no fixed length. Some golden crosses lead to trends lasting many months, while others fail within weeks and reverse into a death cross. Traders usually stay in the trade while price holds above the 50-day or 200-day SMA and exit on a close below the 200-day line or a confirmed death cross.
Is the golden cross better on daily or weekly charts?
The classic golden cross uses daily charts with 50-day and 200-day averages. Weekly versions, such as the 50-week crossing the 200-week, are rarer and point to multi-year trends. Shorter timeframes produce more signals and more noise. Most swing traders use the daily chart and check the weekly chart for context.
Verdict
Golden cross stocks are a solid starting point for trend-following, but the cross is only the first filter. The best trades combine the 50/200 crossover with rising volume, a supportive market, a sensible entry on a pullback and a firm stop below the 200-day SMA. For more on moving averages from a neutral source, see Investopedia’s golden cross definition and the SEC’s Investor.gov.
Let the screener find the crosses. Scan SMA and EMA crossovers, trend scores and chart pattern breakouts on 2,000+ coins and 200+ tokenized stocks, with stocks joining soon. Start scanning in altFINS or compare plans.
Disclaimer: This article is for educational purposes only and is not financial or investment advice. Trading stocks, tokenized stocks and cryptocurrencies involves substantial risk, and you can lose some or all of your capital. Past signals and backtests do not guarantee future results. The tickers shown are examples from a dated data snapshot, not recommendations. Do your own research and consider speaking with a licensed financial professional before making investment decisions.
