Search Knowledge Base by Keyword
Cup and Handle Pattern: How to Identify and Trade It in Crypto (2026)
The cup and handle pattern is a bullish continuation chart pattern. Price forms a rounded, U-shaped bottom (the cup), then a short, shallow pullback near the old high (the handle). A close above the handle’s resistance signals that the prior uptrend is likely to resume.
This guide is for crypto traders who want a clear rule set for one of the best-performing chart patterns in technical analysis. You will learn how to spot a valid cup and handle, how to measure its target, where to place your stop, and how it differs from look-alikes such as the rounding bottom and the double bottom.
We also cover the inverse cup and handle, the most common reasons the pattern fails in 24/7 crypto markets, and how to scan for breakouts across thousands of coins. Updated September 2026.
Quick answer: A cup and handle is a bullish pattern made of a U-shaped cup followed by a small downward drift called the handle. Traders buy when price closes above the handle’s resistance on rising volume, place a stop below the handle low, and target the cup’s depth added to the breakout price. Thomas Bulkowski ranks it 3rd of 39 chart patterns, with a 5% break-even failure rate.
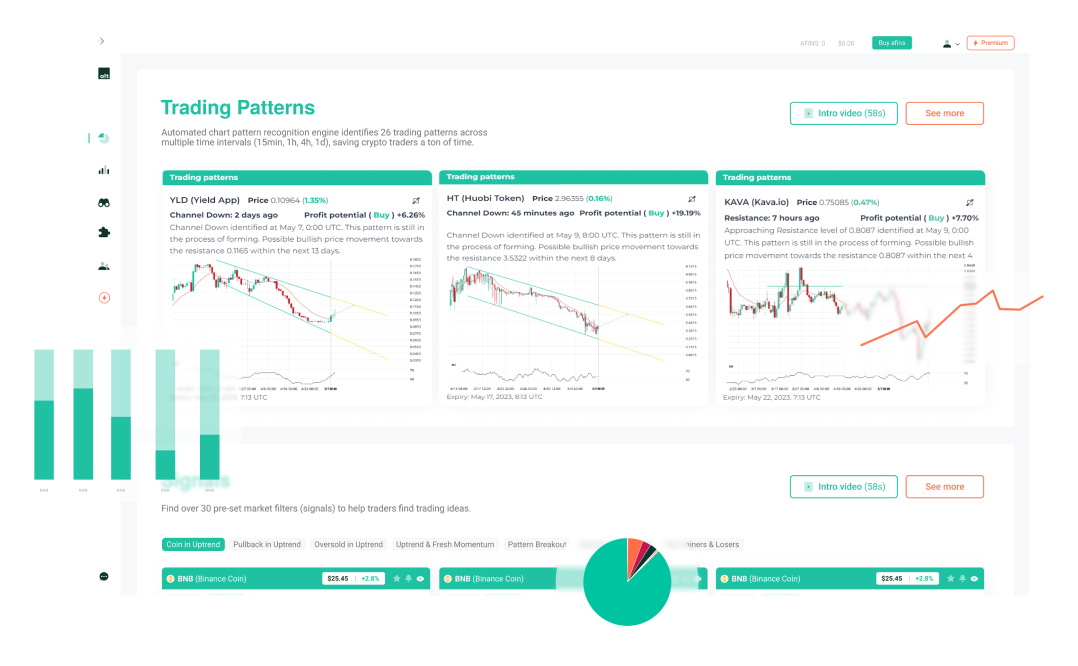
Cup and Handle patterns on altFINS
What is a cup and handle pattern?
Takeaway: it is a pause inside an uptrend: a slow rounded dip, a last shakeout, then a breakout.
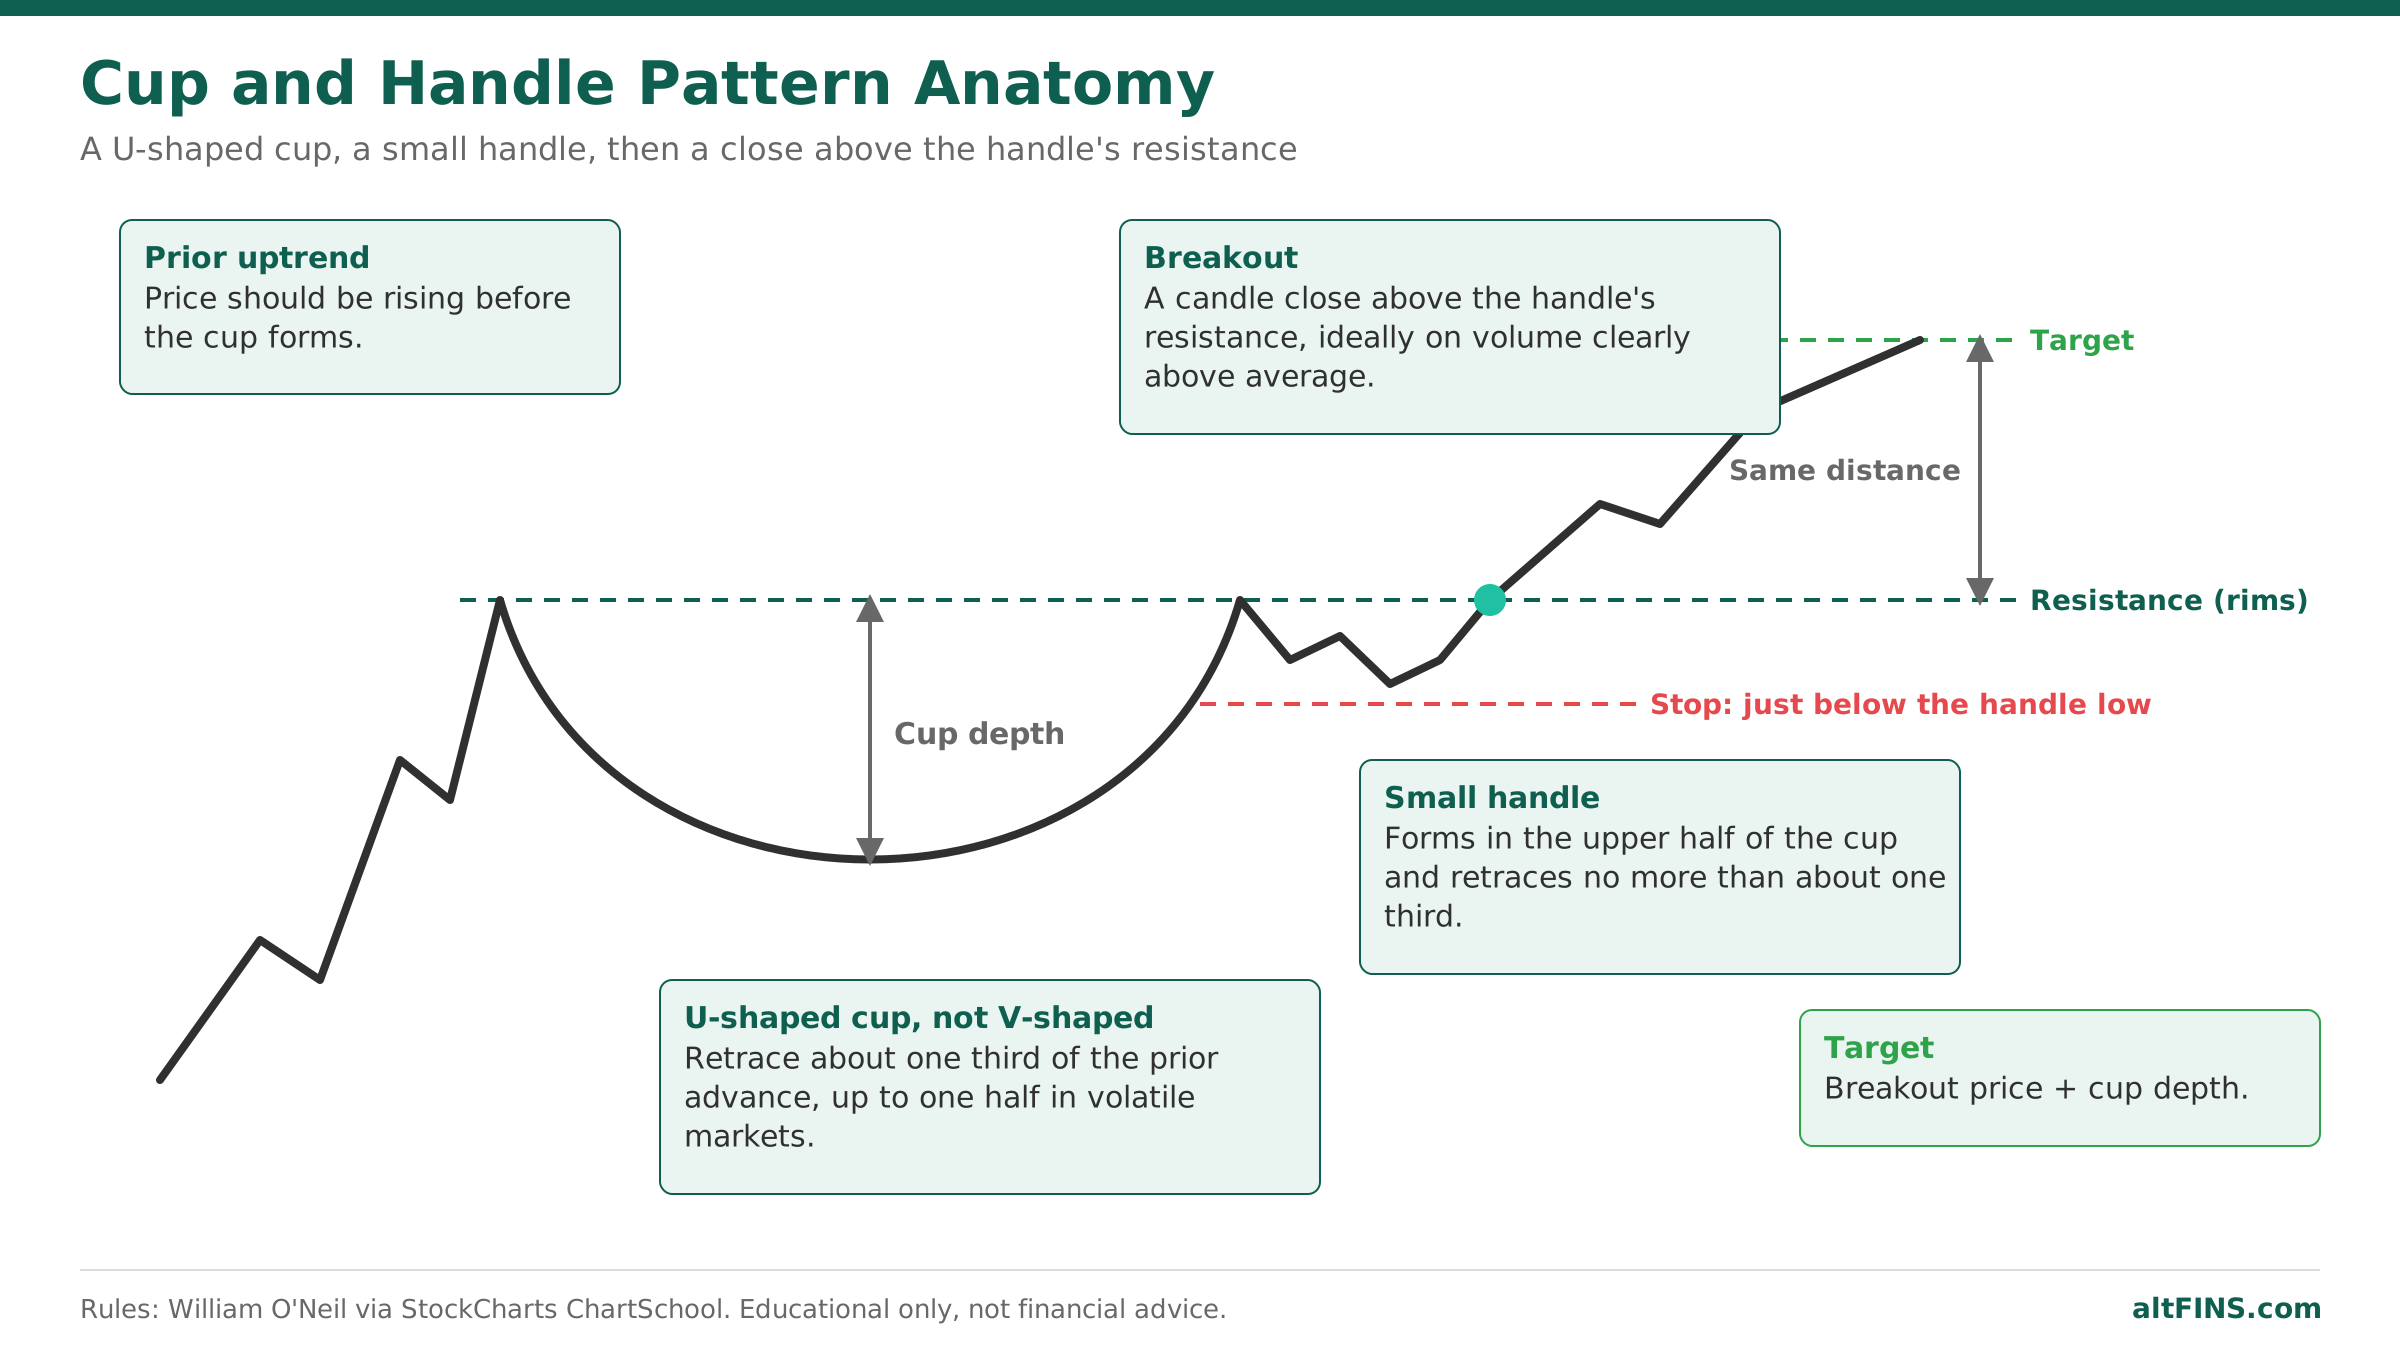
The pattern was popularized by investor William O’Neil in his 1988 book How to Make Money in Stocks. It has three parts:
- The cup: after a rally, price pulls back and forms a rounded, U-shaped bottom. The left and right rims of the cup sit near the same price.
- The handle: price reaches the old high, stalls, and drifts slightly lower or sideways in a small channel or flag.
- The breakout: price closes above the handle’s resistance, usually on higher volume, and the uptrend resumes.
The psychology is what makes it work. The rounded cup shows sellers slowly losing control rather than a panic reversal. The handle shakes out the last weak holders who bought at the old high. When those sellers are gone, there is little supply left overhead, so a breakout can move quickly.
How to identify a cup and handle: 6 rules
Takeaway: the shape, depth and handle size decide whether a cup and handle is real.
- Prior uptrend. The cup should form after a clear advance. A cup and handle is a continuation pattern, so it needs a trend to continue.
- U-shaped cup, not V-shaped. A rounded bottom shows a gradual shift in control. A sharp V is a different, less reliable setup.
- Moderate depth. The cup should retrace about one third of the prior advance. Up to one half is acceptable in volatile markets, which includes most altcoins.
- Similar rims. The left and right highs of the cup should be near the same price.
- Small handle in the upper half. The handle should form in the upper half of the cup and retrace no more than about one third of the cup’s advance. Shallower handles are more bullish.
- Breakout on volume. Confirmation is a candle close above the handle’s resistance, ideally with volume clearly above the recent average.
These rules come from O’Neil’s original criteria as summarized by StockCharts ChartSchool. On stock charts the cup usually lasts one to six months. Crypto moves faster, so valid cups on the daily chart often form in a few weeks, and on the 4 hour chart in a few days.
Cup and handle vs similar patterns
Takeaway: the handle and the U-shape are what separate a cup and handle from its look-alikes.
| Pattern | Shape | Typical bias | Entry trigger |
|---|---|---|---|
| Cup and handle | U-shaped bottom, then a small pullback near the high | Bullish continuation | Close above the handle’s resistance |
| Inverse cup and handle | Upside-down U at a top, then a small bounce near the low | Bearish | Close below the handle’s support |
| Rounding bottom | U-shaped bottom with no handle | Bullish reversal | Close above the rim |
| Double bottom | Two distinct lows at a similar price, W-shaped | Bullish reversal | Close above the middle peak |
| Bull flag | Sharp rally (the pole), then a short parallel pullback | Bullish continuation | Close above the flag’s upper line |
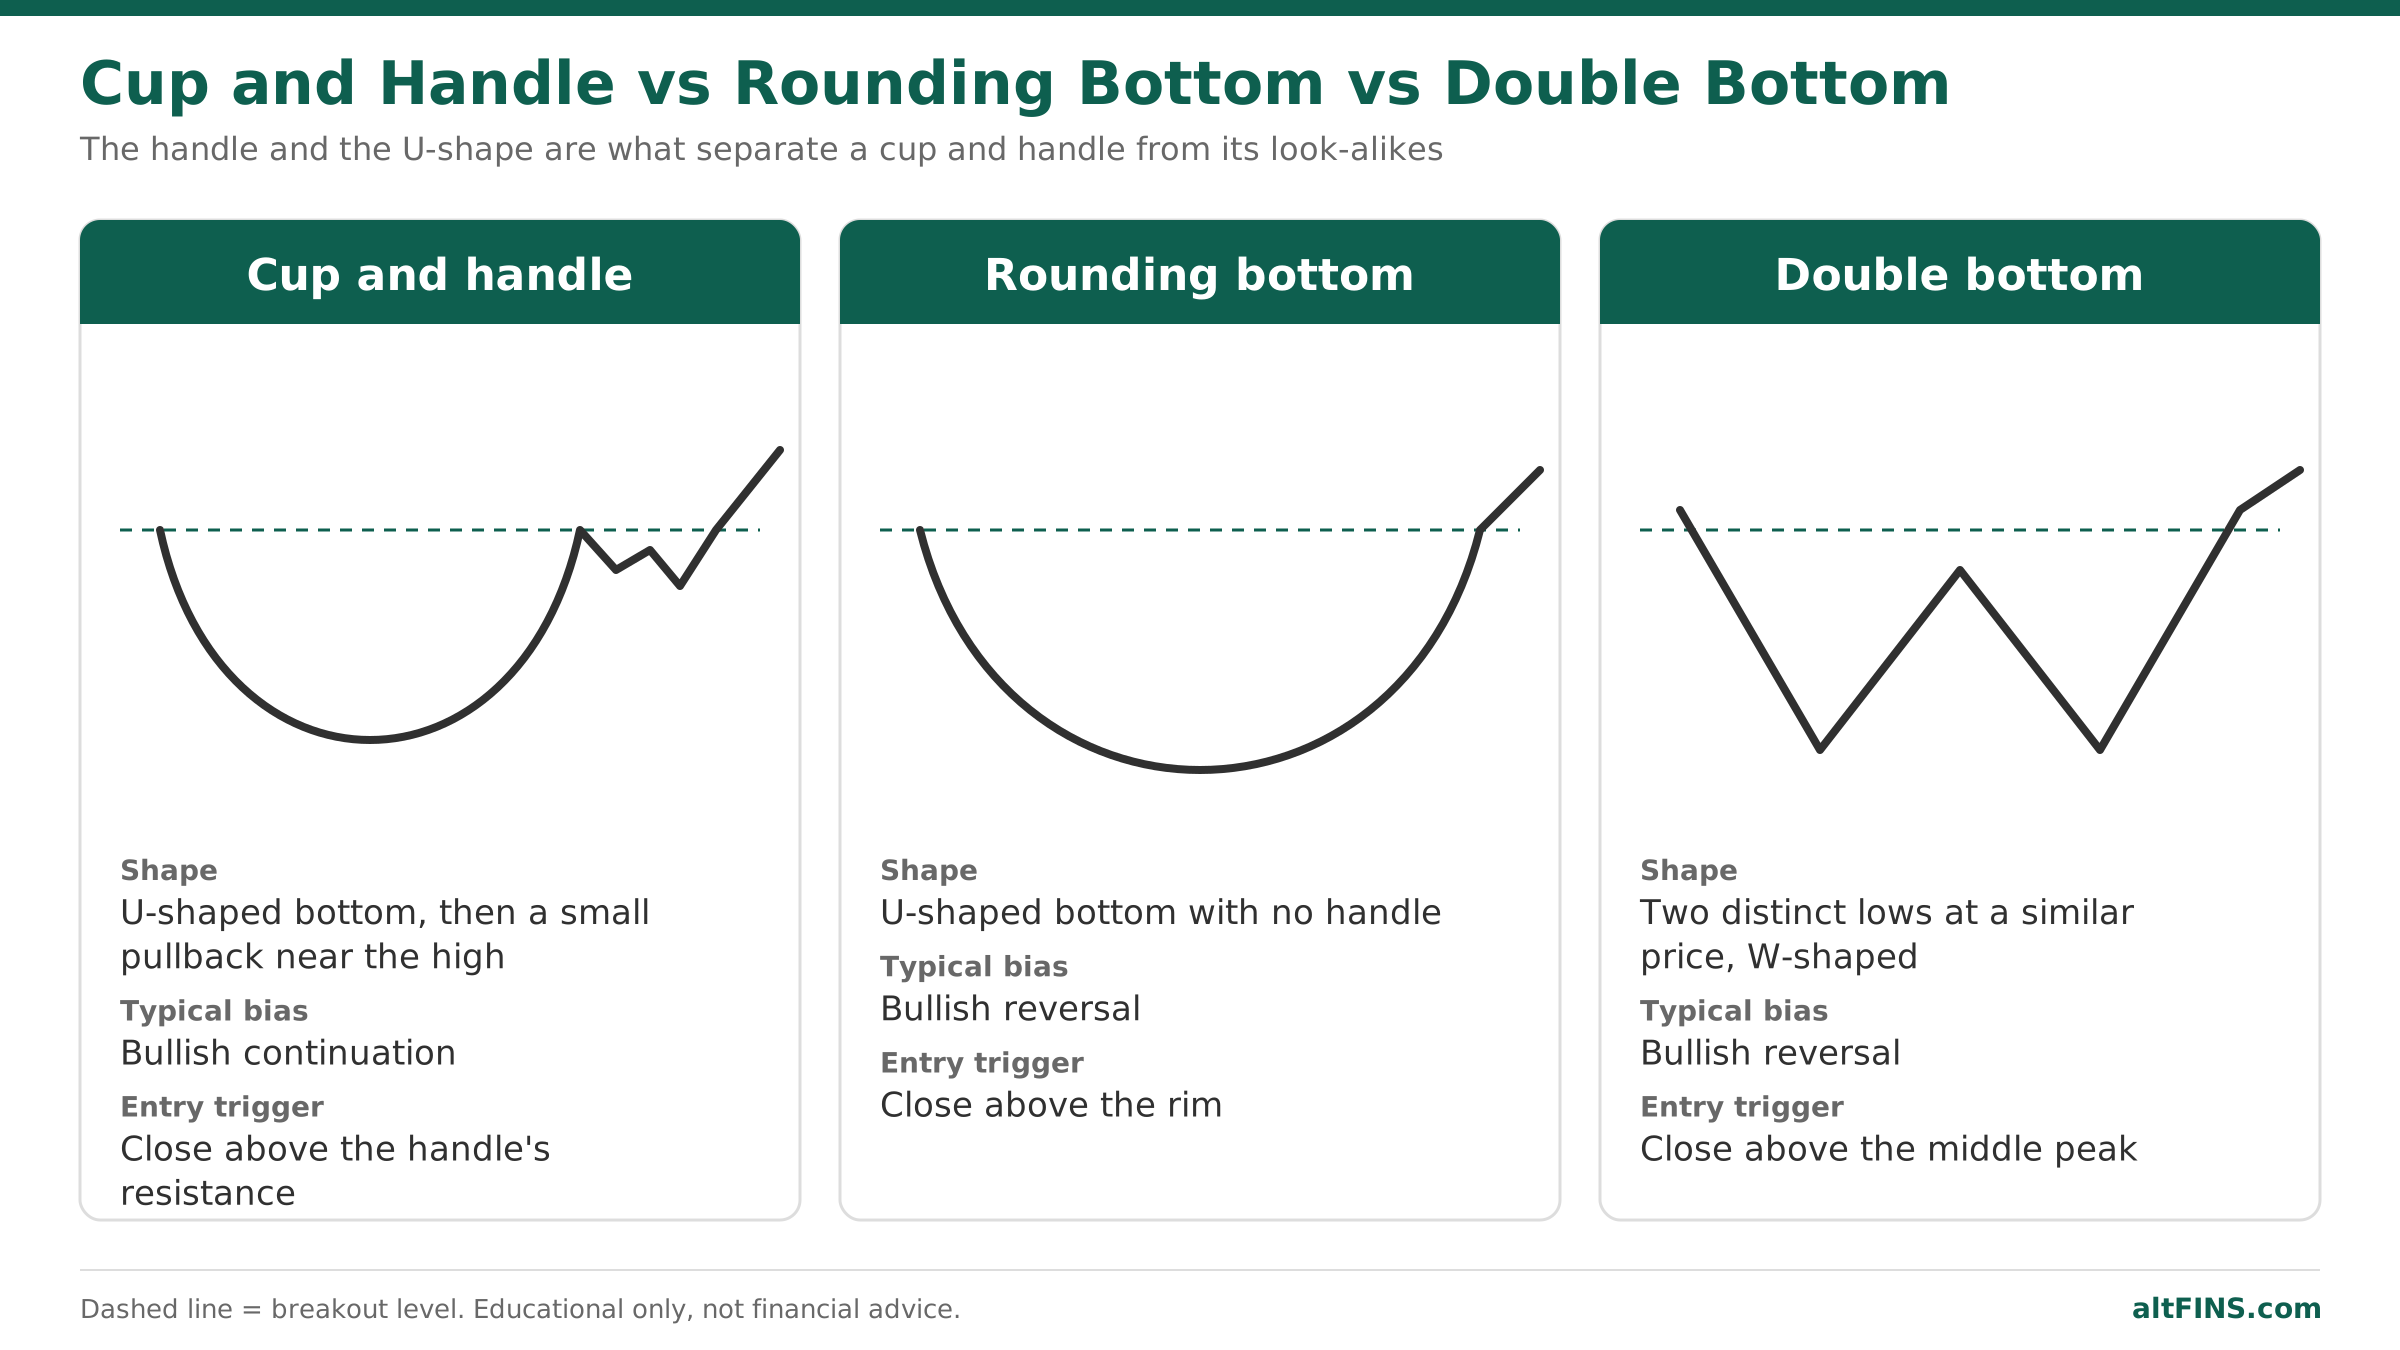
Cup and handle candlestick pattern vs rounding bottom pattern
If the bottom has two clear lows instead of a smooth curve, you are looking at a double bottom, not a cup. If the pullback after the high is a tight parallel channel after a near-vertical rally, it is closer to a bull flag.
How reliable is the cup and handle pattern?
Takeaway: it is one of the strongest bullish chart patterns in the data, but about four in ten breakouts still fall short of the full target.
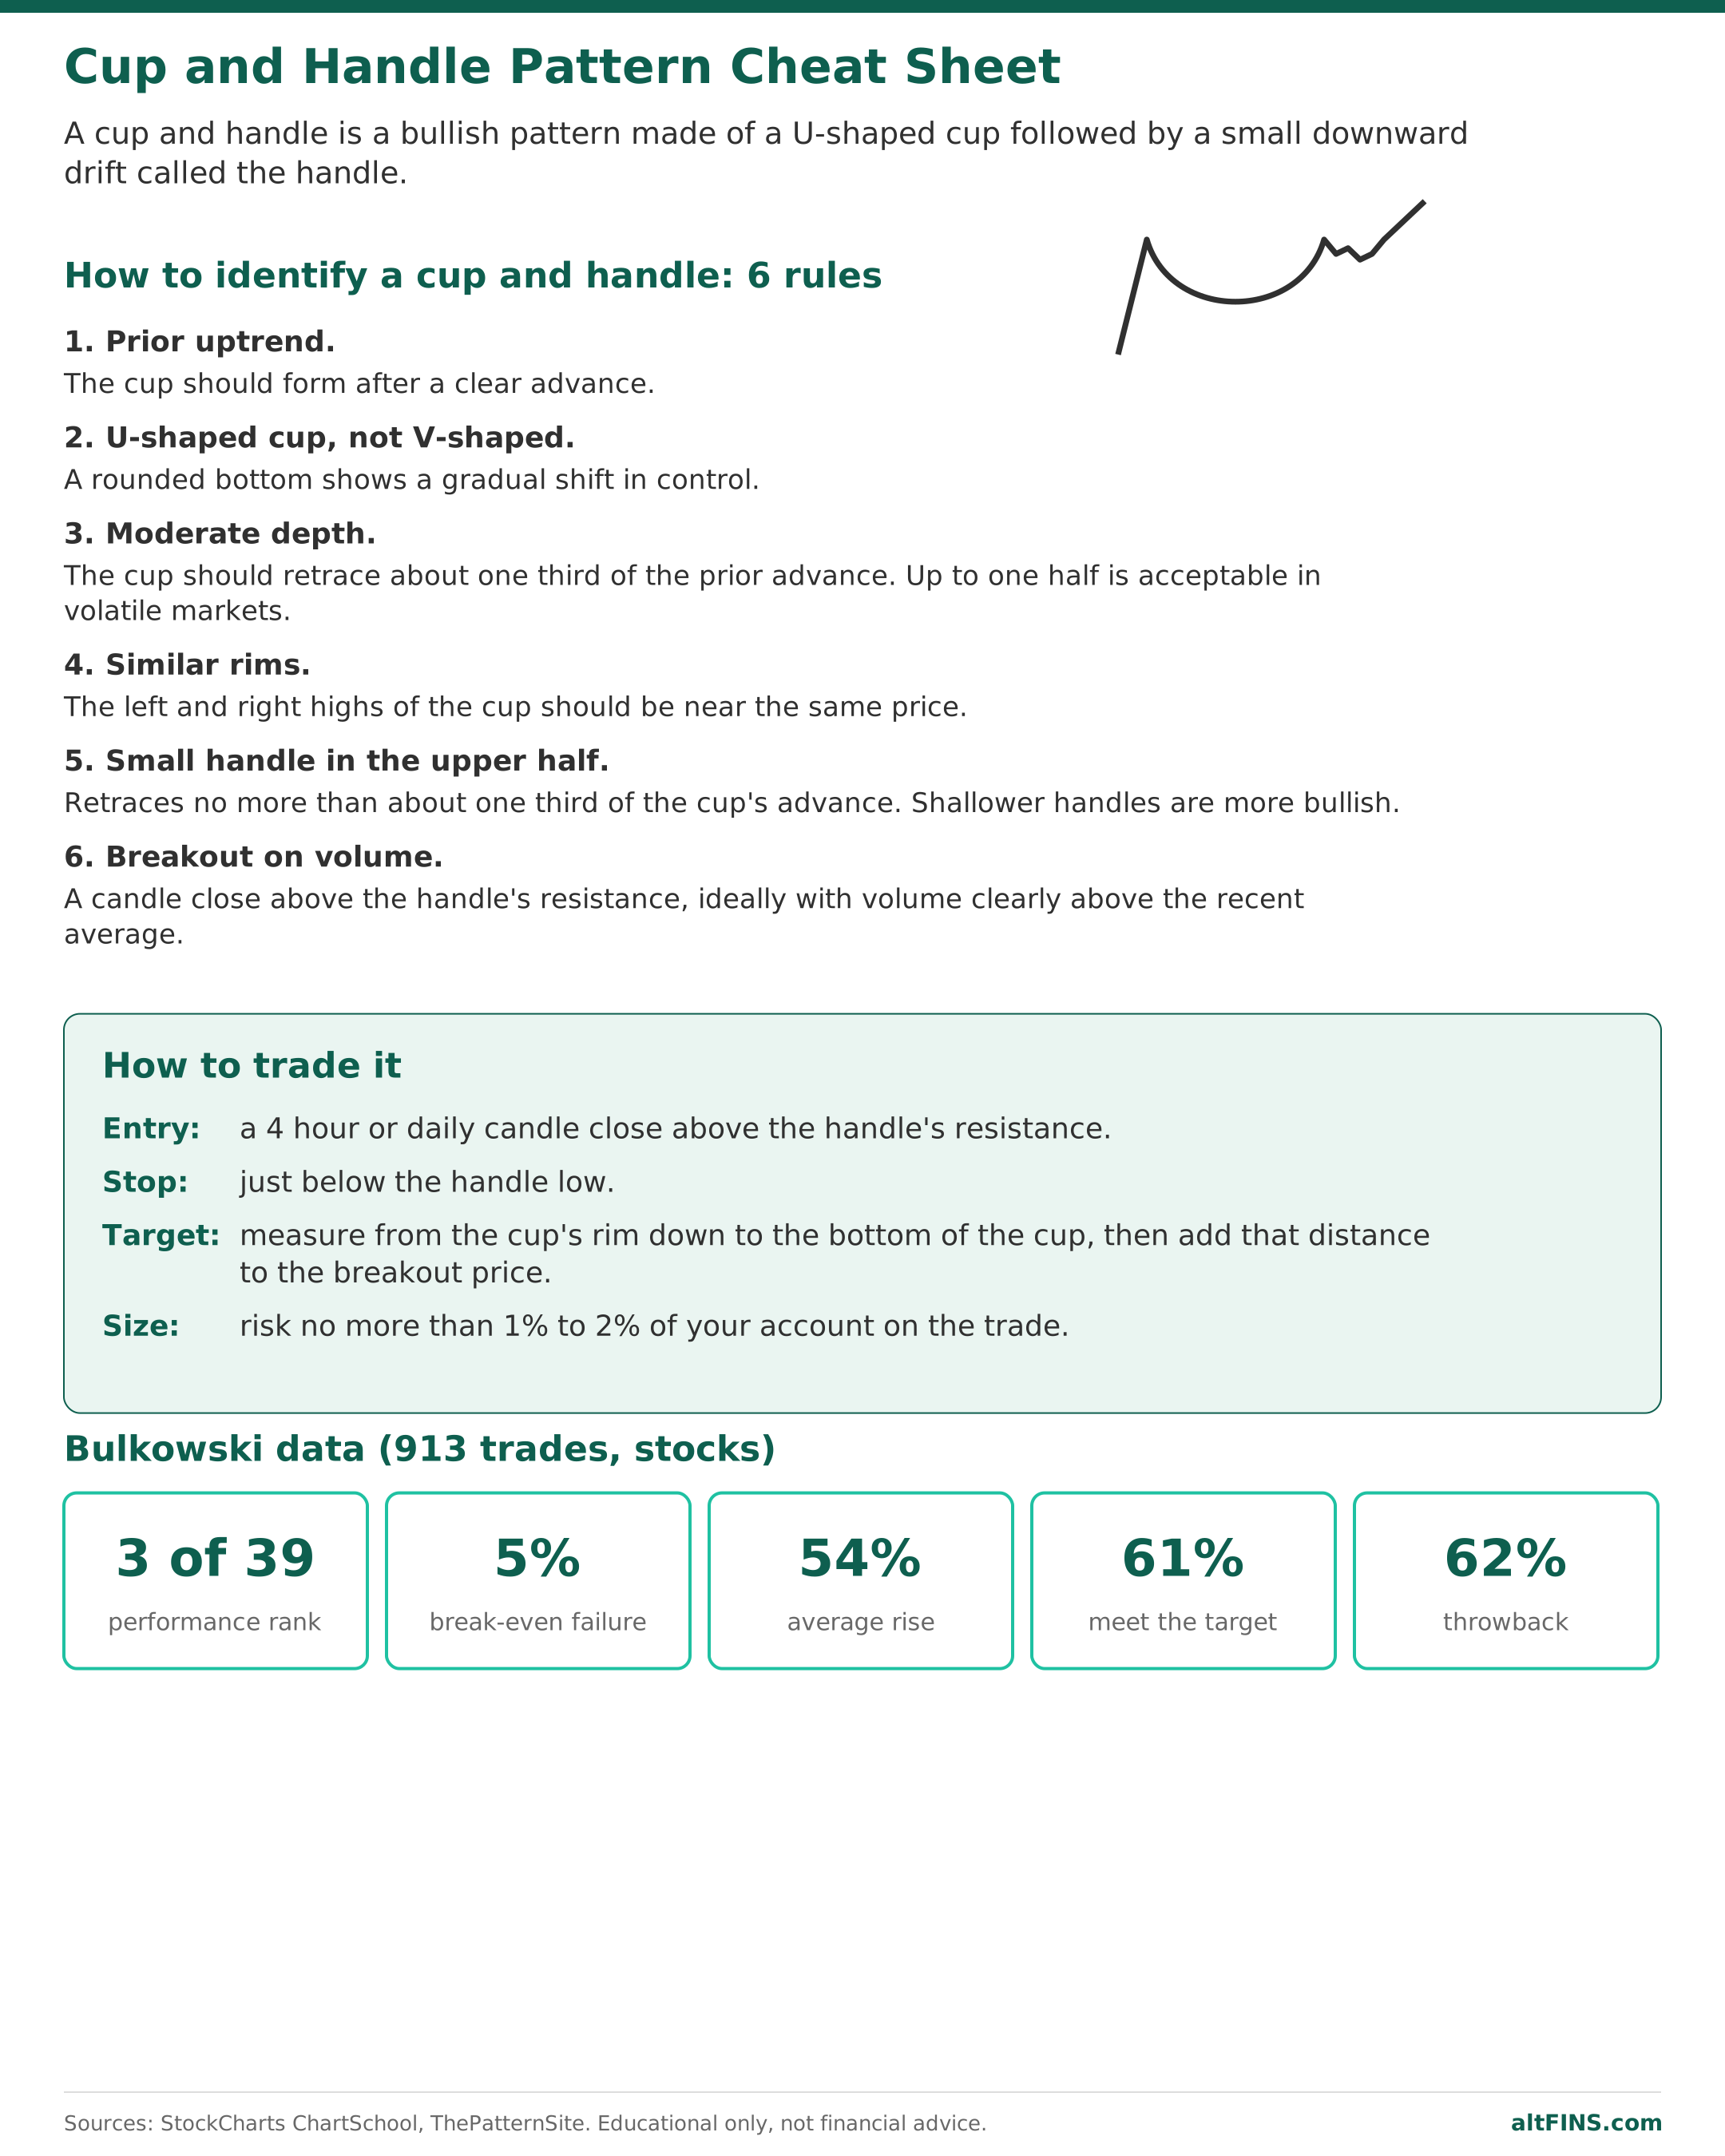
The most cited statistics come from Thomas Bulkowski’s study of 913 cup with handle trades at ThePatternSite, based on stock data:
| Statistic | Value |
|---|---|
| Performance rank | 3 out of 39 chart patterns |
| Break-even failure rate (fails to rise 5%) | 5% |
| Average rise after breakout | 54% |
| Price meets the measured target | 61% |
| Throwback to the breakout level | 62% |
Two practical points follow. First, the 62% throwback rate means price often returns to retest the breakout level, which gives patient traders a second entry. Second, Bulkowski found that handles shorter than the median of about 22 days performed better after the breakout. Crypto is more volatile than stocks, so treat these numbers as a guide, not a promise.
How to trade a cup and handle step by step
Takeaway: wait for the close above the handle, stop below the handle low, target the cup’s depth.
- Confirm the trend. Check that price was rising before the cup formed and that the higher timeframe trend is up.
- Mark the levels. Draw a horizontal line at the cup’s rims and a line along the top of the handle. The handle’s upper line is your trigger.
- Wait for the breakout close. Enter when a 4 hour or daily candle closes above the handle’s resistance. A wick through the level is not enough.
- Check volume. Breakout volume should be clearly above the recent average. Use the crypto volume tracker to spot unusual volume.
- Place the stop. Put it just below the handle low. If price closes back below the handle, the pattern has failed.
- Set the target. Measure from the cup’s rim down to the bottom of the cup, then add that distance to the breakout price. Take partial profit at the target and trail a stop on the rest.
- Size the position. Risk no more than 1% to 2% of your account on the trade. See our guide on taking profits in crypto.
Worked example (illustrative numbers)
Say an altcoin rallies to $2.00, pulls back in a rounded cup to $1.50, and climbs back to $2.00. It then drifts down to $1.85 in a small handle. The cup depth is $2.00 minus $1.50, which is $0.50.
- Entry: a daily close above the handle’s resistance, around $2.00.
- Stop: just below the handle low, around $1.83.
- Target: $2.00 plus $0.50, which is $2.50.
- Reward to risk: $0.50 of upside against about $0.17 of risk, roughly 3 to 1.
For a more conservative target, Bulkowski suggests multiplying the cup depth by 61% before adding it to the breakout price. In this example that gives about $2.31.
The inverse cup and handle
Takeaway: flip the pattern upside down and it becomes a bearish setup.
An inverse (upside-down) cup and handle forms after a decline. Price makes a rounded top, falls back to the old low, bounces slightly in a small handle, and then closes below the handle’s support. Traders use it to exit longs or open shorts, with a stop above the handle high and a target equal to the cup’s height subtracted from the breakdown price. The same rules about shape, handle size and volume apply in reverse.
Why cup and handle patterns fail in crypto
Takeaway: most failures come from a bad shape, a deep handle or a weak breakout.
- V-shaped cups: a sharp crash and rebound is not a slow shift in control, so it breaks down more often.
- Deep handles: a handle that falls into the lower half of the cup shows sellers are still strong.
- Low-volume breakouts: a breakout without a volume increase is easy to reverse, especially on thin altcoin order books.
- Fighting the market: a bullish pattern on one coin rarely survives a sharp drop in Bitcoin. Check the BTC trend first.
- Wicks, not closes: crypto often spikes through resistance intraday and falls back. Wait for the candle close.
Do’s and don’ts
Do: trade it only after a clear prior uptrend.
Do: wait for a 4 hour or daily close above the handle’s resistance.
Do: look for rising volume on the breakout and consider a retest entry.
Don’t: buy inside the handle in anticipation of the breakout.
Don’t: accept a V-shaped cup or a handle that falls into the lower half of the cup.
Don’t: trade without a stop below the handle low.
🛠️ How altFINS helps you trade cup and handle breakouts
A cup and handle ends in one event that altFINS tracks across 2,000+ coins: price breaking above a well-defined resistance level on strong volume.
- Crypto Screener: use the altFINS crypto screener to filter for coins in an uptrend that are trading near a new local high with unusual volume, the typical profile of a coin finishing its handle.
- Breakout signals: the Signals Summary lists fresh resistance breakouts, and our guide to crypto breakouts explains how to filter them.
- Chart pattern recognition: the altFINS Chart Patterns tool detects horizontal resistance levels and related continuation patterns such as ascending triangles and flags.
- Alerts: create a price alert at the handle’s resistance so you are notified the moment it breaks.
For every pattern altFINS covers, see Trading Patterns Explained.
Frequently asked questions
Is a cup and handle pattern bullish or bearish?
A standard cup and handle is bullish. It usually forms during an uptrend and signals that the trend is likely to continue after price closes above the handle’s resistance. The inverse cup and handle, which looks like the same shape turned upside down, is the bearish version and signals a likely move lower after a break of support.
How accurate is the cup and handle pattern?
It is one of the more reliable chart patterns. In Thomas Bulkowski’s study of 913 trades, it ranked 3rd of 39 patterns, only 5% of breakouts failed to rise at least 5%, and 61% reached the measured target. Results in crypto vary more because of higher volatility, so always use a stop below the handle low.
How do you calculate the cup and handle price target?
Measure the distance from the cup’s rim down to the lowest point of the cup. Add that distance to the breakout price at the top of the handle. For example, a cup from $2.00 down to $1.50 has a depth of $0.50, so a breakout at $2.00 targets $2.50. A more conservative approach uses 61% of the depth.
How long does a cup and handle pattern take to form?
On stock charts the cup usually takes one to six months and the handle one to four weeks. Crypto moves faster, so on a daily chart a valid cup often forms in a few weeks, and on a 4 hour chart in a few days. Bulkowski found handles shorter than about 22 days tended to perform better.
What happens after a cup and handle breakout?
Price usually continues higher toward the measured target. Bulkowski found price returns to retest the breakout level about 62% of the time before moving on, so a pullback right after the breakout is normal. If price closes back below the handle low, the pattern has failed and the trade should be closed.
Can a cup and handle pattern fail?
Yes. The most common reasons are a V-shaped cup, a handle that drops into the lower half of the cup, a breakout on weak volume, or a sharp drop in the wider crypto market. That is why traders wait for a candle close above resistance, check volume, and always place a stop below the handle low.
Conclusion
The cup and handle is one of the most dependable bullish continuation patterns, and its rules are simple: a U-shaped cup after an uptrend, a small handle in the upper half, and a closing breakout on rising volume. Keep your stop below the handle low, measure the target from the cup’s depth, and check the Bitcoin trend before you trade an altcoin setup.
Want to find coins breaking out of resistance right now? Try the altFINS Crypto Screener and filter 2,000+ coins for fresh breakouts on rising volume.
This article is for educational purposes only and does not constitute financial advice. Cryptocurrency trading involves significant risk, including the possible loss of your entire investment. Chart pattern statistics are historical and do not guarantee future results. The worked example uses illustrative numbers. Always do your own research and manage your risk.