

Search Knowledge Base by Keyword
The Morning Star Candlestick Pattern in Crypto Trading
The morning star is one of the most trusted bullish reversal signals in technical analysis, and it shows up on crypto charts just as often as it does on stocks or forex. If you have ever watched a coin bleed out for days, stall on a small indecisive candle, then explode higher, you have probably already seen one.
This guide is for crypto traders who want to spot the morning star pattern with confidence, tell it apart from lookalikes like the morning doji star and the bullish engulfing pattern, and trade it with a real entry, stop-loss, and confirmation plan instead of guessing.
You will get the exact formation rules, real reliability data, a comparison table against other reversal signals, and a step-by-step trading checklist built for crypto’s 24/7 market.
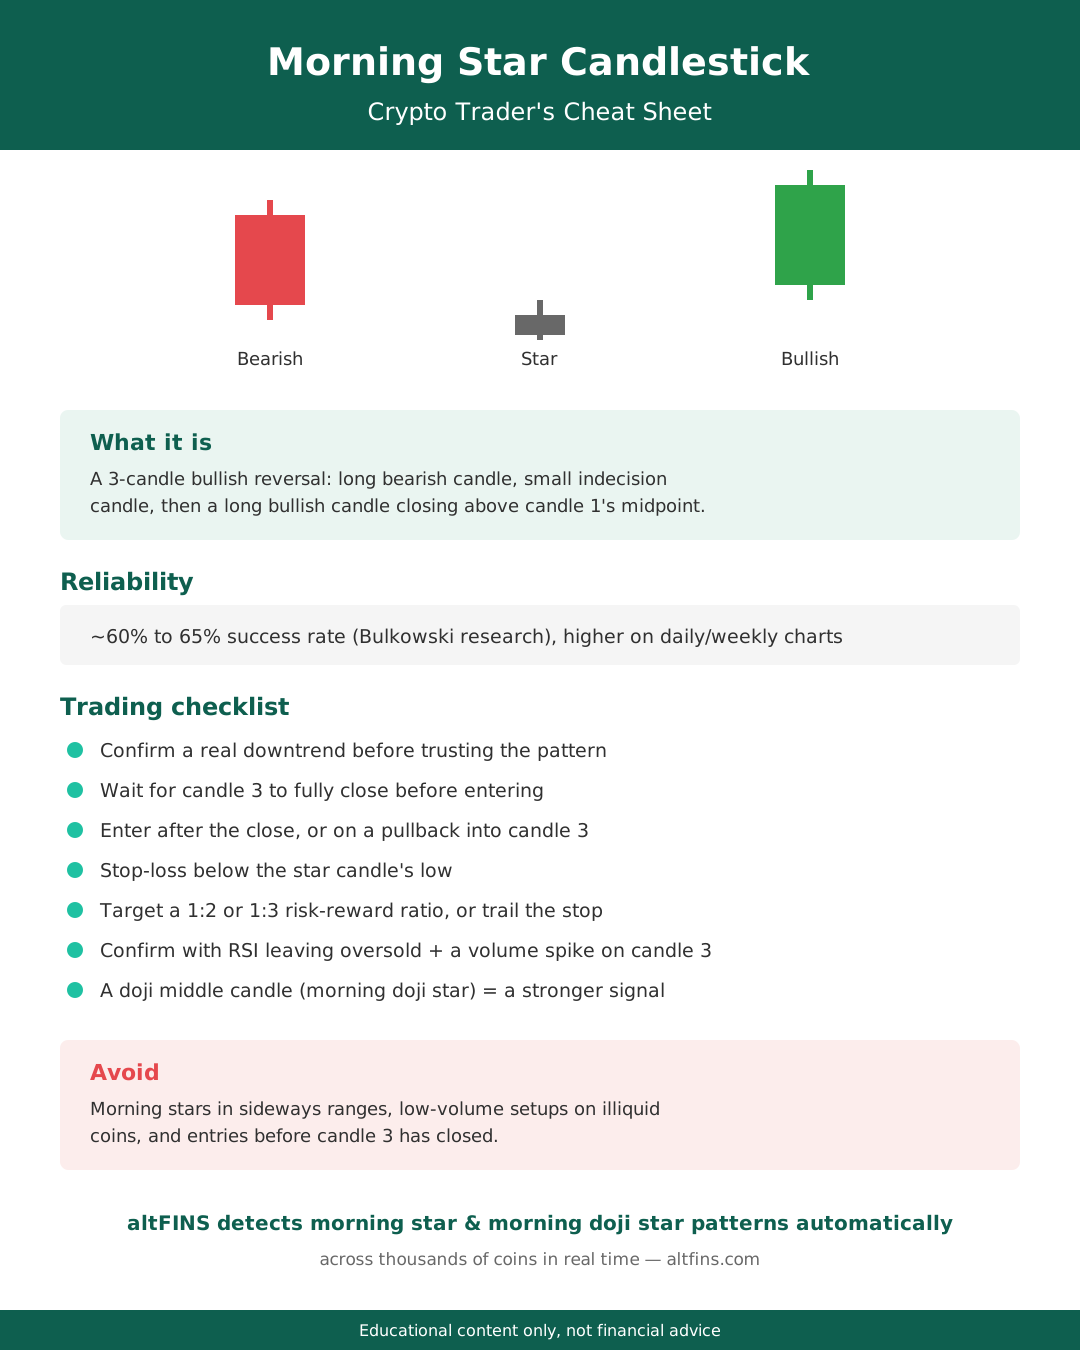
Quick answer: The morning star is a three-candle bullish reversal pattern that forms at the bottom of a downtrend: a long bearish candle, a small-bodied “star” candle that shows indecision, and a long bullish candle that closes back above the first candle’s midpoint. It signals sellers are losing control and buyers are stepping in. Backtesting cited in Thomas Bulkowski’s Encyclopedia of Candlestick Charts puts its success rate around 60% to 65%, and altFINS’ AI pattern scanner flags both the morning star and the stronger morning doji star variant automatically across thousands of coins.
What is the morning star candlestick pattern?
The morning star is a three-candle bullish reversal formation that appears after a sustained downtrend. It gets its name from astronomy: like the morning star that appears just before sunrise, this pattern shows up right before a market “wakes up” and reverses direction.
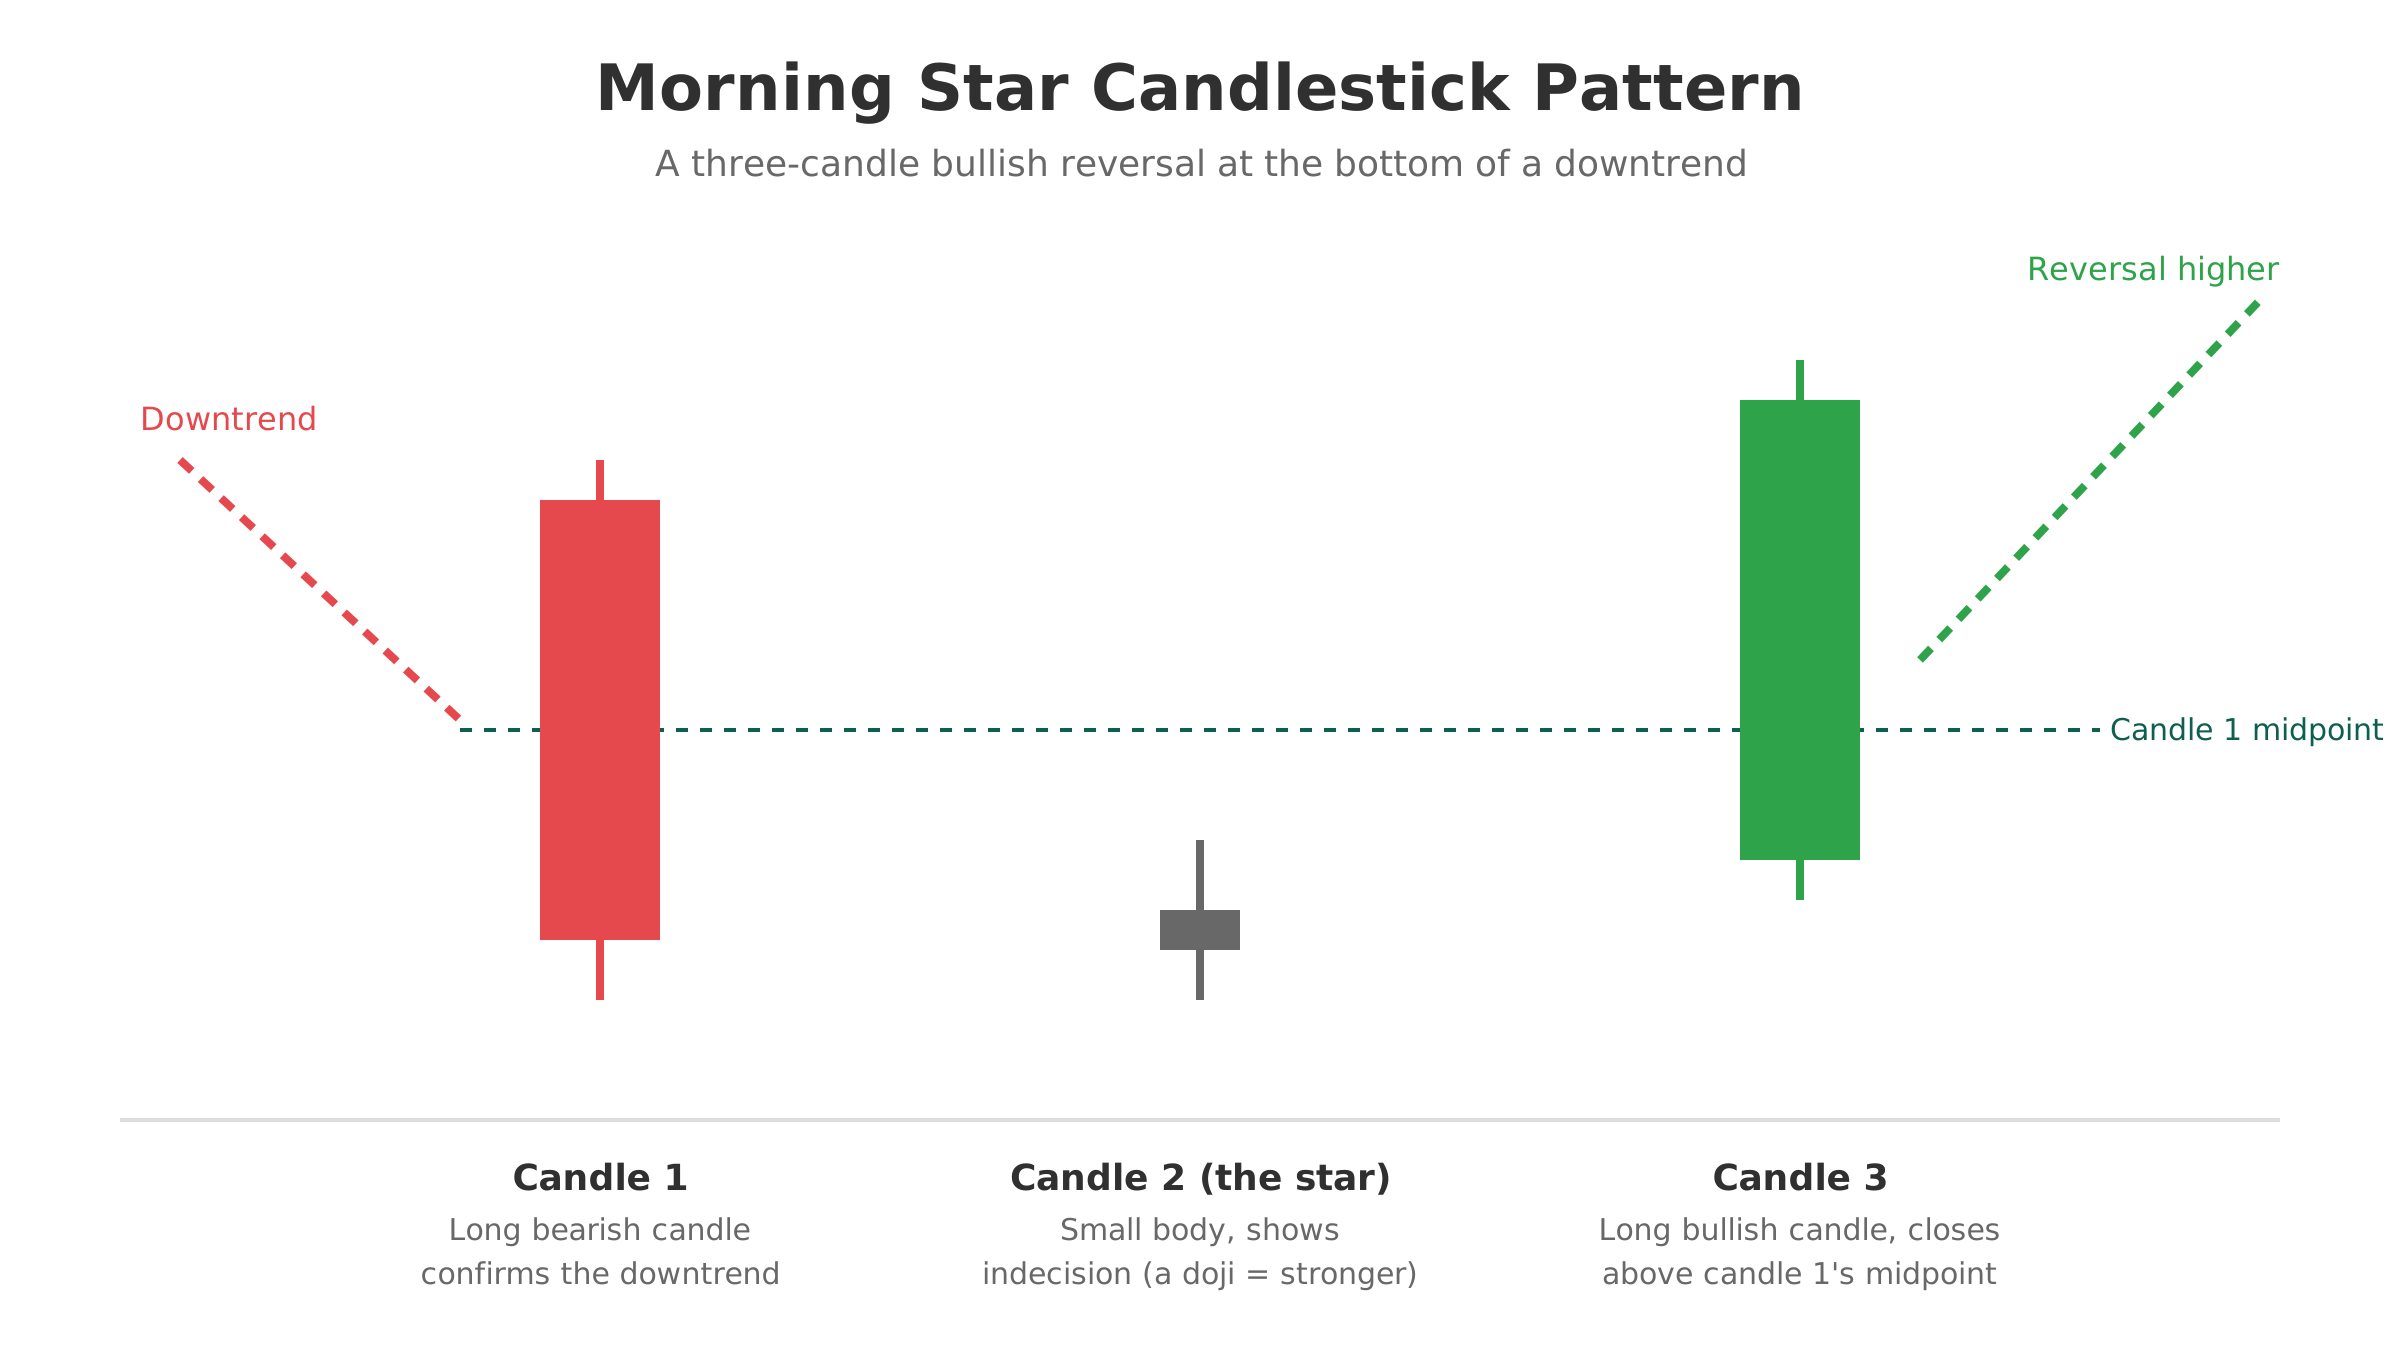
Each of the three candles plays a distinct role. The first candle confirms the downtrend is still in force. The second candle, the “star,” shows the selling pressure running out of steam. The third candle confirms that buyers have taken control. Together, the three candles tell a complete story of exhaustion, hesitation, and reversal, which is why traders treat the morning star as a higher-confidence signal than a single reversal candle like a hammer on its own.
How the morning star forms, candle by candle
Every valid morning star follows the same three-step structure. Miss one of these conditions and you are probably looking at a different pattern.
Candle 1: the long bearish candle
A long red candle that continues the existing downtrend. Strong selling volume here confirms that bears are still firmly in control heading into the second candle.
Candle 2: the star (indecision candle)
A small-bodied candle, red or green, that opens near or below the first candle’s close and struggles to make further downside progress. On traditional markets, this candle often gaps down; in crypto, which trades around the clock with no daily gaps, look instead for a sharp drop in range and volume compared to candle one. If this candle’s body compresses into a near-zero-width doji, the pattern becomes a morning doji star, a stronger version of the same signal.
Candle 3: the long bullish confirmation candle
A long green candle that closes at or above the midpoint of candle one’s body. This is the candle that confirms the reversal. The deeper it closes into candle one’s range, and the higher the volume behind it, the stronger the signal.
Morning star vs. morning doji star
The morning doji star is a variant where the middle candle is a true doji, meaning the open and close are nearly identical. This shows an even more extreme moment of indecision between buyers and sellers, which is why traders generally treat the morning doji star as a higher-probability setup than a standard morning star with a small-bodied (but not doji) second candle. Both patterns are read the same way and traded with the same rules; the doji version simply carries more weight as a signal.
How reliable is the morning star pattern?
Market technician Thomas Bulkowski’s widely cited candlestick research, published in the Encyclopedia of Candlestick Charts, puts the morning star’s overall success rate at roughly 60% to 65% in the correct market context: at the bottom of an established downtrend, not in the middle of a range. That is a solid edge, but it is far from a guarantee, which is exactly why confirmation and risk management matter.
Two factors move that number meaningfully in crypto:
- Timeframe. Higher timeframes (4-hour, daily, weekly) filter out noise and tend to produce more reliable morning stars than 5-minute or 15-minute charts, where random volatility can fake the shape of the pattern.
- Volume confirmation. Reversal patterns that break out on volume roughly 25% to 30% above the recent average have historically shown meaningfully higher follow-through than patterns that form on thin volume, where the “reversal” can fail and reverse straight back into the downtrend.
| Pattern | Candles | Signal | Typical success rate* |
|---|---|---|---|
| Morning star | 3 | Bullish reversal | 60% to 65% |
| Morning doji star | 3 | Bullish reversal (stronger) | Higher than standard morning star |
| Bullish engulfing | 2 | Bullish reversal | Moderate; less confirmation than morning star |
| Bullish harami | 2 | Bullish reversal (weaker) | Lower; considered less reliable |
| Hammer | 1 | Bullish reversal | Moderate; needs confirmation candle |
*Historical success rates vary by market, timeframe, and study methodology. Treat these as directional guides, not guarantees, and always confirm with volume and a follow-through candle before trading.
Morning star vs. evening star: opposite signals
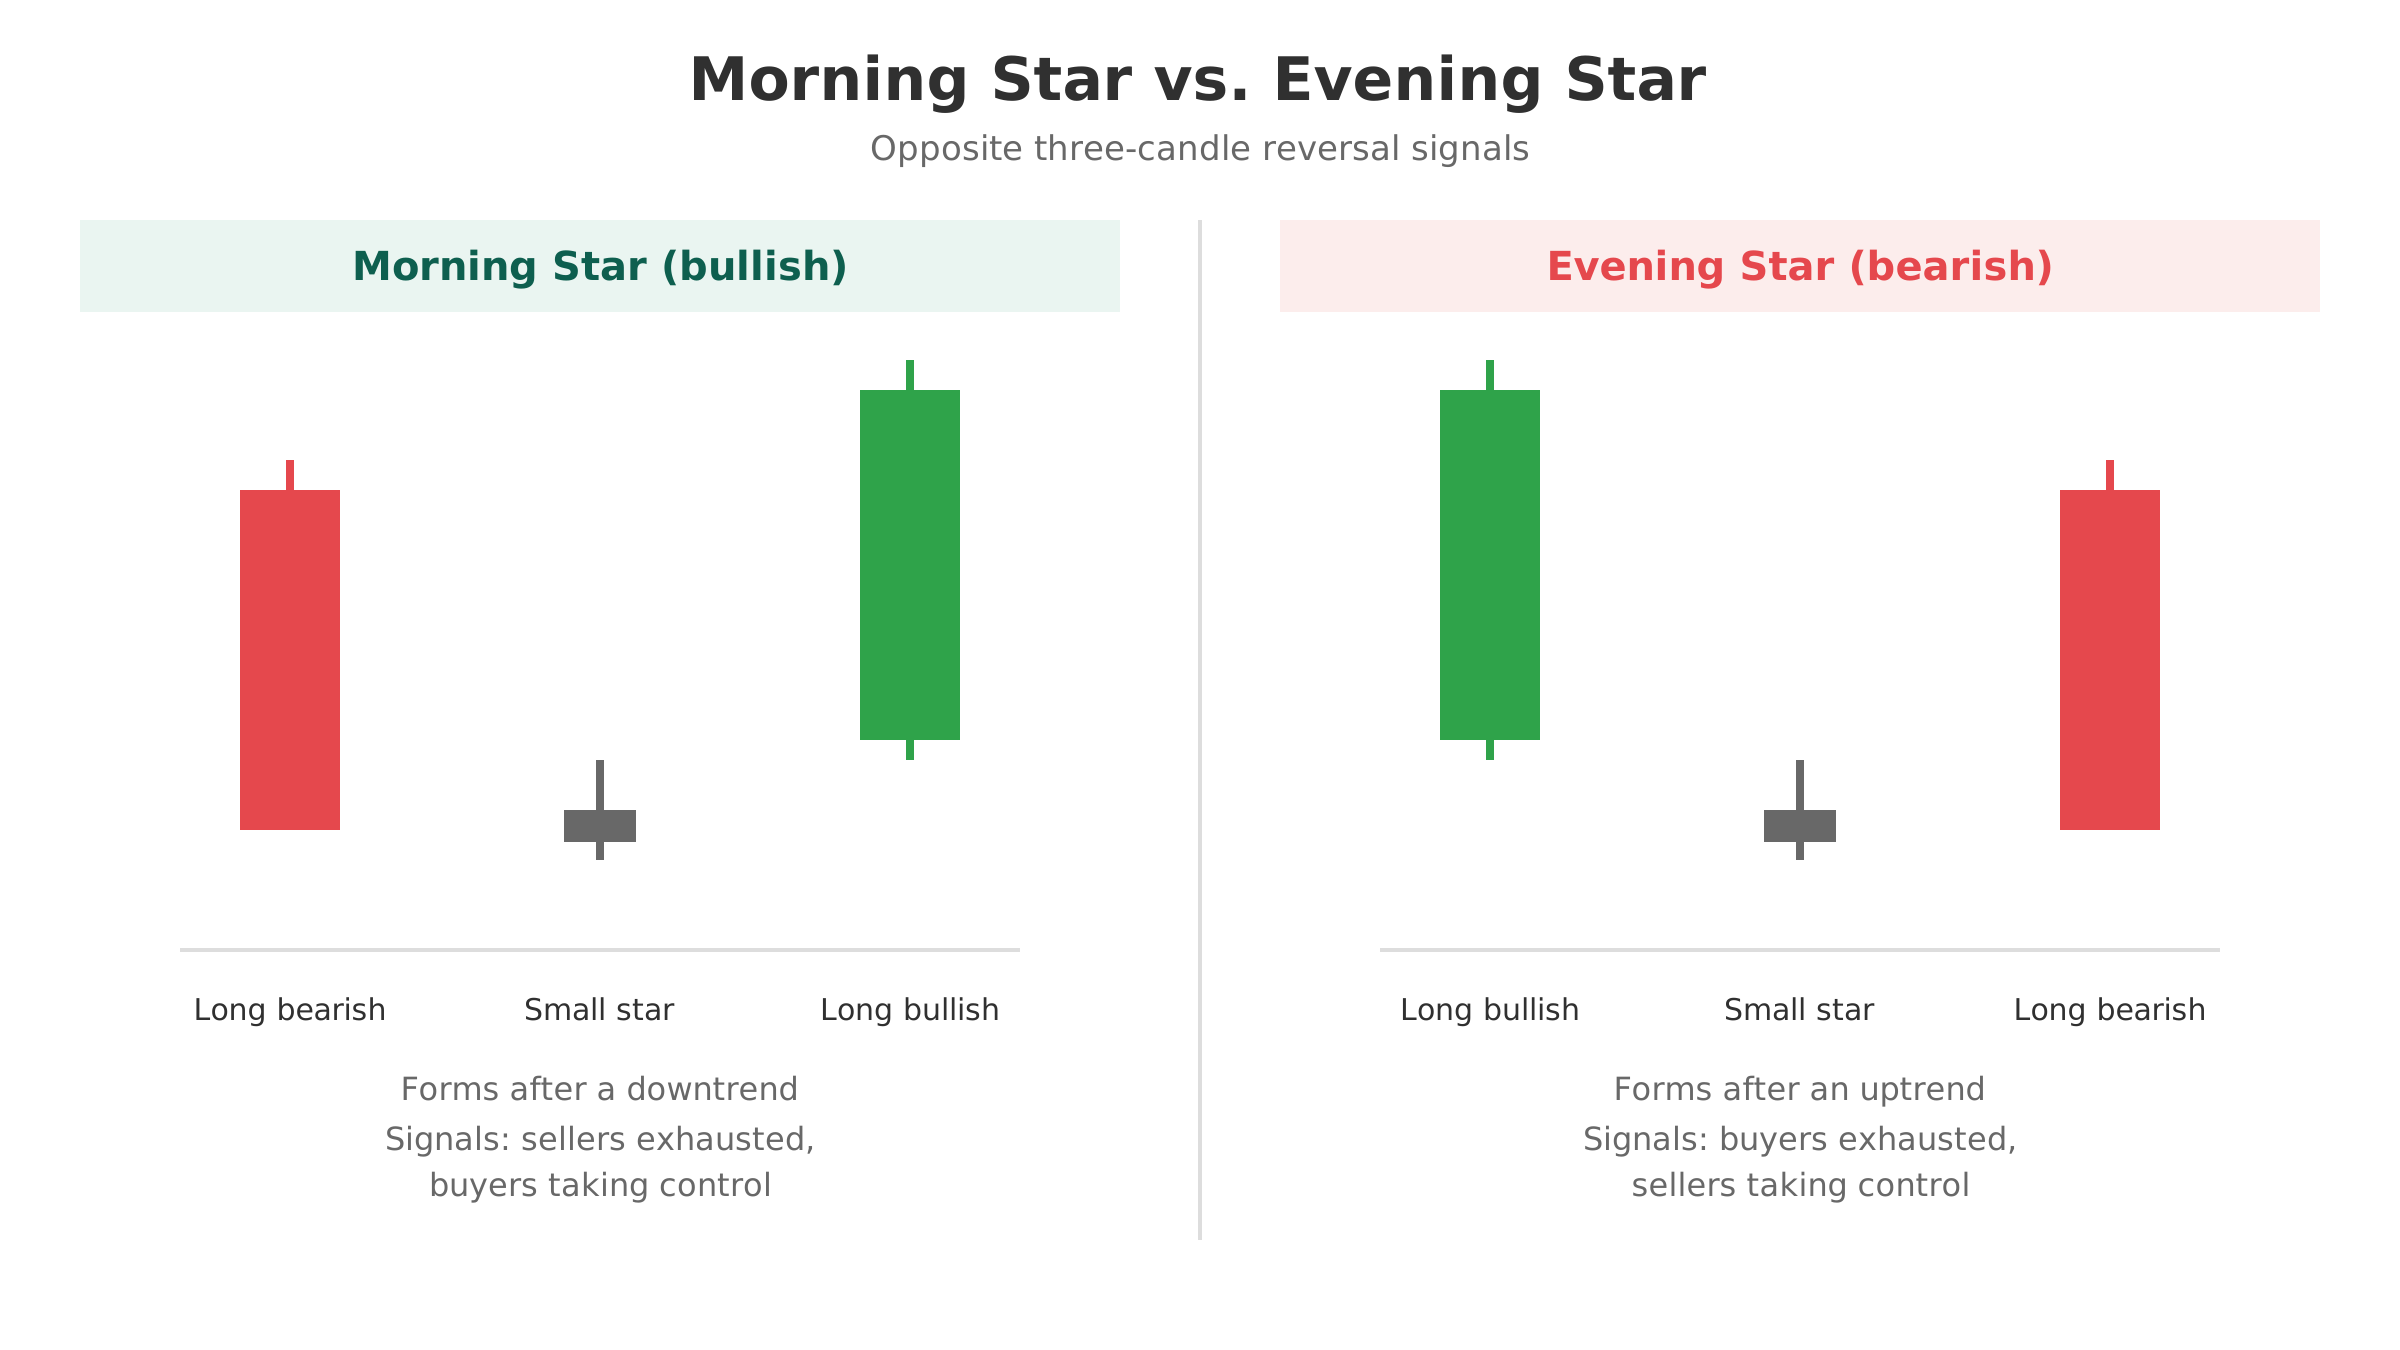
The evening star is the morning star’s bearish mirror image. It forms at the top of an uptrend: a long bullish candle, a small indecision candle, then a long bearish candle that closes back below the first candle’s midpoint. Where the morning star tells you sellers are exhausted, the evening star tells you buyers are exhausted. The evening star’s own indecision candle frequently takes the shape of a gravestone doji, just as the morning star’s can take the shape of a dragonfly-style doji at the bottom of the move. Learning to read one pattern makes the other much easier to spot.
How to trade the morning star pattern in crypto
Step 1: confirm the downtrend and wait for the third candle to close
The morning star only means something after a real downtrend, not in a sideways chop. Never act on the pattern before the third candle has fully closed; entering while it is still forming is one of the most common ways traders get faked out.
Step 2: set your entry
Most traders enter at the open of the candle after the third candle closes, or on a pullback toward the top of candle three if one occurs. Entering only after a clean close above candle one’s midpoint filters out weaker, incomplete patterns.
Step 3: place your stop-loss
A standard stop sits just below the low of the star (candle two), since that low represents the point where the reversal thesis is invalidated. Some traders use the low of the entire three-candle pattern instead for extra breathing room on volatile altcoins.
Step 4: set a take-profit or trail it
A common starting point is a 1:2 or 1:3 risk-reward ratio, targeting the nearest resistance or a prior swing high. Many traders scale out partial size at the first target and trail a stop under rising swing lows for the rest of the position using support and resistance levels as a guide.
Confirmation tools that pair well with the morning star
- RSI: Look for the RSI climbing out of oversold territory (below 30) as the third candle forms, or a bullish RSI divergence into the pattern.
- Volume: A volume spike on candle three, well above the 20-period average, is the single strongest confirmation signal for the pattern.
- Support zones: A morning star that forms right at a known support level or prior demand zone carries more weight than one forming in open space.
- Moving averages: A third candle that closes back above a key short-term moving average, such as the 20 or 50 EMA, adds an extra layer of trend confirmation.
Do’s and don’ts when trading the morning star
Do
- Wait for the third candle to fully close before entering.
- Prioritize morning stars that form at genuine support levels after an extended downtrend.
- Check volume on the third candle before trusting the signal.
- Use a hard stop-loss below the star candle’s low every time.
Don’t
- Don’t trade morning stars that appear in the middle of a sideways range with no real downtrend behind them.
- Don’t enter before the third candle closes just because the shape “looks right” intraday.
- Don’t ignore low-volume, thin-bodied versions of the pattern on illiquid, low-cap coins.
- Don’t treat the pattern as a standalone signal; always pair it with at least one confirmation tool.
How altFINS helps you catch morning star setups
Scanning thousands of charts by hand for a specific three-candle formation is not realistic, and crypto’s 24/7 market means new setups can appear at any hour. altFINS automatically detects both the morning star and the stronger morning doji star formation across the market in real time.
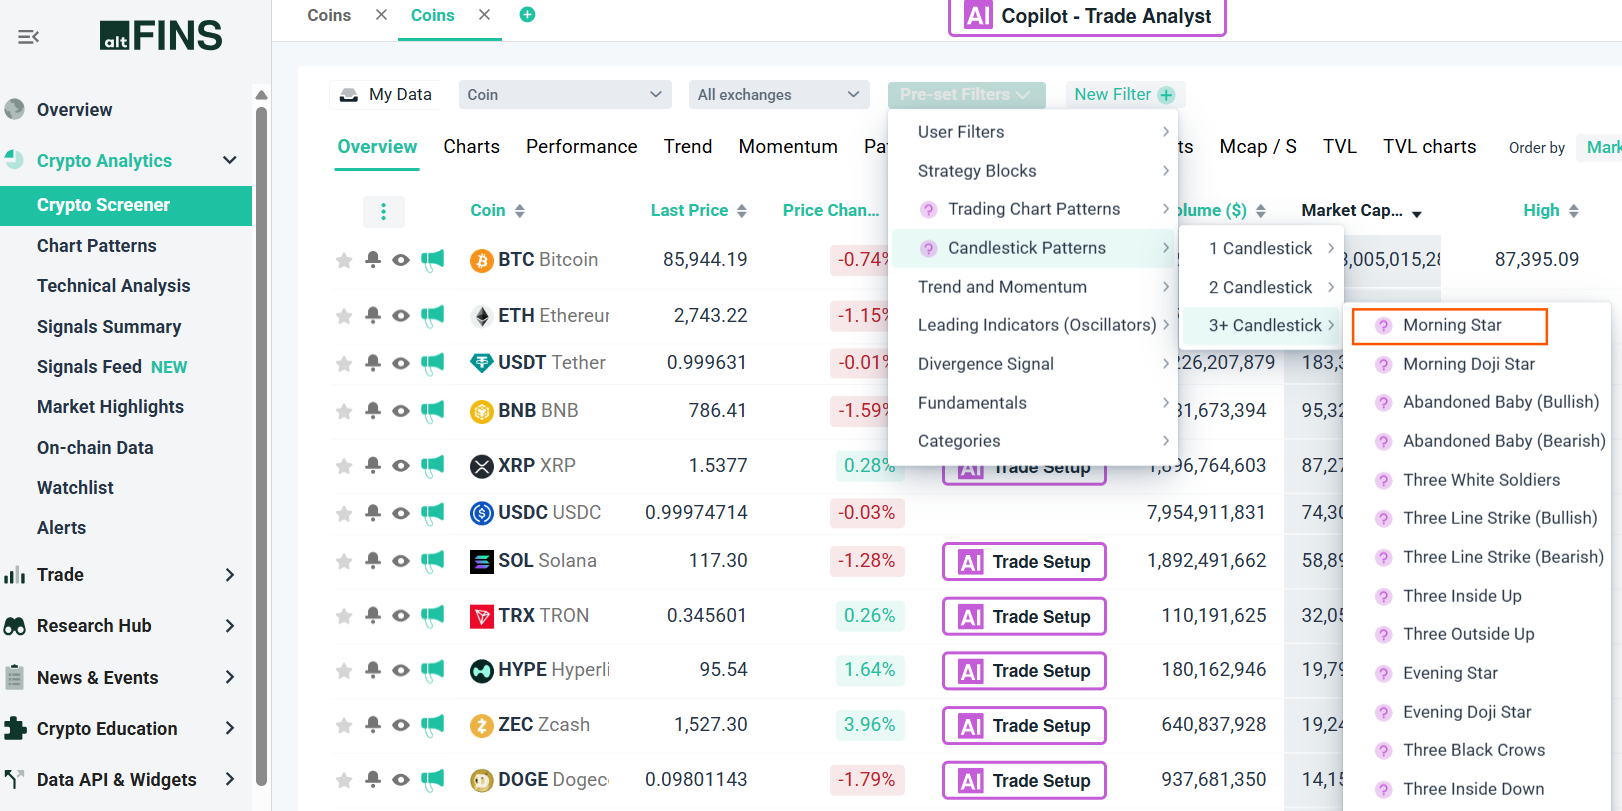
- Scan the full market with the crypto screener and filter specifically for morning star and morning doji star formations across multiple timeframes.
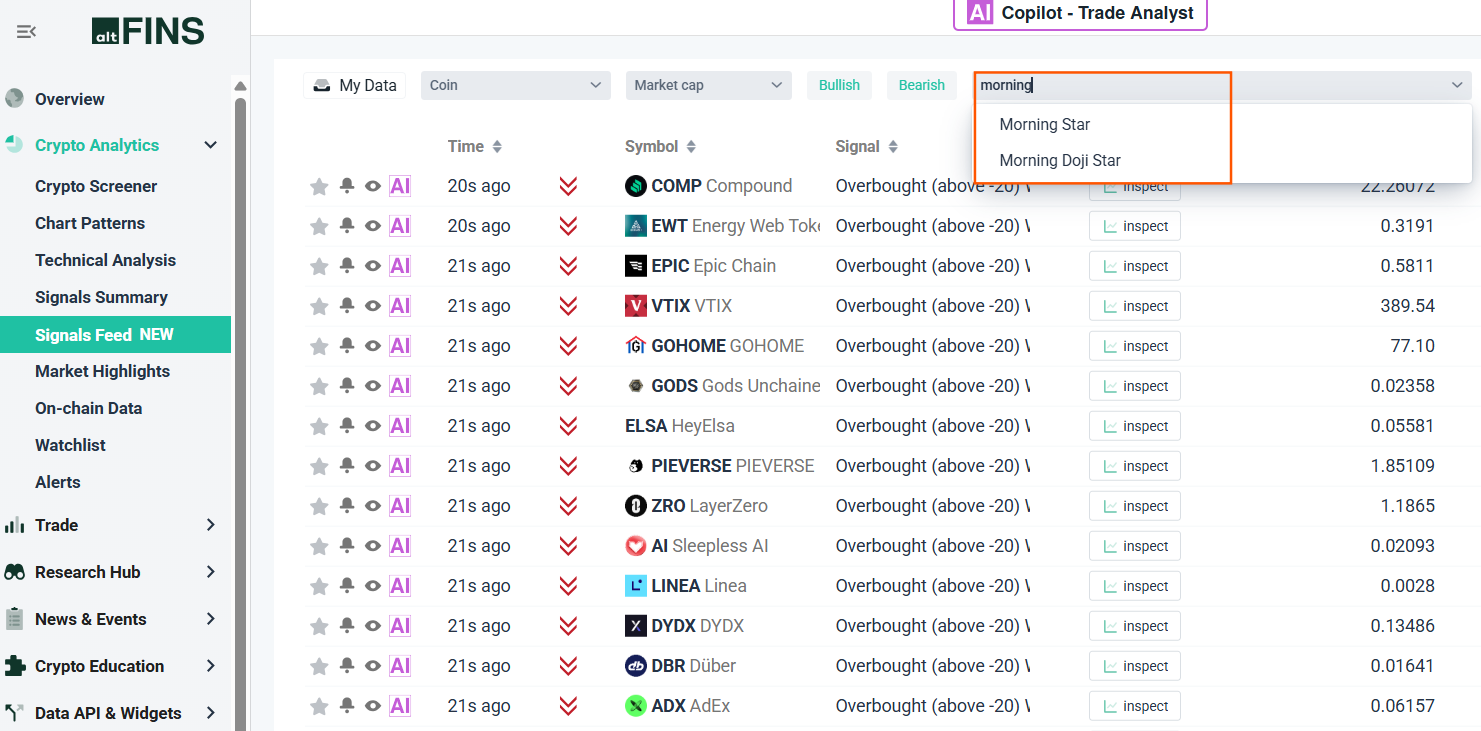
- Or filter morning star candlestick on signals feed.
- Stack the pattern filter with RSI, volume, and support-zone conditions to cut out low-quality signals before you ever open a chart.
- Set up custom alerts so you get notified the moment a morning star confirms on a coin you are tracking, instead of checking charts manually.
- Cross-check any pattern hit against the signals summary for broader trend and momentum context before you size a position.
Frequently asked questions
Is the morning star candlestick pattern bullish or bearish?
The morning star is a bullish reversal pattern. It appears at the bottom of a downtrend and signals that sellers are running out of momentum while buyers are stepping in. Its bearish mirror image, formed at the top of an uptrend, is called the evening star.
How reliable is the morning star pattern in crypto trading?
Historical research puts the pattern’s success rate around 60% to 65% in the right context: after an established downtrend, on a higher timeframe, and confirmed by strong volume on the third candle. On its own, without confirmation, reliability drops noticeably, especially on volatile low-cap coins.
What is the difference between a morning star and an evening star?
The morning star is a bullish reversal that forms at the bottom of a downtrend, while the evening star is its bearish opposite, forming at the top of an uptrend. Both use the same three-candle structure: a strong trend candle, a small indecision candle, and a strong confirmation candle in the opposite direction.
What is a morning doji star, and is it more reliable?
A morning doji star is a morning star where the middle candle is a true doji, with an open and close that are nearly identical. Because a doji reflects extreme indecision between buyers and sellers, traders generally treat the morning doji star as a stronger, higher-confidence version of the standard morning star.
What time frame works best for trading the morning star in crypto?
Higher timeframes such as the 4-hour, daily, and weekly charts tend to produce more reliable morning stars because they filter out short-term noise. Lower timeframes like the 5-minute or 15-minute chart can display the same shape purely from random volatility, so treat those signals with extra caution.
Do you need a confirmation candle after the morning star pattern?
The morning star is already a three-candle pattern, and the third candle itself acts as the confirmation. Many traders still wait for the following candle to hold above the pattern’s low, or look for supporting signals from RSI or volume, before committing full position size.
Verdict: is the morning star worth trading in crypto?
The morning star earns its reputation as one of the more dependable bullish reversal signals because it requires three separate pieces of evidence, exhaustion, indecision, and confirmation, before it completes. That structure filters out a lot of the noise that trips up traders who react to a single candle. Used on higher timeframes, at real support levels, and backed by volume and RSI confirmation, it is a legitimate addition to a crypto trader’s reversal toolkit. Used casually on low timeframes with no confirmation, it is just as likely to fail as any other pattern.
Ready to stop scanning charts manually? Open the altFINS crypto screener and filter the entire market for live morning star and morning doji star setups in seconds.
This article is for educational purposes only and is not financial advice. Cryptocurrency trading involves substantial risk of loss, and past pattern performance does not guarantee future results. Always do your own research and consider your risk tolerance before trading.
