

Search Knowledge Base by Keyword
RSI vs MACD: Which One Wins for Crypto Trading?
RSI and MACD are the two most used momentum indicators in crypto trading, and they answer two different questions. RSI (Relative Strength Index) tells you whether a coin is overbought or oversold right now. MACD (Moving Average Convergence Divergence) tells you whether the trend behind that move is gaining or losing strength.
Neither indicator is “better” in every situation. RSI reacts faster and works well in range-bound markets, while MACD is slower but more reliable for catching the start of a new trend. Most experienced crypto traders do not choose one over the other, they use both together and let each one confirm the other.
This guide breaks down exactly how RSI and MACD work, when each one performs best in crypto markets, and how to combine them into a simple, repeatable entry rule, updated for September 2026.
Quick answer: RSI is a bounded oscillator (0 to 100) that flags overbought conditions above 70 and oversold conditions below 30, making it best for range-bound crypto markets and short-term reversals. MACD tracks the gap between a 12-period and 26-period EMA to show trend direction and momentum, making it best for catching and riding new trends. Use RSI to time entries and MACD to confirm the trend is still intact, not one instead of the other.
What is RSI? A 10-second recap
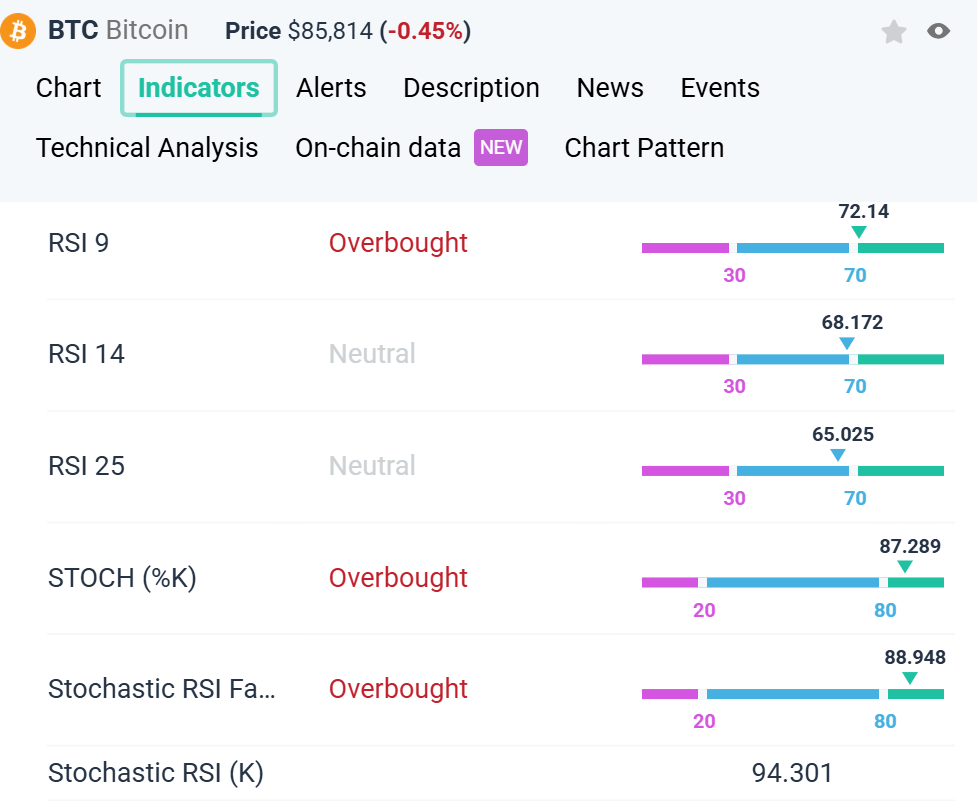
RSI, short for Relative Strength Index, was developed by J. Welles Wilder in 1978 and remains one of the most widely used technical analysis tools in crypto trading. It is a momentum oscillator that moves between 0 and 100 based on the size and speed of recent price changes.
- Standard setting: 14-period RSI, calculated on whatever candle timeframe you are viewing (1h, 4h, 1d).
- Above 70 is generally considered overbought, meaning the asset may be due for a pullback.
- Below 30 is generally considered oversold, meaning the asset may be due for a bounce.
- RSI crossing above or below the 50 midline is often read as a shift in short-term momentum.
For a full breakdown of RSI trading strategies and how to spot divergence, see altFINS’s guide to Trading RSI and RSI Divergence.
Check out RSI indicators for 2,000+ assets on altFINS screener.
What is MACD? A 10-second recap
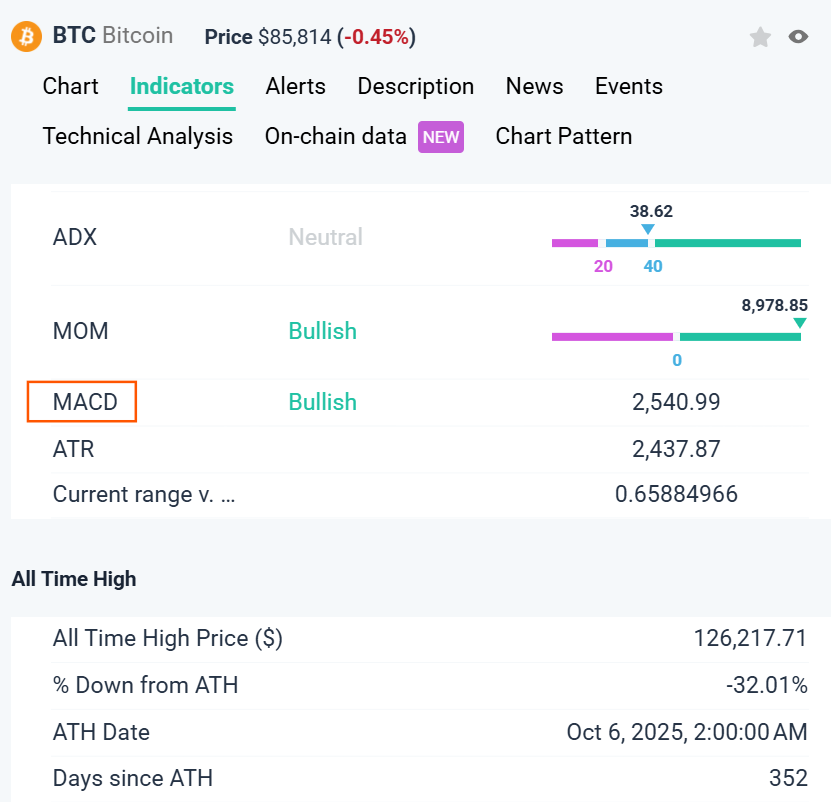
MACD, short for Moving Average Convergence Divergence, was developed by Gerald Appel in the late 1970s. It is a trend-following momentum indicator built from three parts: the MACD line, the signal line, and the histogram.
- Standard setting: 12, 26, 9, meaning a 12-period EMA minus a 26-period EMA forms the MACD line, and a 9-period EMA of that line forms the signal line.
- A bullish crossover happens when the MACD line crosses above the signal line.
- A bearish crossover happens when the MACD line crosses below the signal line.
- The histogram shows the gap between the two lines, so a growing histogram means momentum is accelerating.
For the full mechanics of each component, see altFINS’s guide to the MACD Line, Signal Line and Histogram.
RSI vs MACD: key differences at a glance
Takeaway: RSI is a faster, bounded oscillator built for timing entries; MACD is a slower, trend-following tool built for confirming direction.
| Factor | RSI | MACD |
|---|---|---|
| What it measures | Speed and size of recent price moves | Relationship between two EMAs (trend momentum) |
| Indicator type | Bounded oscillator (0 to 100) | Unbounded, trend-following |
| Best market condition | Range-bound or choppy markets | Trending markets |
| Signal speed | Faster, more reactive | Slower, lags behind price |
| Default settings | 14-period | 12, 26, 9 |
| Main signal | Overbought (70+) / oversold (30 or below) | Bullish or bearish line crossover |
| Divergence use | Strong, widely used for reversal signals | Also usable, but less common than RSI divergence |
| Weakness | Can stay overbought or oversold for a long time in strong trends | Lags, so entries can come late |
When RSI works better
Takeaway: RSI shines when a coin is chopping sideways rather than trending.
Crypto markets spend a large part of their time consolidating between clear support and resistance levels. In those conditions, RSI’s overbought and oversold readings tend to line up well with the top and bottom of the range, since the same 30 and 70 levels keep marking turning points. RSI is also the faster of the two indicators, which makes it useful for short-term traders looking to time entries on lower timeframes such as the 15 minute or 1 hour chart. See altFINS’s guide to support and resistance in crypto trading for how to combine RSI with key levels.
When MACD works better
Takeaway: MACD earns its keep once a trend is underway, not before.
Because MACD is built from two EMAs, it is slower to react but much better at confirming that a trend has real staying power. During strong bull or bear moves, RSI can stay pinned above 70 or below 30 for days, which makes it a poor exit signal on its own. MACD crossovers and histogram expansion give a clearer picture of whether momentum is still building or starting to fade, which is why swing traders often lean on MACD once a breakout is confirmed. altFINS’s chart pattern recognition engine can flag the breakout itself, while MACD helps confirm the follow-through.
Can you use RSI and MACD together?
Takeaway: yes, and most experienced traders do exactly this rather than picking one.
RSI and MACD measure different things, so pairing them reduces the number of false signals either one throws off on its own. A simple, repeatable combined rule looks like this:
A basic combined entry rule
- Wait for MACD to cross bullish (MACD line above signal line) to confirm the broader trend has turned up.
- Check that RSI is above 50 but not yet above 70, so momentum is present but the move is not already overextended.
- Look for a supporting signal, such as price reclaiming a support and resistance level or a bullish candlestick pattern, before entering.
- Use the opposite conditions, MACD bearish cross plus RSI below 50, for short setups or exits.
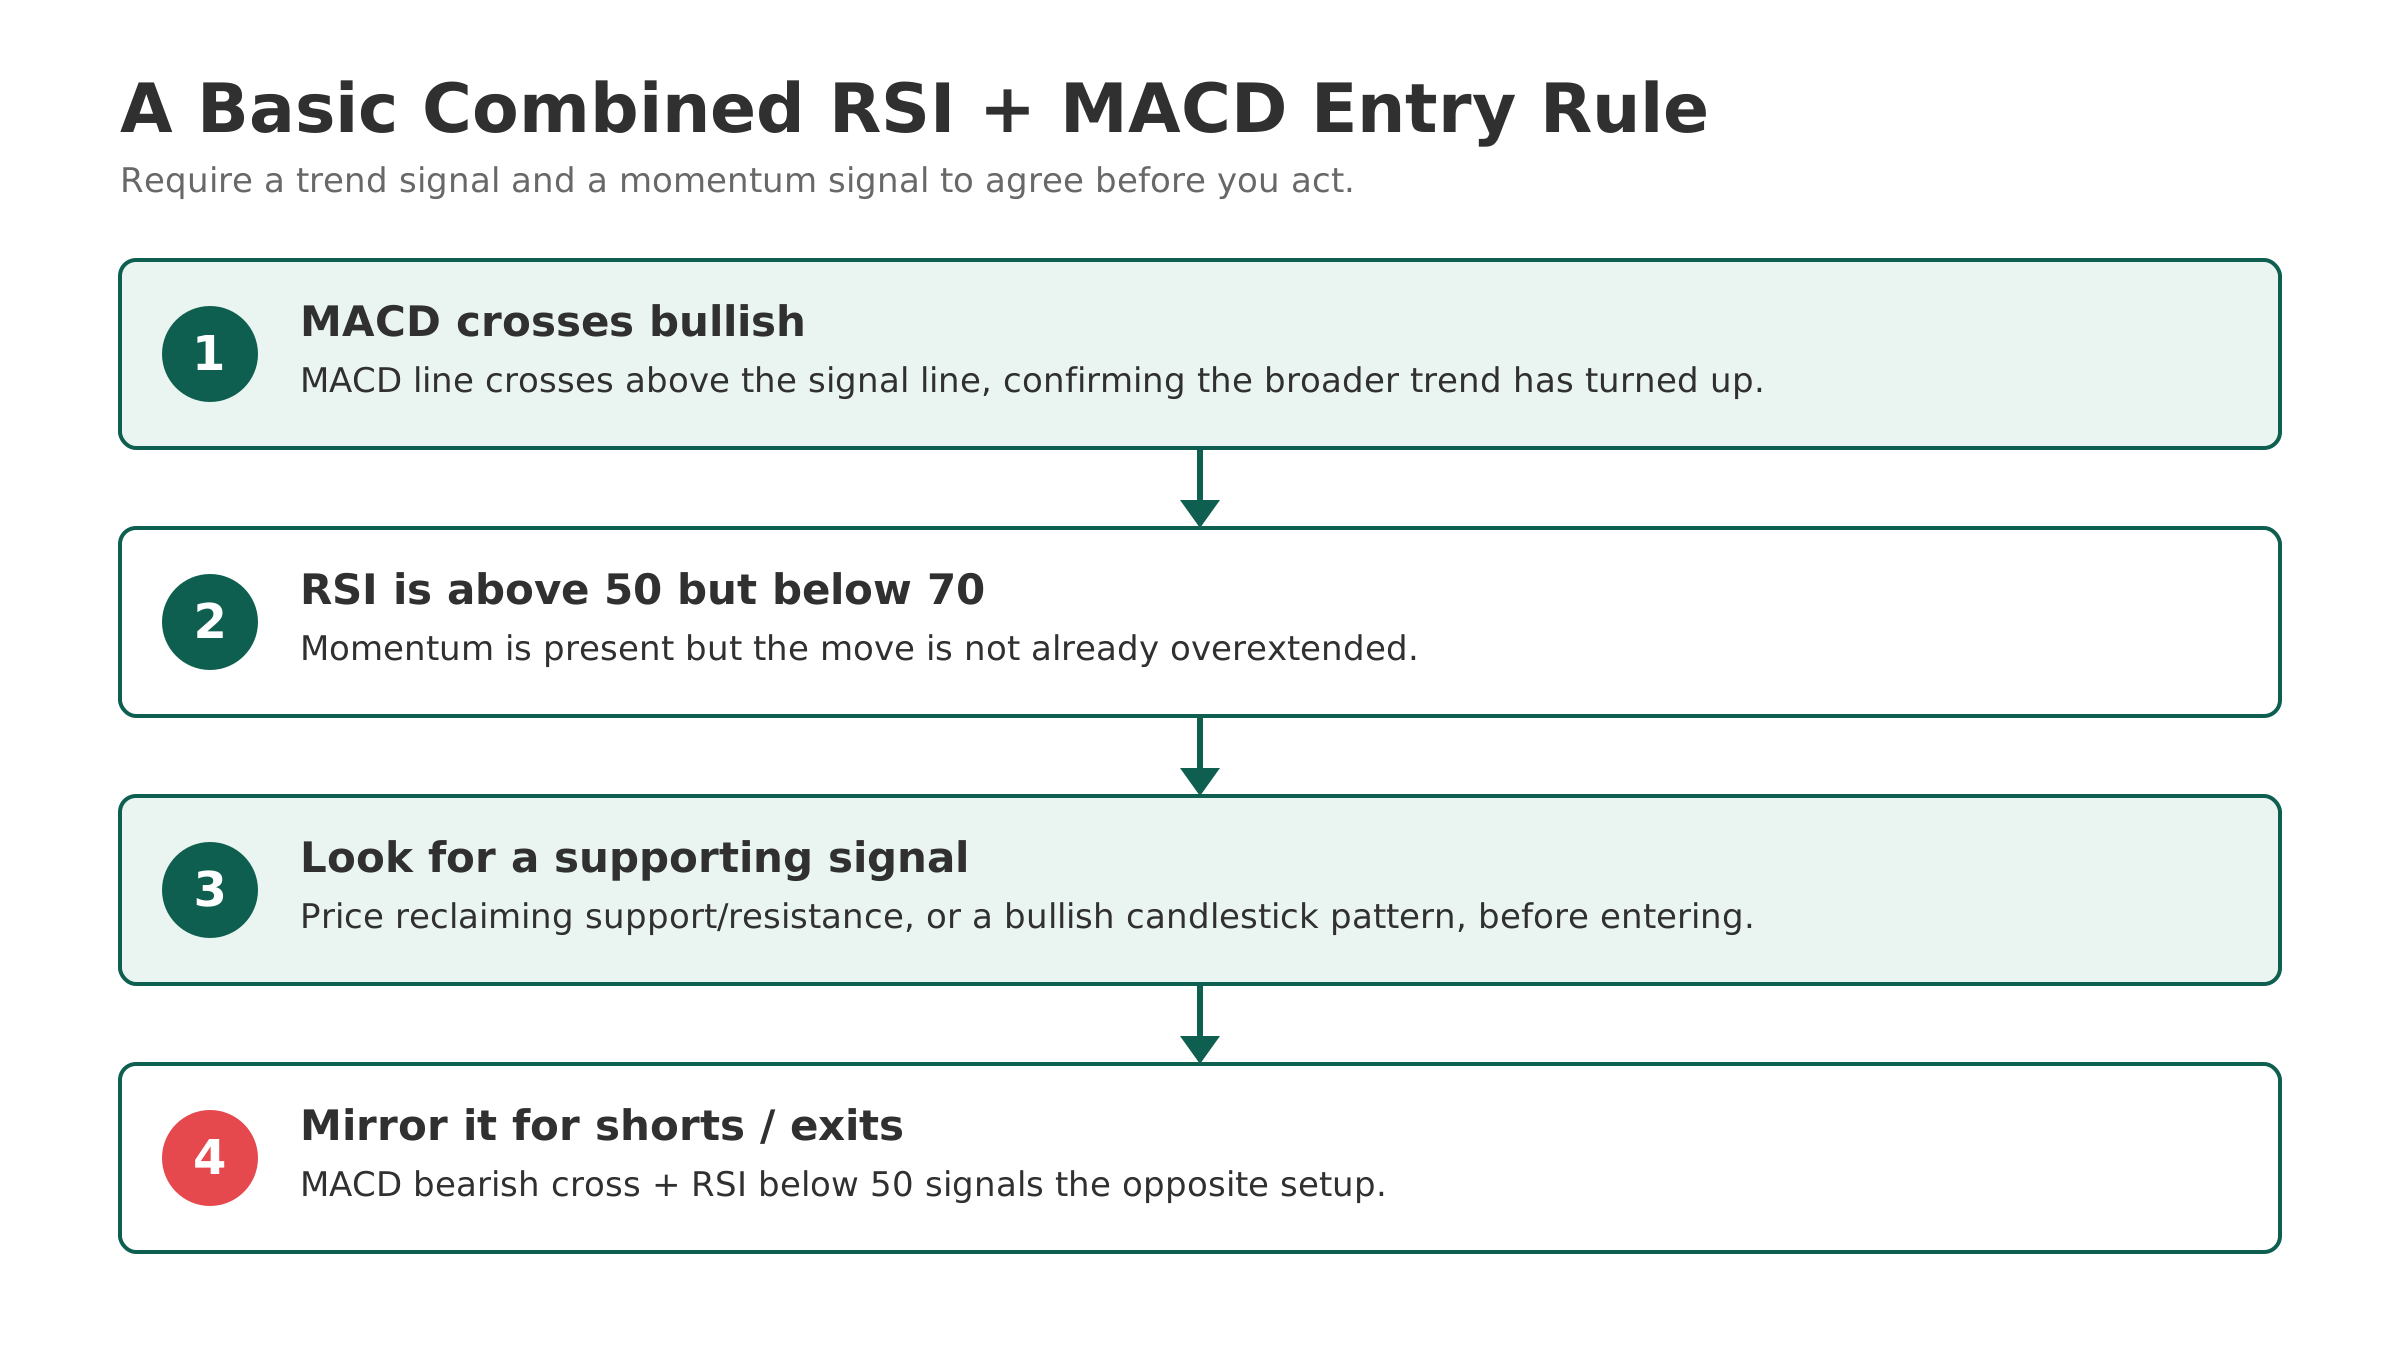
This is not a guaranteed formula, but it forces both a trend signal and a momentum signal to agree before you act, which filters out a large share of low-quality setups.
RSI vs MACD: do’s and don’ts
Do: Use RSI to time entries in range-bound markets and MACD to confirm the trend before you hold through a pullback.
Do: Check both indicators on a higher timeframe before acting on a lower timeframe signal.
Don’t: Treat RSI above 70 as an automatic sell signal in a strong uptrend, it can stay overbought for a long stretch.
Don’t: Chase every MACD crossover on a 15 minute chart, the indicator lags and produces more noise on lower timeframes.
Common mistakes traders make with RSI and MACD
Takeaway: most losing trades come from using either indicator in the wrong market condition, not from the indicator itself.
- Using RSI overbought and oversold levels as standalone sell and buy signals during a strong trend.
- Ignoring volume when a MACD crossover fires, a crossover on thin volume is far weaker than one backed by a volume spike.
- Applying the same settings across every timeframe without adjusting for how noisy a lower timeframe can be.
- Trading RSI or MACD divergence signals in isolation without a confirming candlestick pattern or support and resistance level.
🛠️ How altFINS helps you trade RSI and MACD signals
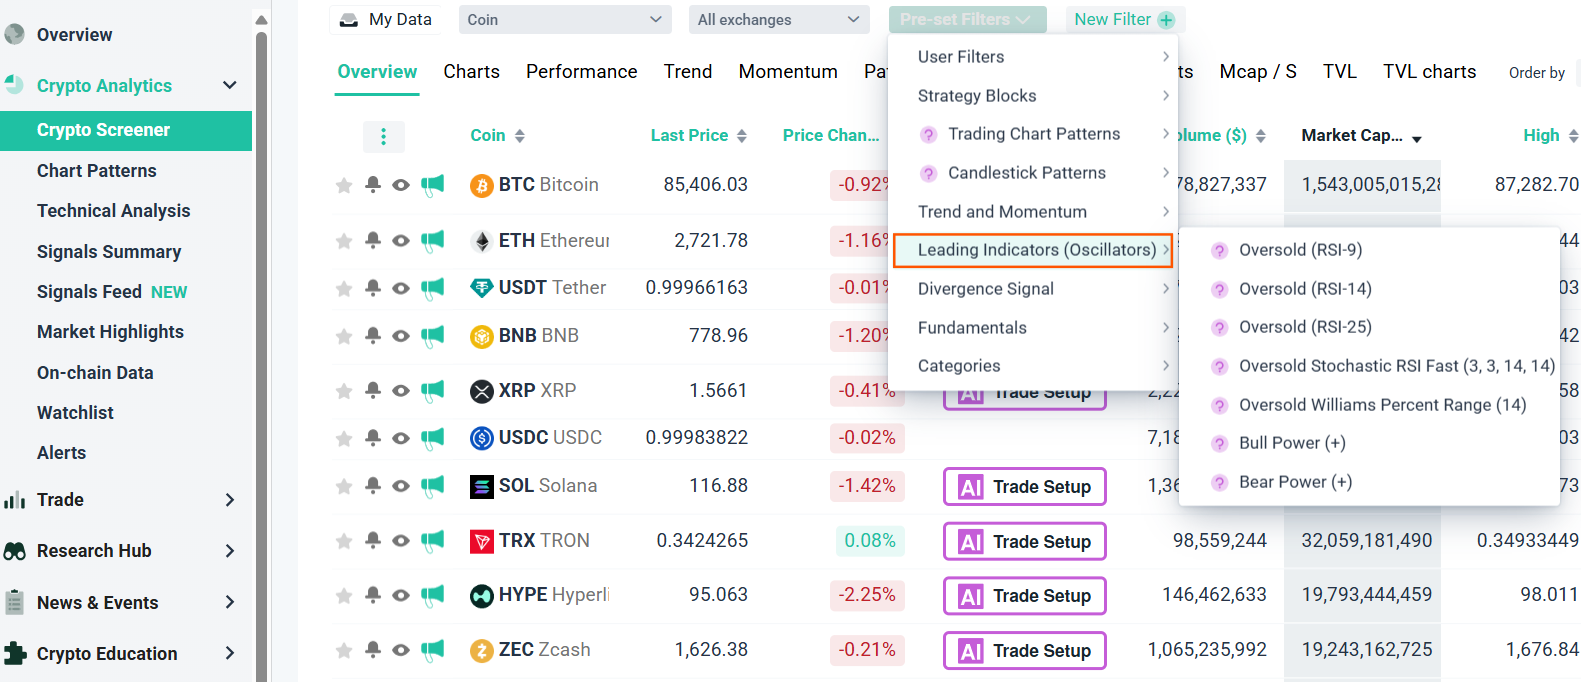
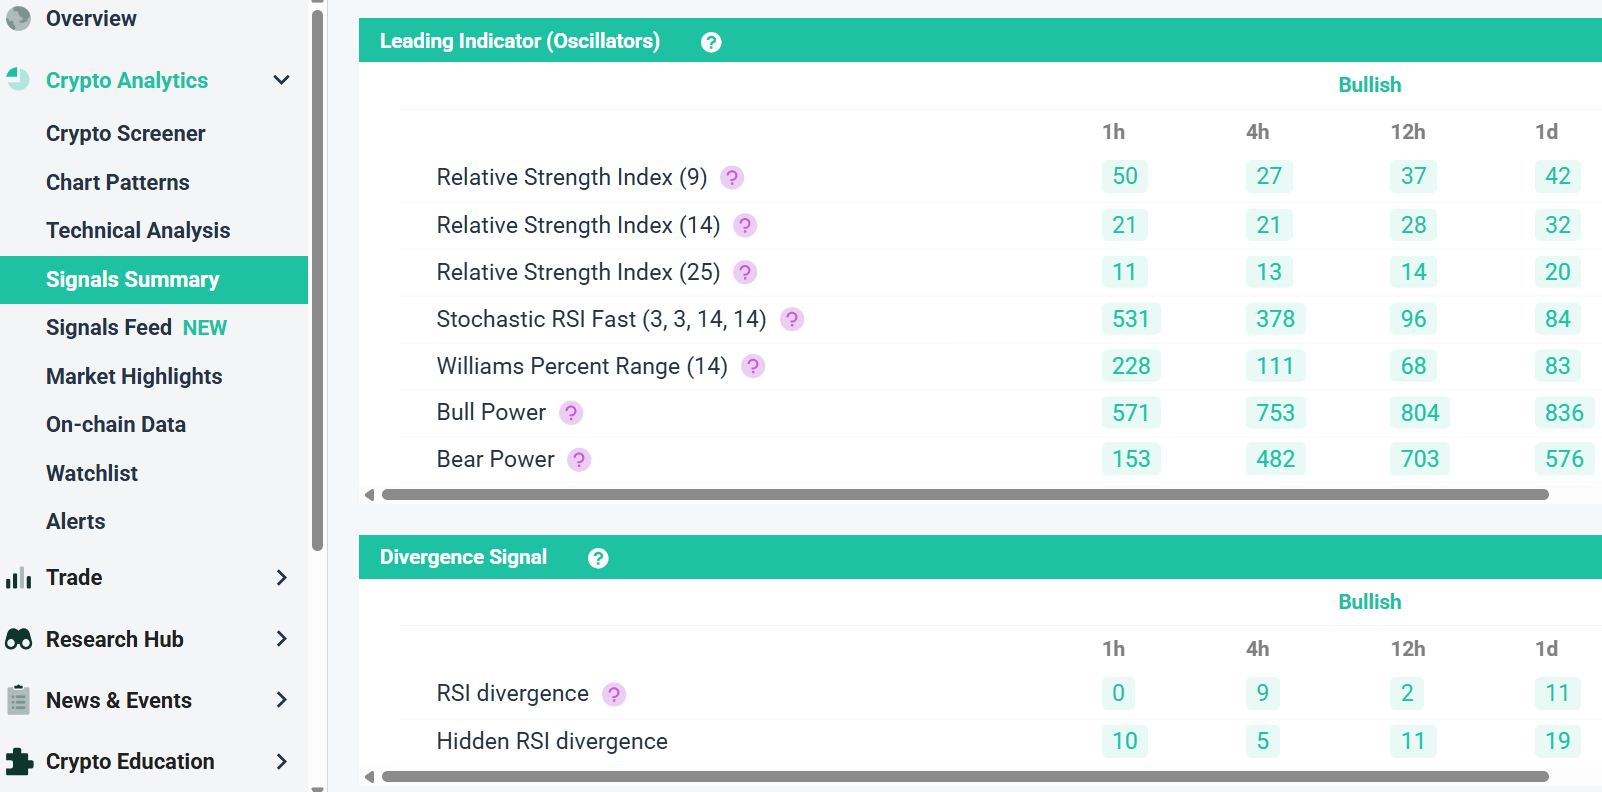
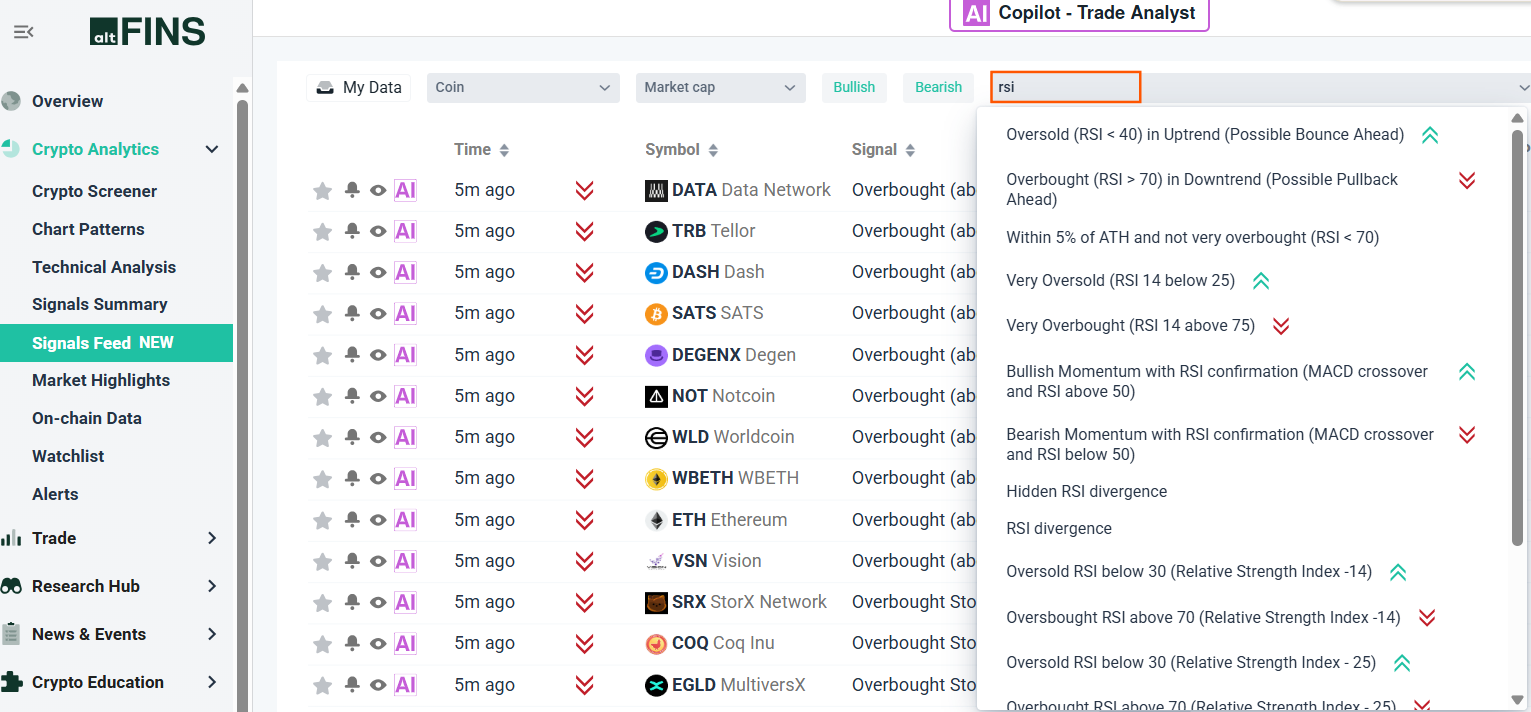
Manually checking RSI and MACD across thousands of coins is not realistic for most traders. The altFINS crypto screener lets you filter the market for coins showing an RSI overbought or oversold reading, a fresh MACD crossover, or both at once, across 2,000+ coins and multiple timeframes. The signals summary dashboard surfaces these setups the moment they trigger, and you can set an alert so you are notified instead of watching charts all day. Combine that with altFINS’s automated chart pattern detection for a full technical picture before you size a position.
Leading Trading Oscillators on altFINS Screener
Leading Trading Oscillators on altFINS Signals Summary
RSI Indicators on altFINS Signals Feed
Frequently asked questions
Is RSI or MACD better for crypto trading?
Neither is better in every case. RSI works best for timing entries in sideways or range-bound markets because it reacts quickly to price swings. MACD works best for confirming that a trend has real strength, since it is built from moving averages and reacts more slowly. Most traders use both together rather than choosing one.
What is the main difference between RSI and MACD?
RSI is a bounded momentum oscillator that moves between 0 and 100 and flags overbought or oversold conditions. MACD is an unbounded, trend-following indicator built from the gap between two exponential moving averages. RSI measures speed of price change, MACD measures the relationship between short and long-term trend direction.
Can you use RSI and MACD together?
Yes. A common approach is to use a MACD crossover to confirm the direction of the trend, then use RSI to check that momentum is not already overextended before entering. Requiring both to line up filters out many of the false signals either indicator gives on its own.
Which is better for spotting divergence, RSI or MACD?
RSI divergence is the more widely used and generally more reliable of the two, since RSI reacts faster to price extremes. MACD divergence is also valid and can catch longer-term trend exhaustion, but it lags more, so RSI divergence is typically the first signal traders check.
What are the best RSI and MACD settings for crypto?
The standard 14-period RSI with 70/30 overbought and oversold levels and the standard 12, 26, 9 MACD settings work well as a starting point for most crypto pairs. Some traders tighten RSI to 75/25 on higher timeframes to reduce false signals, but the defaults remain the most tested and widely used settings.
Do professional crypto traders rely on RSI or MACD more?
Most professional traders do not rely on either one exclusively. RSI tends to be favored for short-term entries and exits, while MACD is favored for confirming trend direction on swing trades. Combining both with volume and price action is far more common among experienced traders than using either indicator alone.
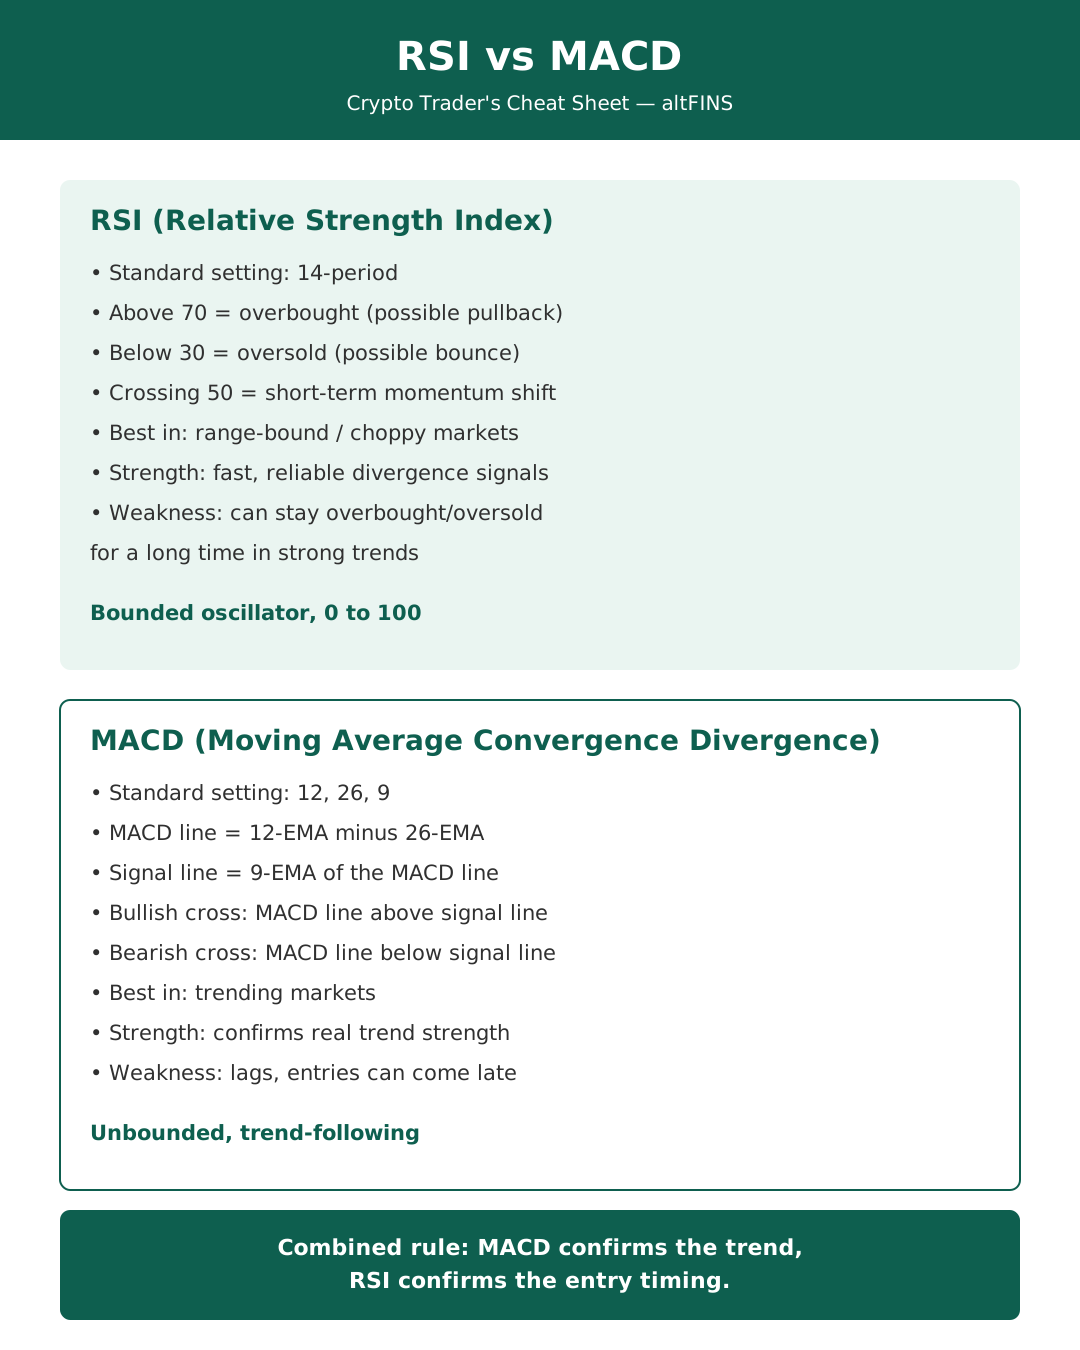
Verdict: RSI or MACD for crypto trading?
There is no single winner. RSI is the better tool for timing entries in choppy, range-bound crypto markets and for spotting early reversal signals through divergence. MACD is the better tool for confirming that a new trend has real momentum before you commit to holding through volatility. Used together, with a screener that can scan the whole market for both signals at once, they cover each other’s blind spots far better than either one does alone.
Ready to put this into practice? Try the altFINS crypto screener to filter the market for live RSI and MACD setups across thousands of coins.
This article is for educational purposes only and does not constitute financial advice. Cryptocurrency trading involves significant risk, including the possible loss of your entire investment. Past indicator performance does not guarantee future results. Always do your own research before making trading decisions.
