

Search Knowledge Base by Keyword
Double Top and Double Bottom Chart Patterns in Trading
Two of the most common reversal shapes on a crypto chart look like the letters M and W. Traders call them the double top and the double bottom, and confusing one for the other, or acting before it confirms, is one of the fastest ways to get caught on the wrong side of a reversal.
This guide is for crypto traders who already read basic candlesticks and want a repeatable, rules-based way to spot, confirm, and trade both patterns instead of guessing from a screenshot.
You will get the exact definition of each pattern, the difference between a real reversal and a fake one, entry, stop and target rules, a real 2026 bitcoin example, and how altFINS automated chart pattern engine flags both patterns across 500+ coins so you do not have to scan charts by hand.
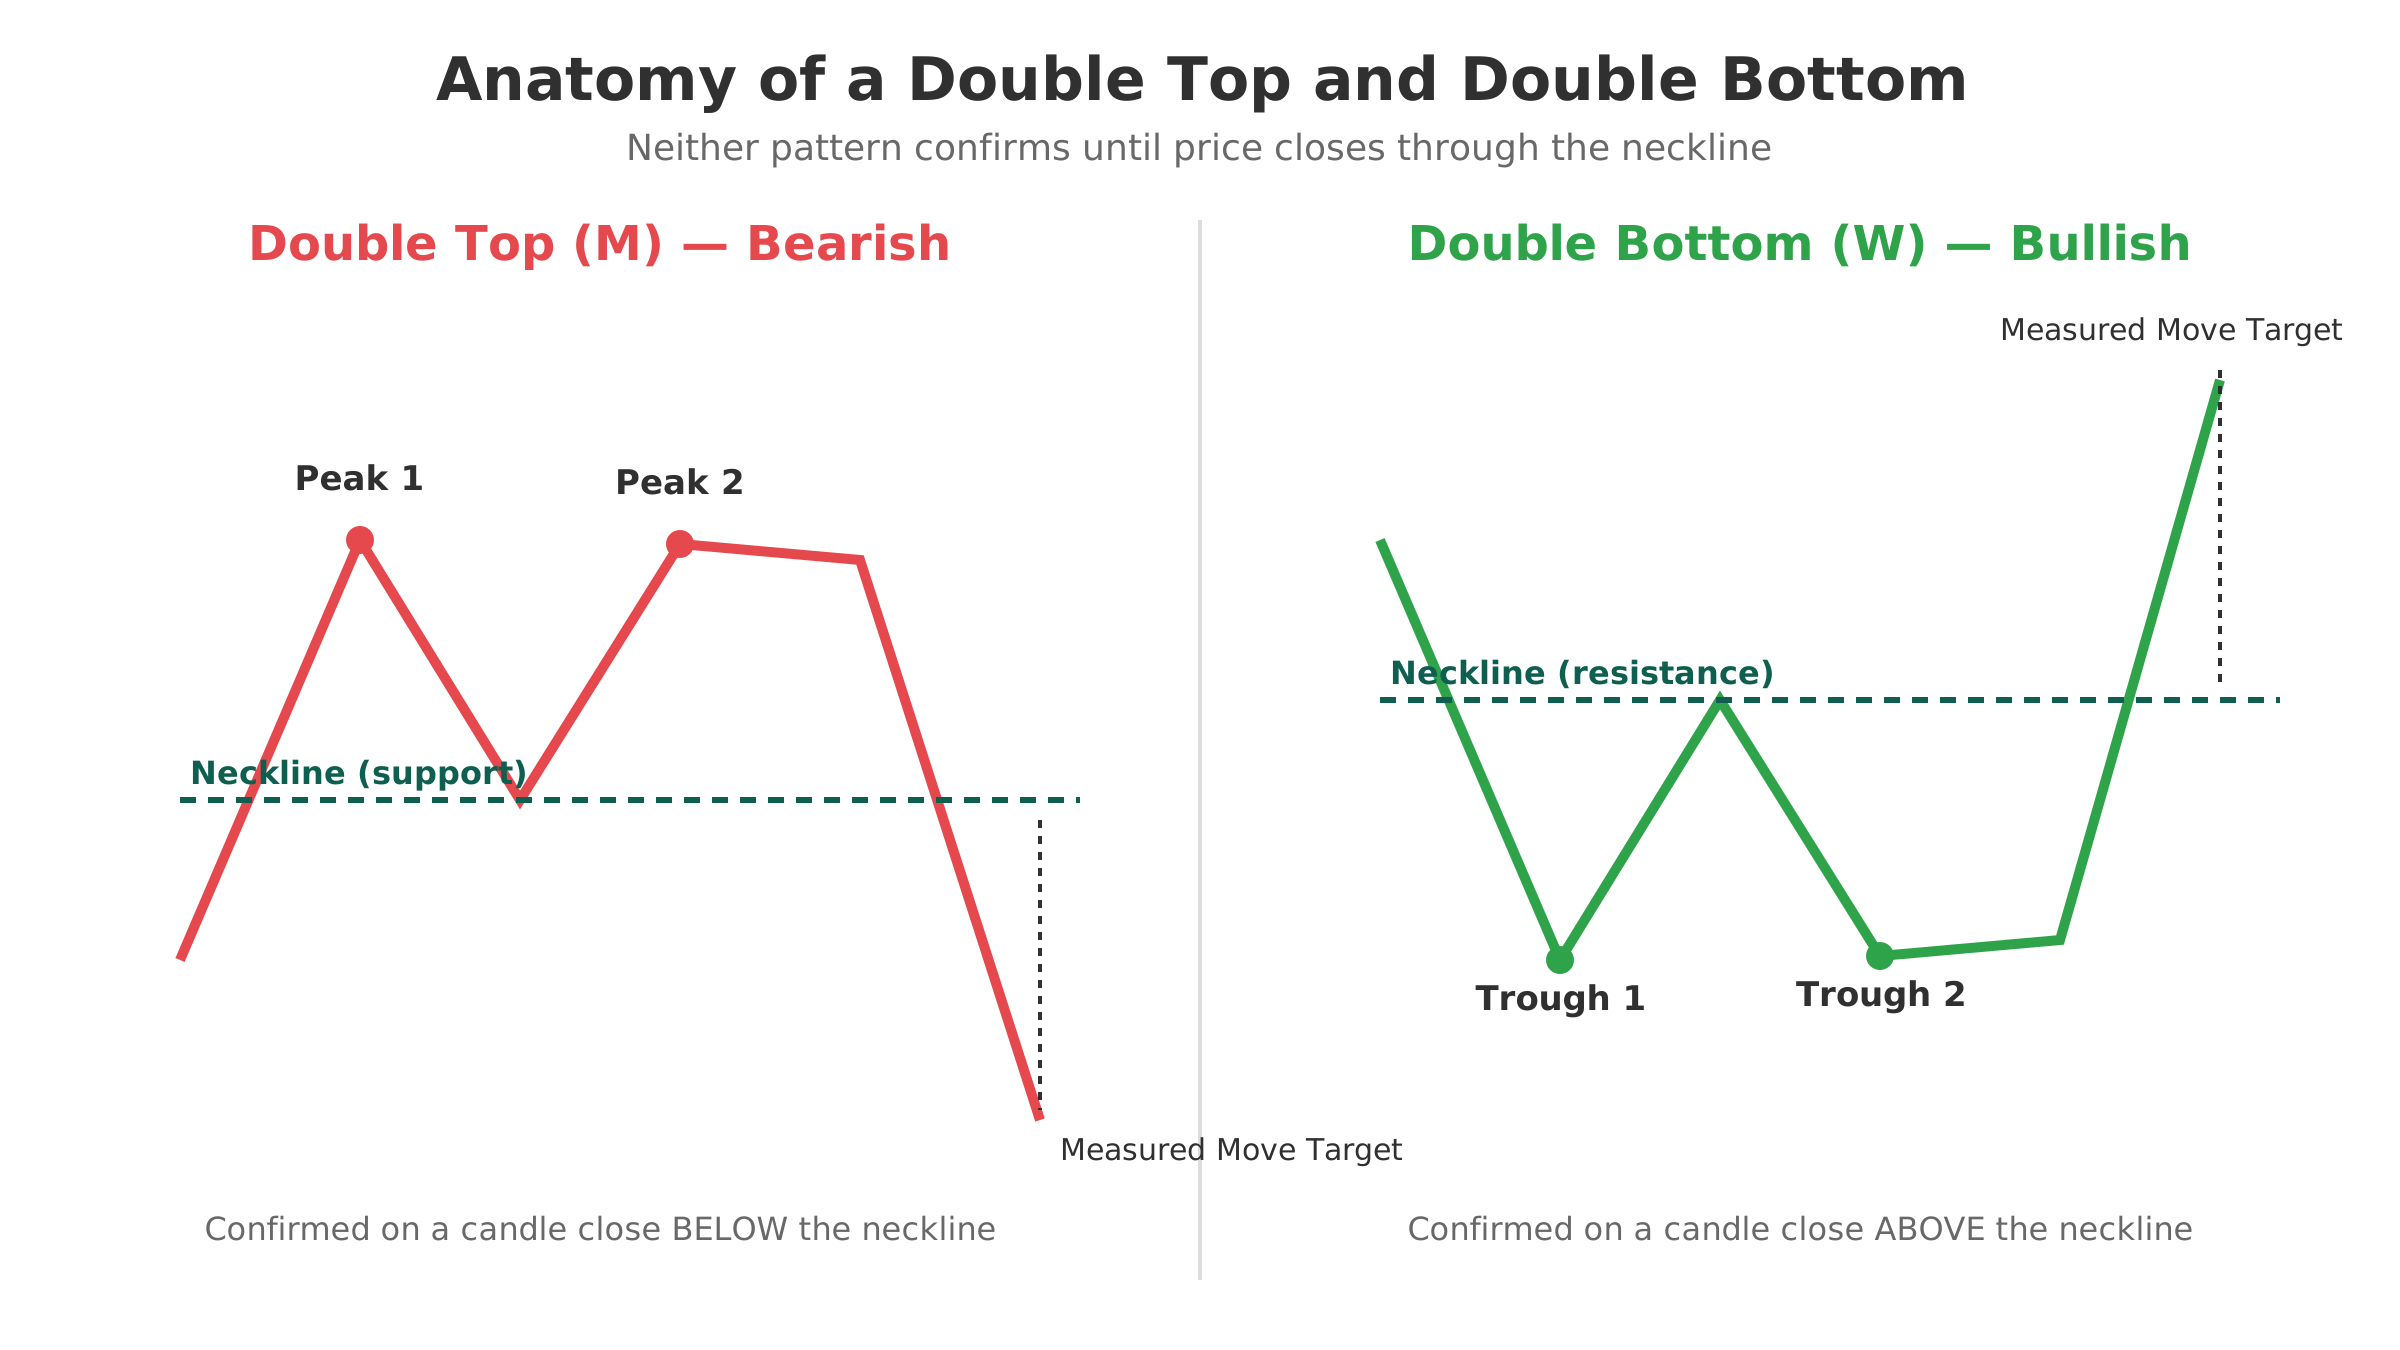
Quick answer: A double top is a bearish “M” shaped reversal pattern where price fails twice at roughly the same resistance level. A double bottom is a bullish “W” shaped reversal where price holds twice at roughly the same support level. Neither pattern is confirmed until price closes through the neckline, the horizontal level formed by the swing low (double top) or swing high (double bottom) between the two peaks or troughs. Until that close happens, you are looking at a maybe, not a signal.
📉 What Is a Double Top Pattern?
A double top forms after an uptrend, when price rallies to a high, pulls back, rallies again to a similar high, and then fails a second time. The two peaks sit at roughly the same price, usually within about 2 to 3%, and the pullback between them creates the neckline, a horizontal support level. The pattern only confirms once price closes below that neckline on a daily or higher timeframe candle, signalling that buyers could not push through resistance twice and sellers have taken control.
Takeaway: a double top is a bearish reversal signal, and it is not tradeable until price closes below the neckline.
📈 What Is a Double Bottom Pattern?
A double bottom is the mirror image. It forms after a downtrend, when price drops to a low, bounces, drops again to a similar low, and then holds. The two troughs sit within roughly 2 to 3% of each other, and the bounce between them forms the neckline, this time acting as resistance. The pattern confirms when price closes above that neckline, showing that sellers failed to push price to new lows twice and buyers have stepped in.
Takeaway: a double bottom is a bullish reversal signal, and like its counterpart, it only confirms on a close through the neckline.
Double Top vs Double Bottom: Key Differences
| Feature | Double Top (M) | Double Bottom (W) |
|---|---|---|
| Prior trend | Uptrend | Downtrend |
| Shape | Two peaks, one trough between them | Two troughs, one peak between them |
| Bias | Bearish reversal | Bullish reversal |
| Confirmation | Candle closes below the neckline | Candle closes above the neckline |
| Volume clue | Often lower volume on the second peak | Often higher volume on the second trough and breakout |
| Typical target | Neckline minus pattern height | Neckline plus pattern height |
How to Spot One on a Crypto Chart
- Find the prior trend. A double top needs a real uptrend behind it; a double bottom needs a real downtrend. Without one, you are just looking at two random swing points.
- Compare the two extremes. The two peaks (or troughs) should sit within roughly 2 to 3% of each other. Wider gaps make the pattern less reliable, especially on volatile altcoins.
- Draw the neckline. Connect the swing low between the peaks (double top) or the swing high between the troughs (double bottom) with a horizontal line.
- Wait for a confirmed close through the neckline, ideally with above-average volume on the breakout candle. A wick through the line does not count.
How Reliable Are These Patterns?
In Thomas Bulkowski’s widely cited chart-pattern research on traditional markets, confirmed double tops have roughly a 25% break-even failure rate, meaning about 3 in 4 confirmed patterns move at least 5% below the breakdown point before reversing. altFINS’s own pattern-recognition engine, which scans the top 500 coins across four timeframes, currently rates the double bottom among its more reliable bullish setups, with a historical success rate of around 82% across the coins it has flagged.
Crypto adds its own wrinkle: thinner order books and 24/7 trading mean false breakouts and long wicks are more common on low-cap altcoins than on large caps like BTC or ETH. Independent crypto-focused research generally puts real-world success rates for both patterns in the 60 to 75% range once you factor in volume confirmation and a defined stop, lower than textbook figures but still a meaningful edge over guessing.
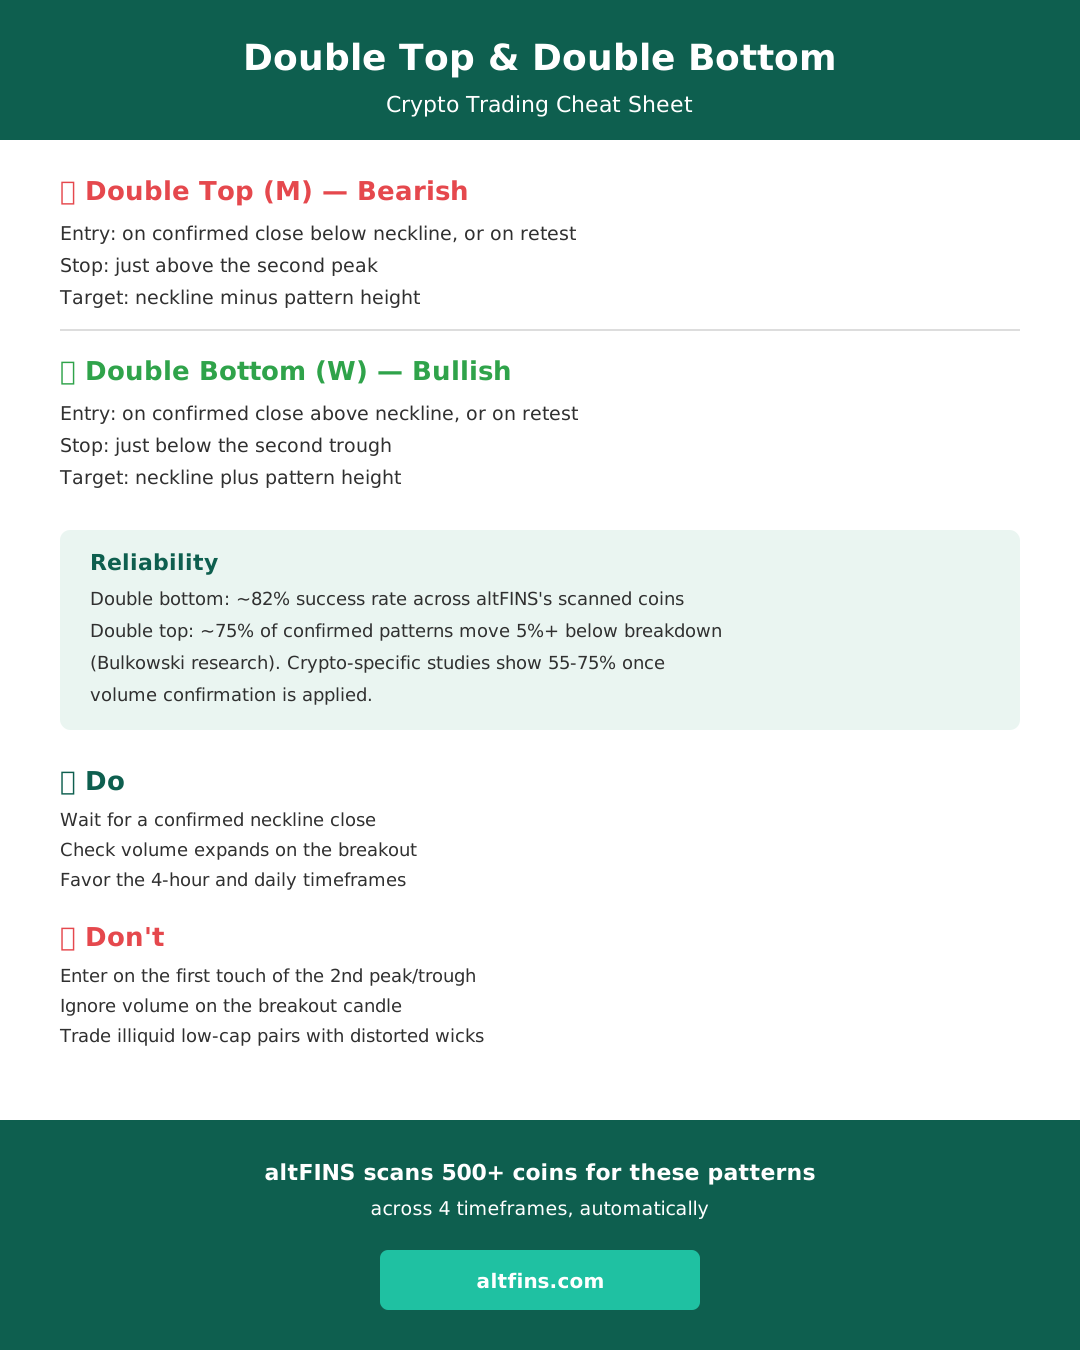
Do: wait for a confirmed neckline close, check that volume expands on the breakout, and favor the 4-hour and daily timeframes for cleaner signals.
Don’t: enter the moment price touches the second peak or trough, ignore volume, or trade the pattern on illiquid low-cap pairs where wicks distort the shape.
How to Trade a Double Top
Most traders take one of two entries once the neckline breaks: an aggressive entry on the confirmed breakdown candle’s close, or a more conservative entry on a retest of the neckline from below, which now acts as resistance. The stop typically sits just above the second peak, since a move back above it invalidates the pattern. The measured-move target is the neckline level minus the height of the pattern, that is, the vertical distance from the peaks down to the neckline, projected downward from the breakdown point.
How to Trade a Double Bottom
The logic mirrors the double top. Enter on the confirmed close above the neckline, or wait for a retest of the neckline from above, which now acts as support. The stop goes just below the second trough. The measured-move target is the neckline plus the pattern height, the vertical distance from the troughs up to the neckline, projected upward from the breakout point. Many traders scale out part of the position at the measured-move target and trail the rest if volume and trend strength stay supportive.
Real Example: Bitcoin’s 2026 Double-Bottom Watch
Bitcoin peaked near $126,000 in October 2025, then fell roughly 50% to trade around $64,350 by early August 2026. In late February 2026, CoinDesk reported bitcoin bouncing above $65,000 as the market watched for a double-bottom to form in the $60,000 to $65,000 zone. Analysts at the time framed it as roughly 10% of upside potential if the pattern held versus a further decline of about 25% if support failed, a useful real-world illustration of why the neckline close, not the first bounce, is what actually confirms the pattern.
🔍 How altFINS Helps You Catch These Patterns Early
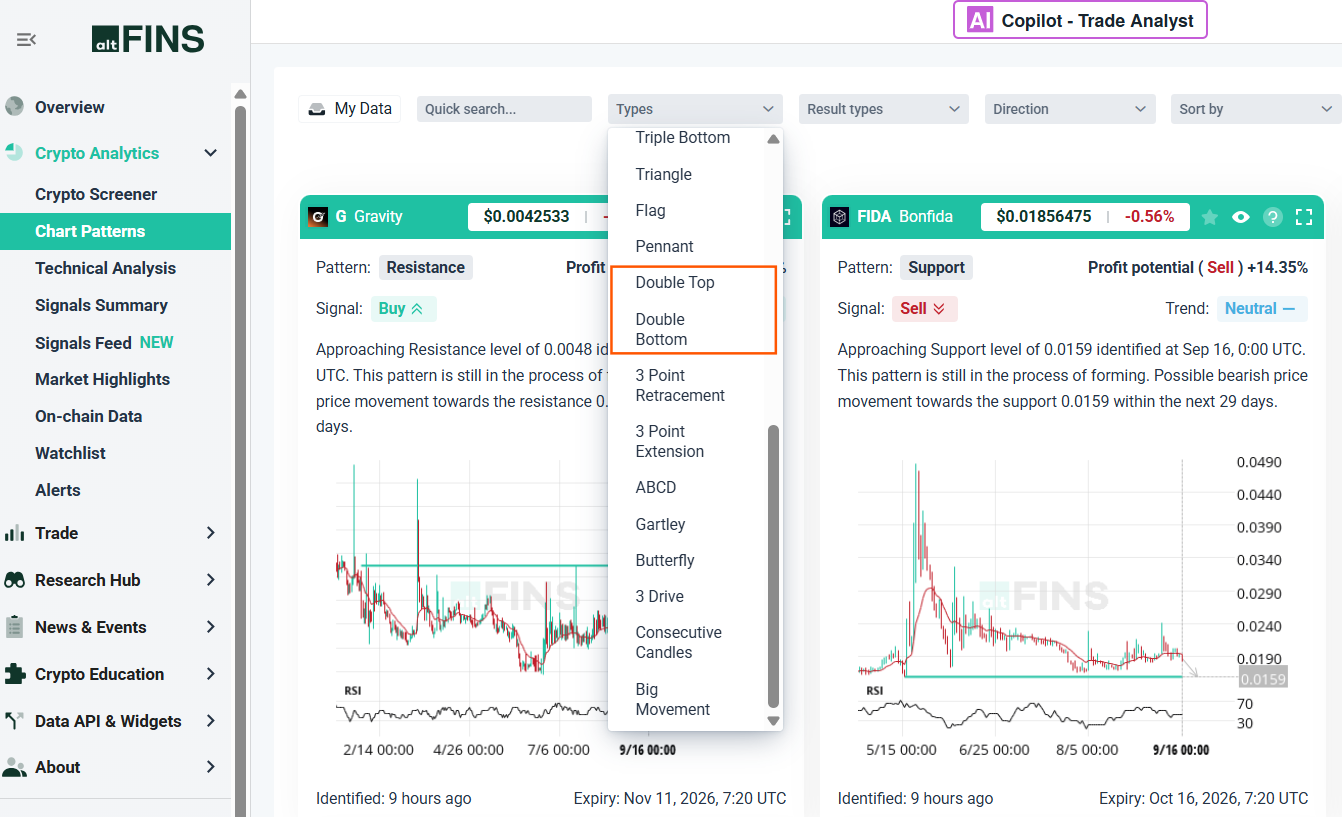
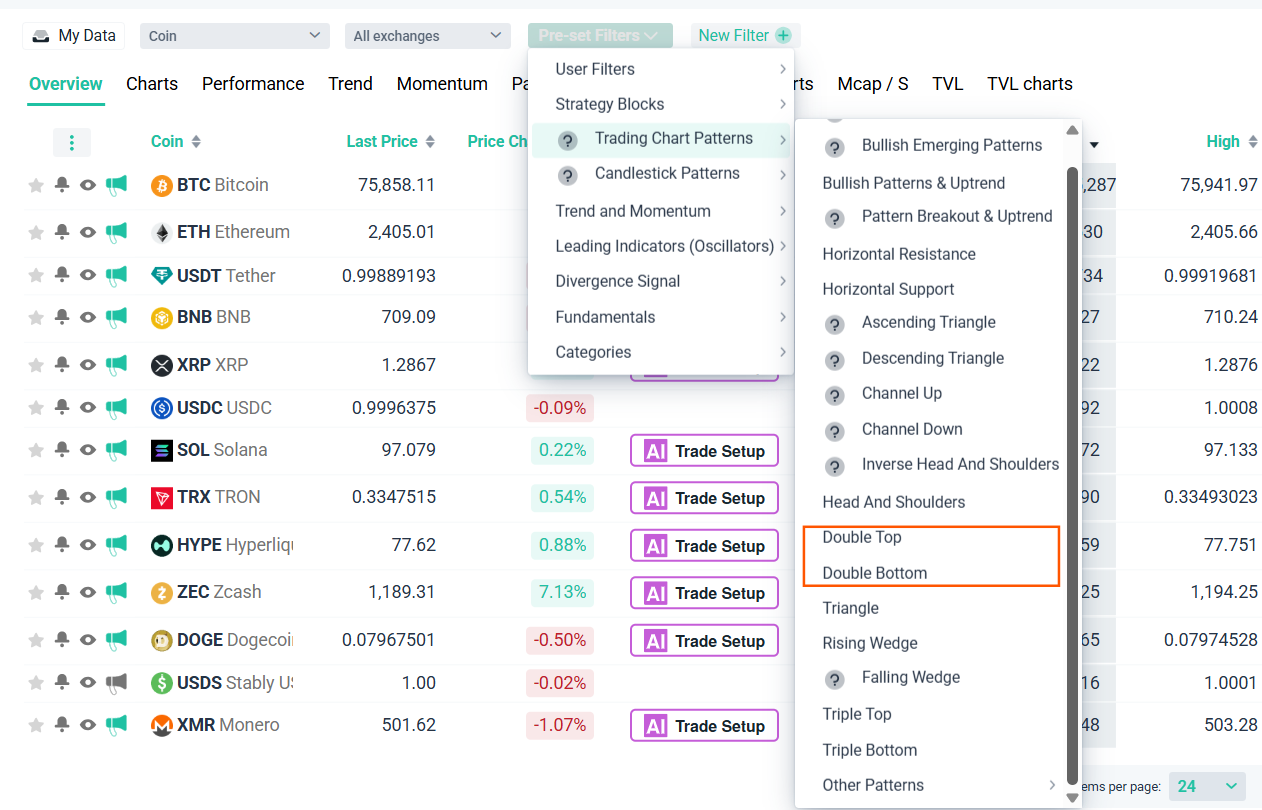
Manually scanning hundreds of charts for a clean M or W shape is slow and error-prone. The altFINS automatically detects double tops, double bottoms, and 24 other chart patterns across the top 500 coins on four timeframes, in real time. Each detected pattern comes with an identified neckline, a projected target, and a historical success rate, so you can filter for setups that are still forming or have already broken out. Pair that with a custom alert and you get notified the moment a neckline breaks instead of finding out after the move already happened.
Double Top and Double Bottom Chart Patterns on altFINS Chart Patterns Section
Double Top and Double Bottom Chart Patterns on altFINS Screener – Preset Filters
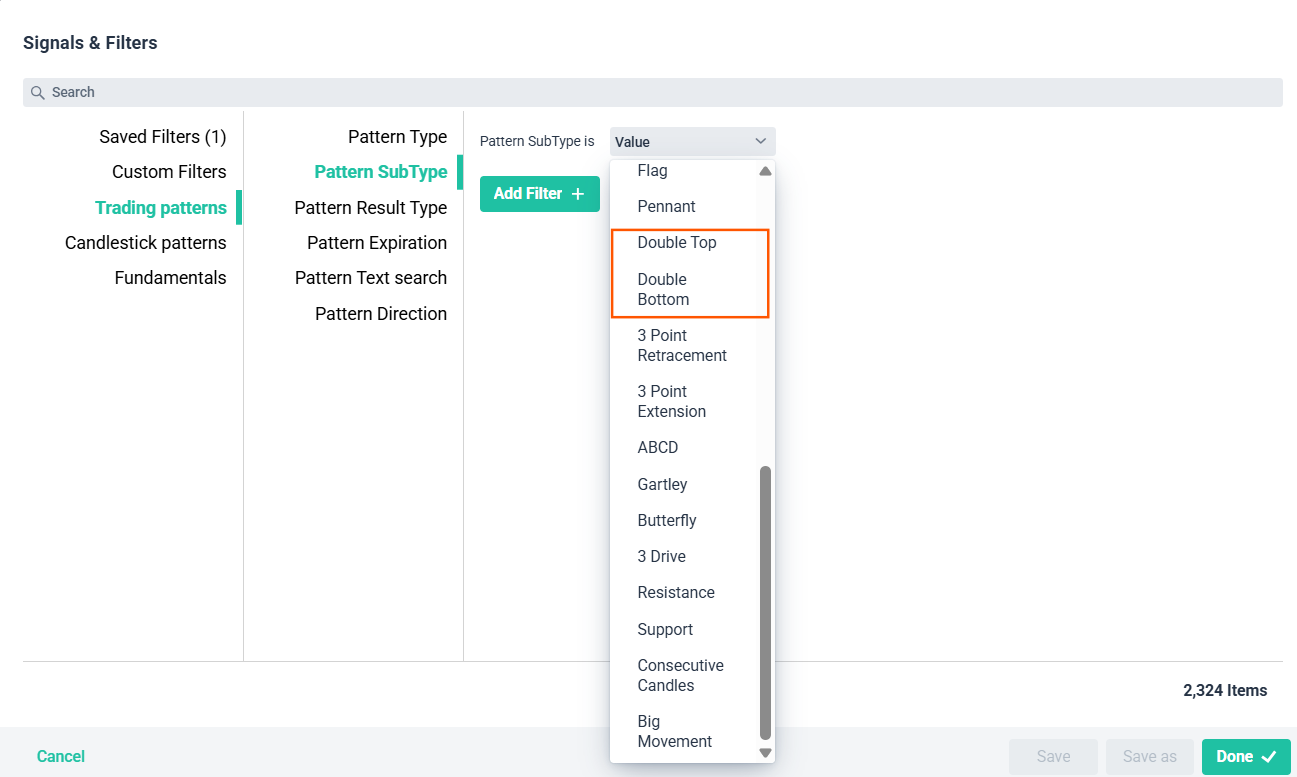
Double Top and Double Bottom Chart Patterns on altFINS Screener – Custom Filters
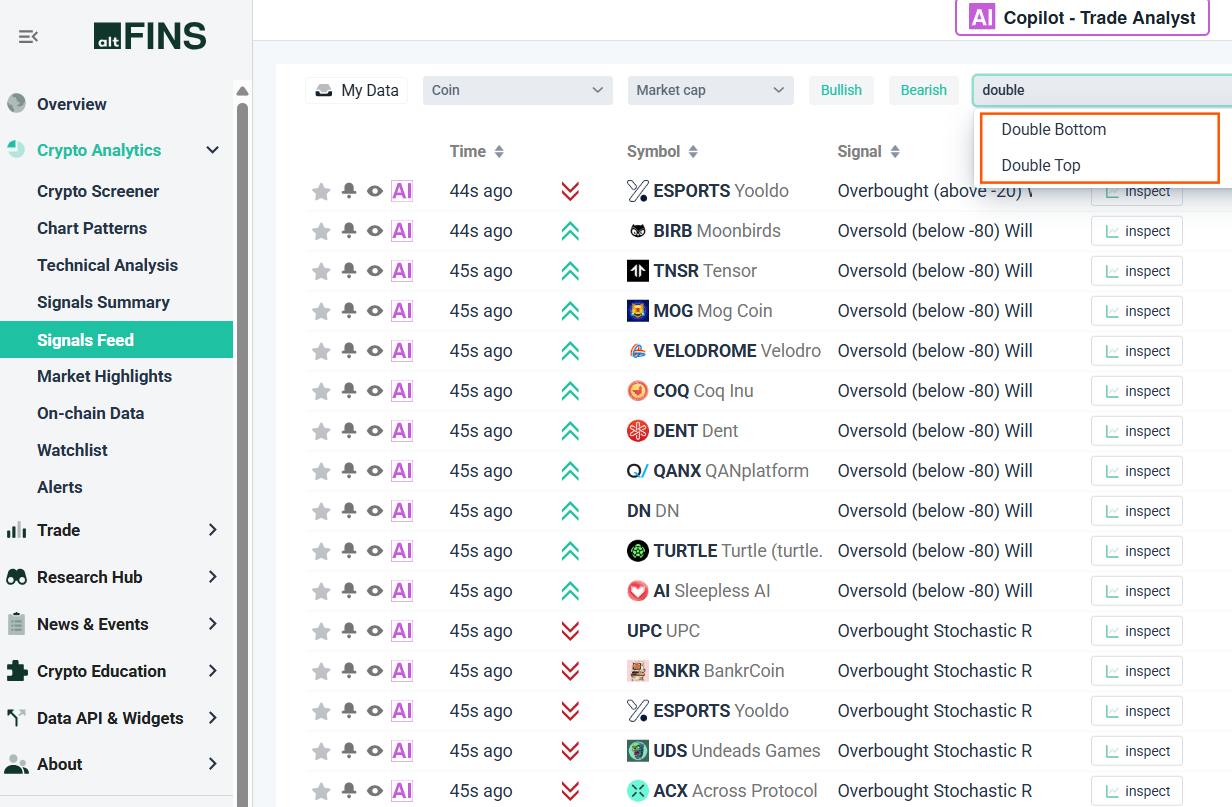
Double Top and Double Bottom Chart Patterns on altFINS Signals Feed
Frequently asked questions
Is a double top bullish or bearish?
A double top is a bearish reversal pattern. It forms after an uptrend when price fails twice at roughly the same resistance level, signalling that buyers have run out of momentum. The bearish signal only becomes actionable once price closes below the neckline formed between the two peaks, ideally on rising volume.
How do I confirm a double bottom pattern?
A double bottom confirms when a candle closes above the neckline, the resistance level formed by the bounce between the two troughs. A brief wick above the neckline is not enough; look for a full candle close, and ideally a volume increase on the breakout candle, before treating the pattern as valid.
What is the difference between a double bottom and a triple bottom?
A double bottom has two roughly equal troughs; a triple bottom has three. The triple bottom is generally viewed as a stronger reversal signal because support has held three separate times instead of two, though it is also rarer and can take longer to complete on a crypto chart.
How reliable is the double top pattern in crypto?
Independent crypto-focused analysis generally puts double top success rates around 55 to 65% once volume confirmation is applied, somewhat lower than the classic 75% figure from traditional-market research, because crypto’s thinner liquidity produces more false breakouts. Using a defined stop above the second peak keeps losing trades small.
What timeframe works best for spotting double tops and double bottoms?
The 4-hour and daily charts give the cleanest signals because they filter out the noise that shows up on lower timeframes. Patterns that form on the 15-minute or 1-hour chart are more common but also fail more often, so weight them less heavily than a pattern confirmed on a daily close.
Can a double top or double bottom pattern fail?
Yes. Both patterns can fail, most often when the neckline break lacks volume or when broader market conditions overwhelm the local pattern. That is why traders always pair the pattern with a stop-loss placed beyond the second peak or trough rather than assuming the reversal is guaranteed once it appears.
Verdict
Double tops and double bottoms are two of the most recognizable reversal patterns in crypto because they are visually simple, but that simplicity is also why they get misread. The edge is not in spotting the “M” or “W” shape, it is in waiting for the confirmed neckline close, checking volume, and sizing the trade around a stop that respects the pattern’s invalidation point.
Ready to stop eyeballing charts for these setups? Open the altFINS crypto screener or altFINS Chart patterns and filter for live double top and double bottom patterns across 500+ coins, or browse the full crypto chart patterns guide to see all 26 patterns altFINS tracks.
This article is for educational purposes only and is not financial advice. Chart patterns, including double tops and double bottoms, describe historical price behavior and do not guarantee future results. Cryptocurrency trading involves substantial risk of loss; always use a stop-loss and never risk more than you can afford to lose.
