

Search Knowledge Base by Keyword
What Is VWAP? How to Use the VWAP Indicator in Crypto Trading (2026)
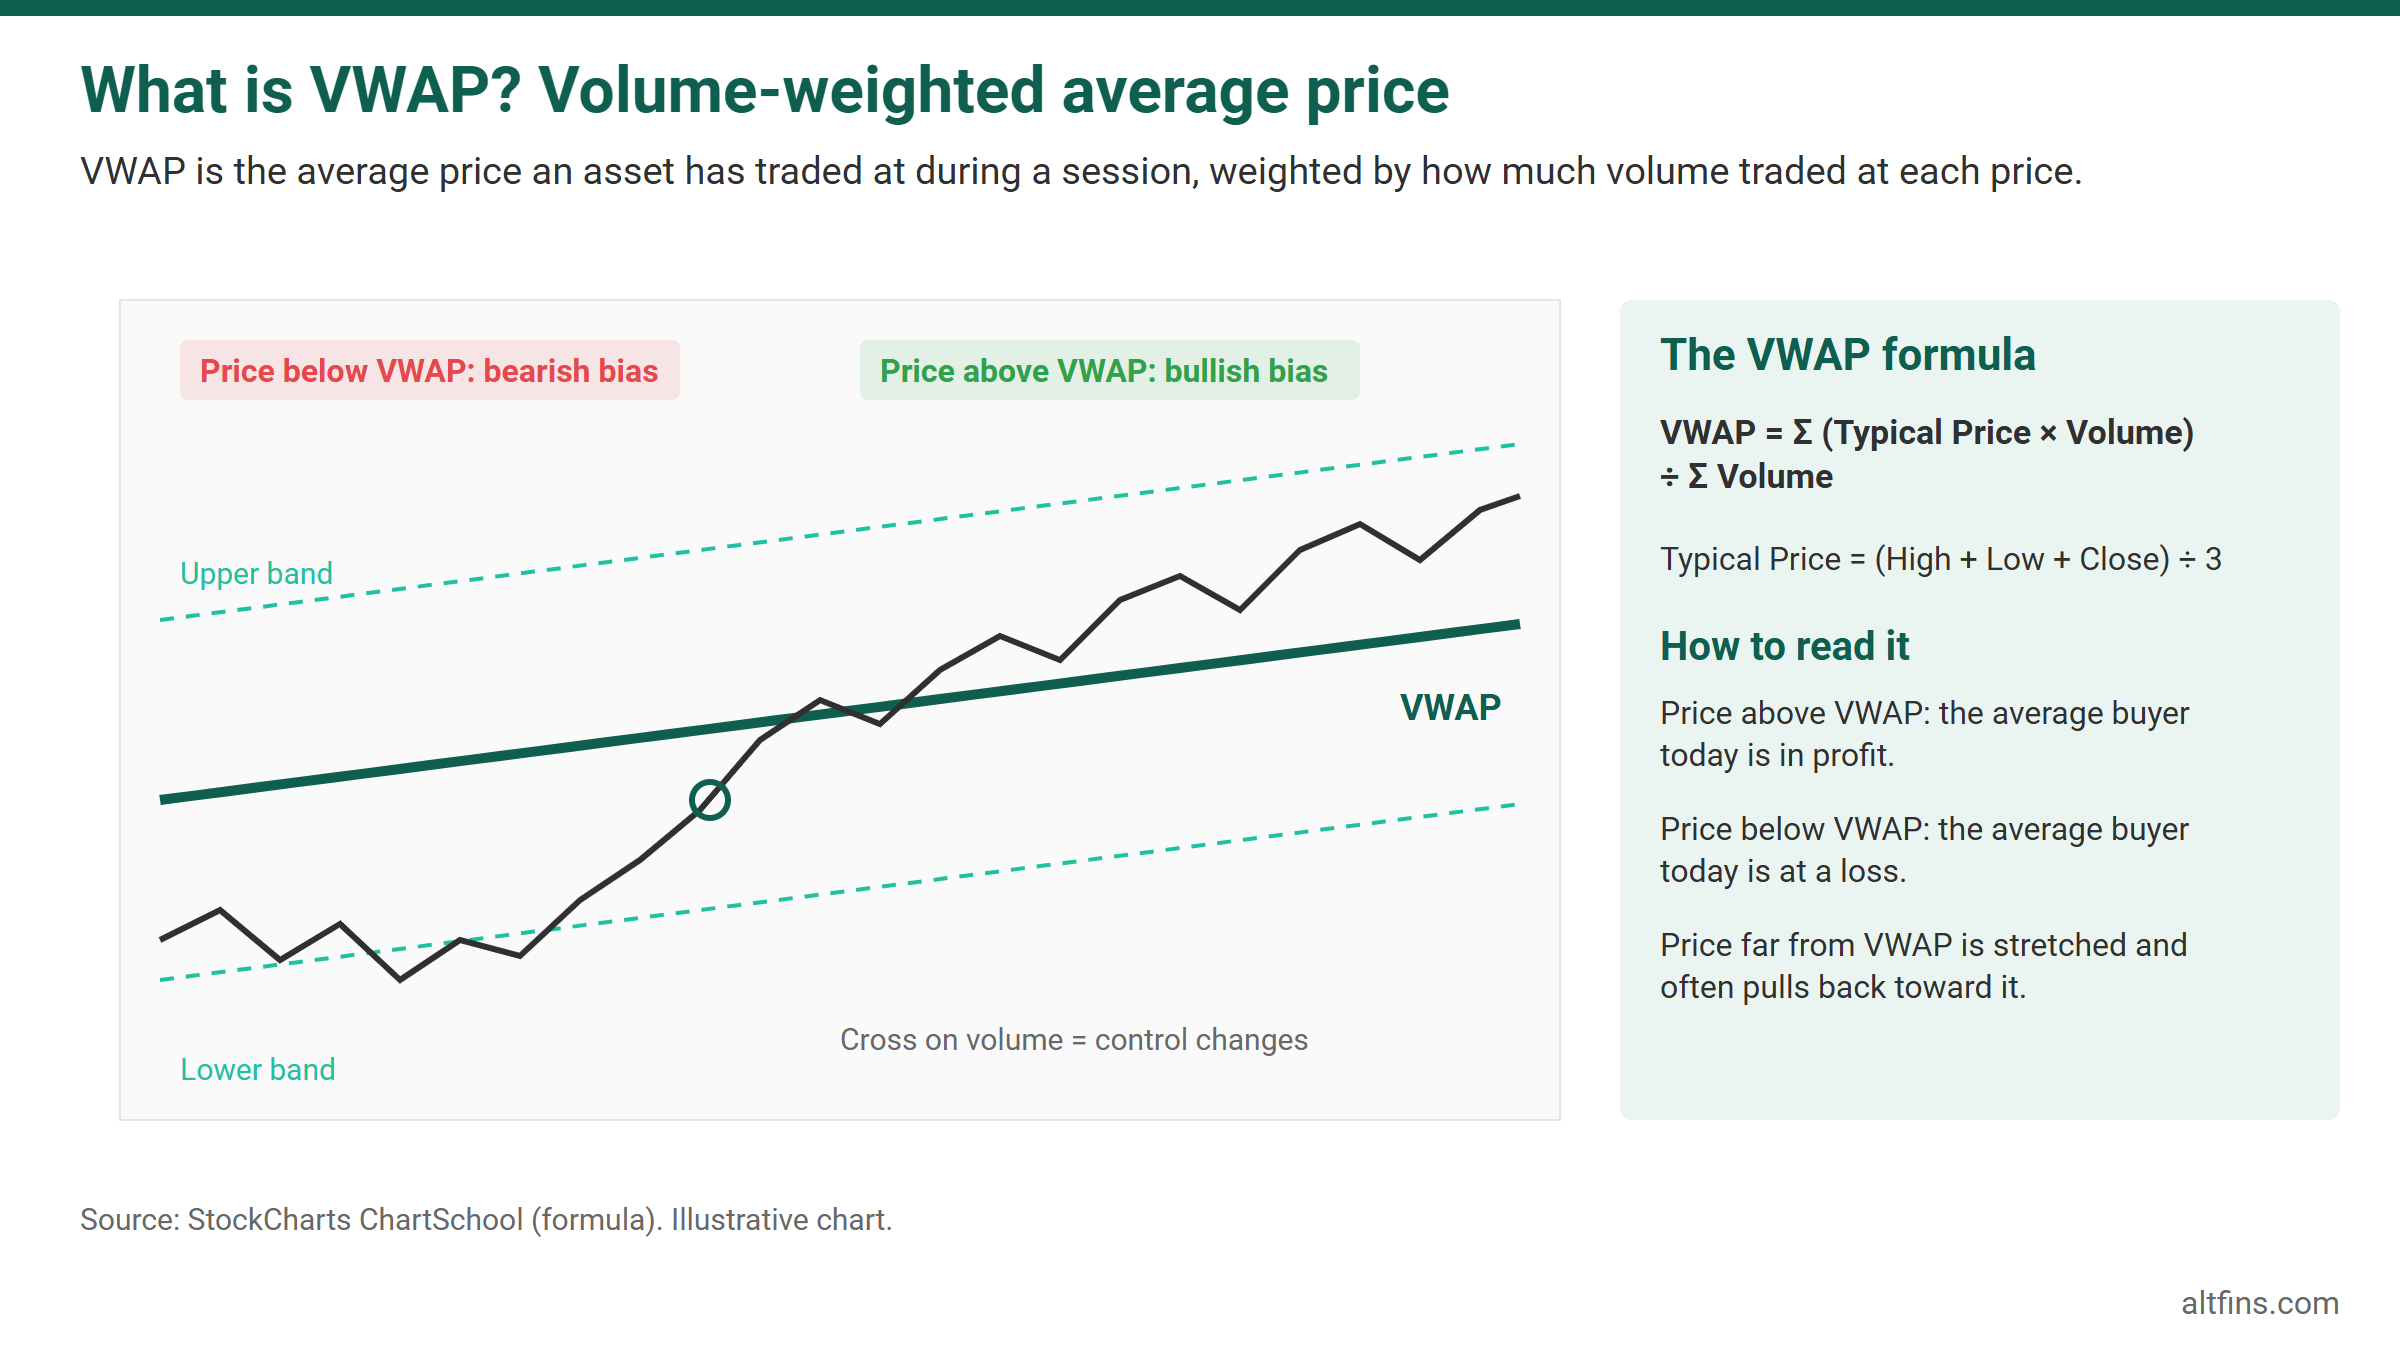
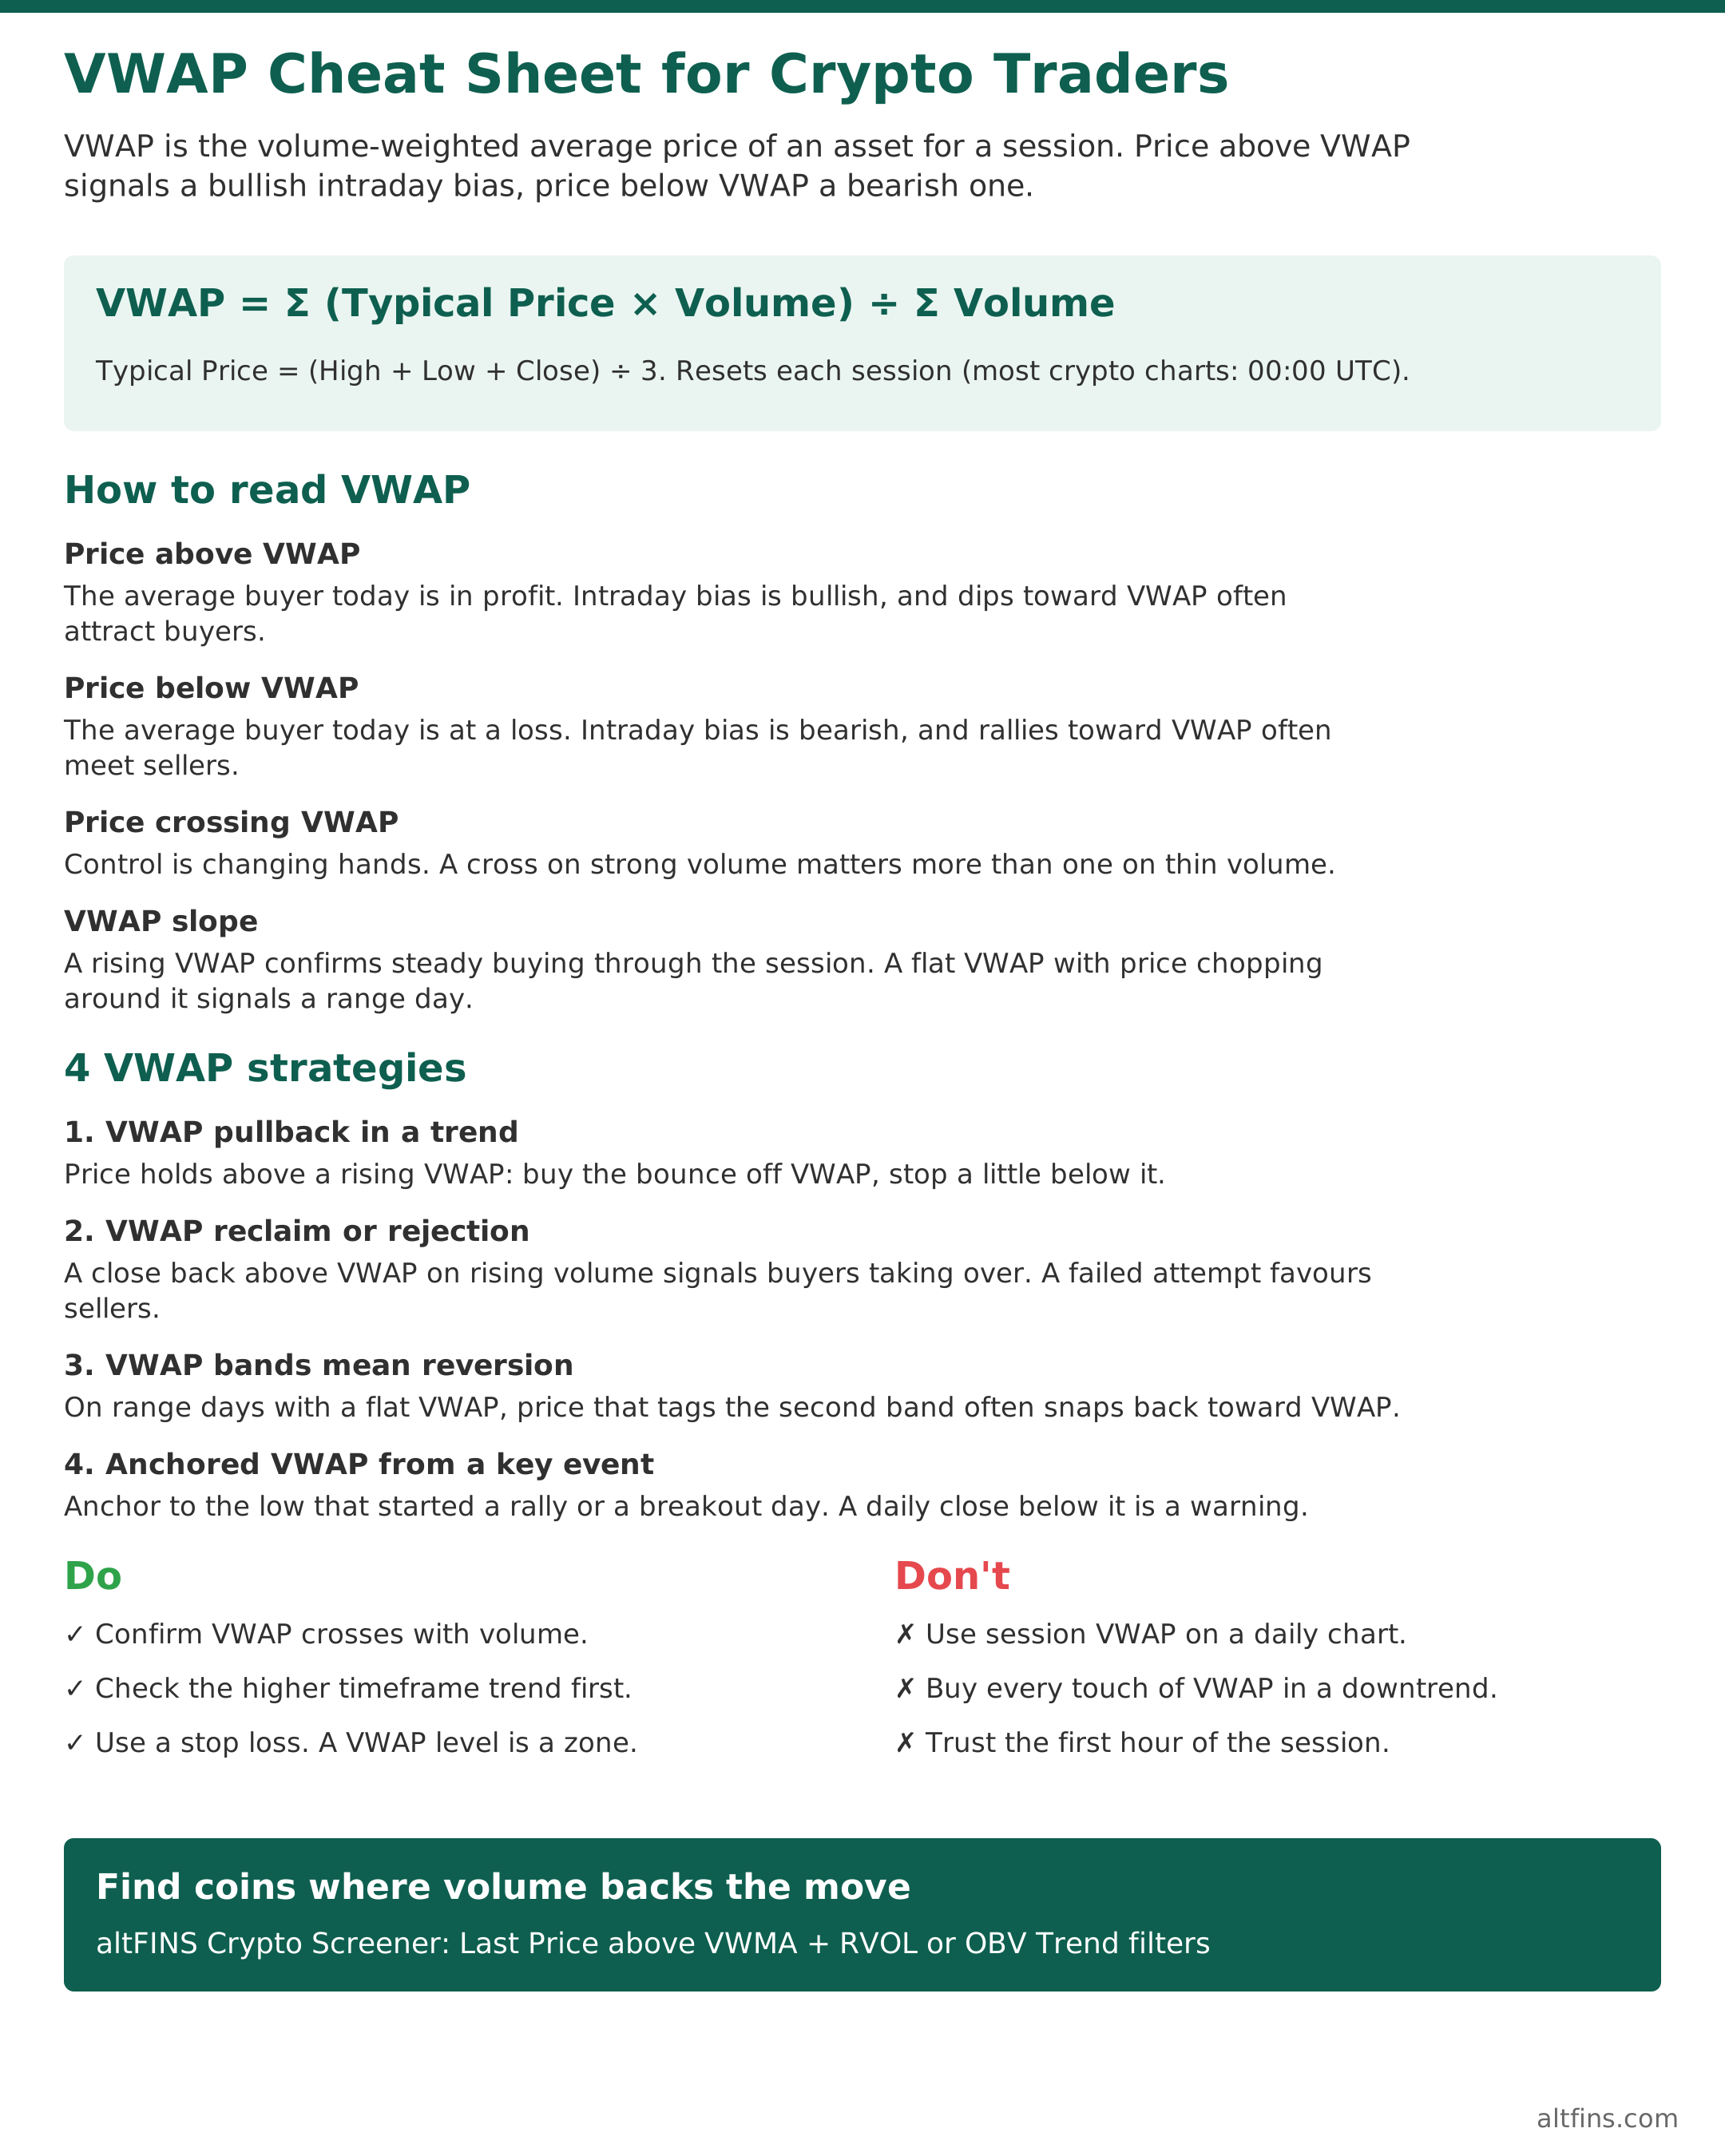
VWAP (volume-weighted average price) is the average price an asset has traded at during a session, weighted by how much volume traded at each price. When price is above VWAP, buyers are in control for that session. When price is below VWAP, sellers are.
This guide is for crypto traders who see the VWAP line on their charts and want to know what it really measures and how to trade with it. You will learn the VWAP formula step by step, see a real Bitcoin VWAP calculation from September 2026, and get four practical VWAP strategies.
We also explain what makes VWAP different in 24/7 crypto markets, how it compares with moving averages, and the mistakes that cause most VWAP trades to fail. Updated September 2026.
Quick answer: VWAP is the volume-weighted average price of an asset for a session. You calculate it by multiplying each period’s typical price by its volume, adding those values up, and dividing by total volume. Traders treat VWAP as the session’s “fair value”: price above VWAP signals a bullish intraday bias, price below VWAP a bearish one.
What is VWAP?
Takeaway: VWAP shows the average price paid by everyone who traded during the session, not just the average of the candles.
VWAP stands for volume-weighted average price. It is a line on the chart that tracks the average price of every trade in the session, with heavier weight given to prices where more volume traded. A price level where 5,000 BTC changed hands counts far more than a level where only 50 BTC traded.
That is the key difference from a simple moving average, which gives every candle the same weight no matter how much volume traded. Because VWAP includes volume, many traders see it as the market’s “fair value” for the day.
VWAP started as an execution benchmark for institutions. According to StockCharts ChartSchool, large funds compare their fills to VWAP: buying below VWAP is a good fill, buying above it is a poor one. Retail traders later adopted it as an intraday trend and support and resistance tool.
The VWAP formula and how to calculate it
Takeaway: VWAP is cumulative typical price times volume, divided by cumulative volume.
VWAP = Σ (Typical Price × Volume) ÷ Σ Volume, where Typical Price = (High + Low + Close) ÷ 3.
To calculate VWAP by hand, follow these 5 steps for every candle in the session:
- Find the typical price: add the candle’s high, low and close, then divide by 3.
- Multiply by volume: typical price × the candle’s volume.
- Keep a running total of those price × volume values.
- Keep a running total of volume.
- Divide: cumulative price × volume ÷ cumulative volume = VWAP for that candle.
Your charting platform does this automatically, but knowing the steps explains why VWAP behaves the way it does. Early in a session it moves a lot. Later in the session it barely moves, because each new candle is a small share of the total volume.
Worked example: Bitcoin VWAP on 26 September 2026
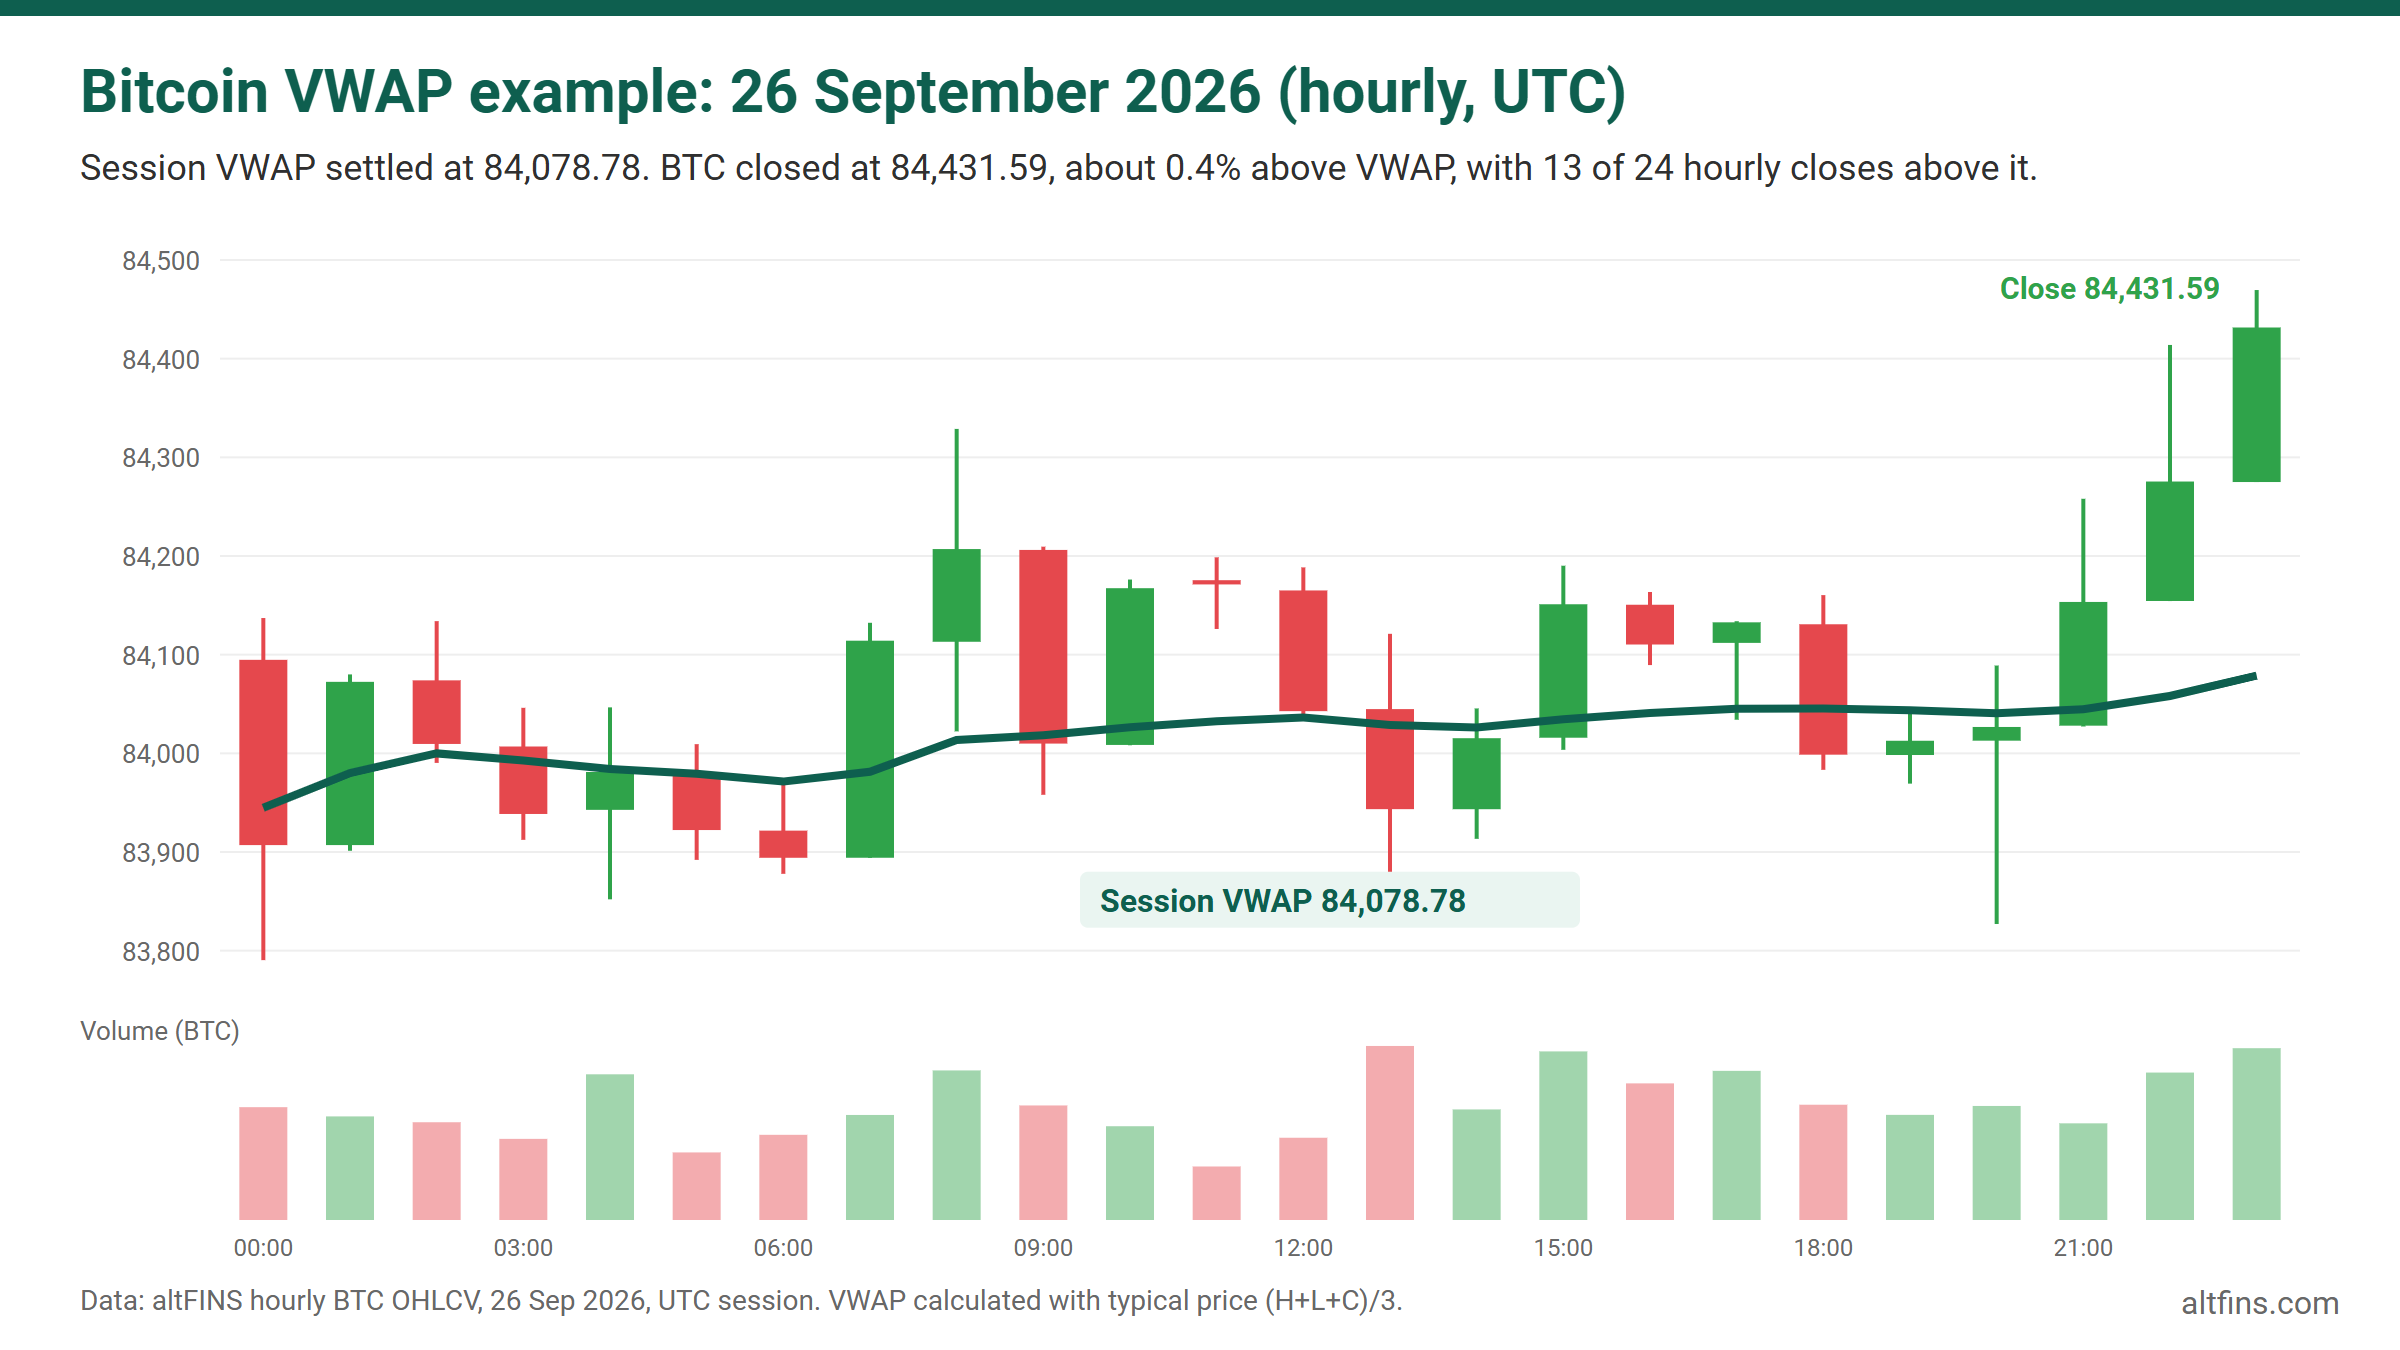
Here is a real calculation using altFINS hourly BTC data for 26 September 2026 (UTC session, volume in BTC). Prices are rounded to the cent.
| Hour (UTC) | High / Low / Close | Typical price | Volume (BTC) | Running VWAP |
|---|---|---|---|---|
| 00:00 | 84,137.13 / 83,790.42 / 83,907.00 | 83,944.85 | 1,629.67 | 83,944.85 |
| 01:00 | 84,079.99 / 83,901.24 / 84,072.46 | 84,017.90 | 1,496.40 | 83,979.82 |
| 02:00 | 84,133.97 / 83,990.31 / 84,009.51 | 84,044.60 | 1,412.22 | 83,999.97 |
| 12:00 | 84,188.44 / 84,036.35 / 84,042.76 | 84,089.18 | 1,188.07 | 84,036.20 |
| 23:00 (session end) | 84,469.55 / 84,274.96 / 84,431.59 | 84,392.03 | 2,481.63 | 84,078.78 |
After the first hour, VWAP simply equals the typical price (83,944.85). By the second hour it blends both candles: (136,802,404 + 125,724,381) ÷ (1,629.67 + 1,496.40) = 83,979.82. By the end of the day, 40,181.91 BTC had traded and VWAP settled at 84,078.78.
Bitcoin closed 13 of the 24 hourly candles above VWAP and finished the session at 84,431.59, about 0.4% above it. The last three hours all closed above a rising VWAP, and the final hour traded 2,481.63 BTC, well above the day’s hourly average of about 1,674 BTC. That is a small but clear sign that buyers took control into the daily close.
How to read the VWAP indicator
Takeaway: where price sits relative to VWAP tells you who is winning the session.
- Price above VWAP: the average buyer today is in profit. Intraday bias is bullish, and dips toward VWAP often attract buyers.
- Price below VWAP: the average buyer today is at a loss. Intraday bias is bearish, and rallies toward VWAP often meet sellers.
- Price crossing VWAP: control is changing hands. A cross on strong volume matters more than one on thin volume.
- VWAP slope: a rising VWAP confirms steady buying through the session. A flat VWAP with price chopping around it signals a range day.
- Distance from VWAP: price far above or below VWAP is stretched. Stretched moves often pull back toward VWAP, which is why many traders add VWAP bands.
VWAP in crypto: when does it reset?
Takeaway: crypto never closes, so you must know which session your VWAP uses.
In stocks, VWAP starts at the market open and ends at the close. ChartSchool notes that VWAP is designed for intraday charts and is not defined for daily, weekly or monthly bars in its classic form. Crypto trades 24/7, so there is no natural open. On most crypto charts the daily session starts at 00:00 UTC, which means a session VWAP resets at midnight UTC. Check the session setting on your platform, because a different time zone gives a different VWAP line.
Many platforms also let you change the anchor period. TradingView’s VWAP can reset by session, week, month, quarter or year, and uses hlc3 (the typical price) as its default source. Swing traders often use a weekly or monthly VWAP on the 4 hour chart to find bigger support and resistance levels.
Anchored VWAP
Anchored VWAP starts the calculation from a point you choose instead of a session open. Popular anchors are a major swing high or low, a breakout candle, a big news event, or a token unlock date. It answers one question: “what is the average price paid by everyone who bought since that moment?” The approach was popularised by trader Brian Shannon and works well in crypto, where there is no daily open to anchor to.
4 VWAP trading strategies for crypto
Takeaway: VWAP works best as a trend filter and a level to trade from, not as a buy or sell signal on its own.
1. VWAP pullback in a trend
When price holds above a rising VWAP, wait for a pullback to the VWAP line. Enter when a candle bounces off VWAP and closes back up, with the stop a little below VWAP. Reverse the logic for shorts below a falling VWAP. This is the most common VWAP setup because you trade with the session’s trend at a fair price.
2. VWAP reclaim or rejection
If price opens the session below VWAP, then closes back above it on rising volume, that “reclaim” signals buyers taking over. A failed attempt to get back above VWAP is a “rejection” and favours sellers. Confirm with volume: a reclaim on low volume often fails.
3. VWAP bands mean reversion
VWAP bands plot standard deviations above and below VWAP, similar to Bollinger Bands. On range days, price that tags the second band often snaps back toward VWAP. Only use this when VWAP is flat. On strong trend days price can ride the outer band for hours.
4. Anchored VWAP from a key event
Anchor VWAP to the low that started a rally, or to the day of a major breakout. While price stays above that anchored VWAP, the buyers since that event are in profit and the move is healthy. A daily close below it warns that the average buyer is now losing money, which often triggers more selling. Combine it with support and resistance lines for stronger levels.
VWAP vs moving average vs VWMA
Takeaway: VWAP is a session benchmark; moving averages are rolling trend tools.
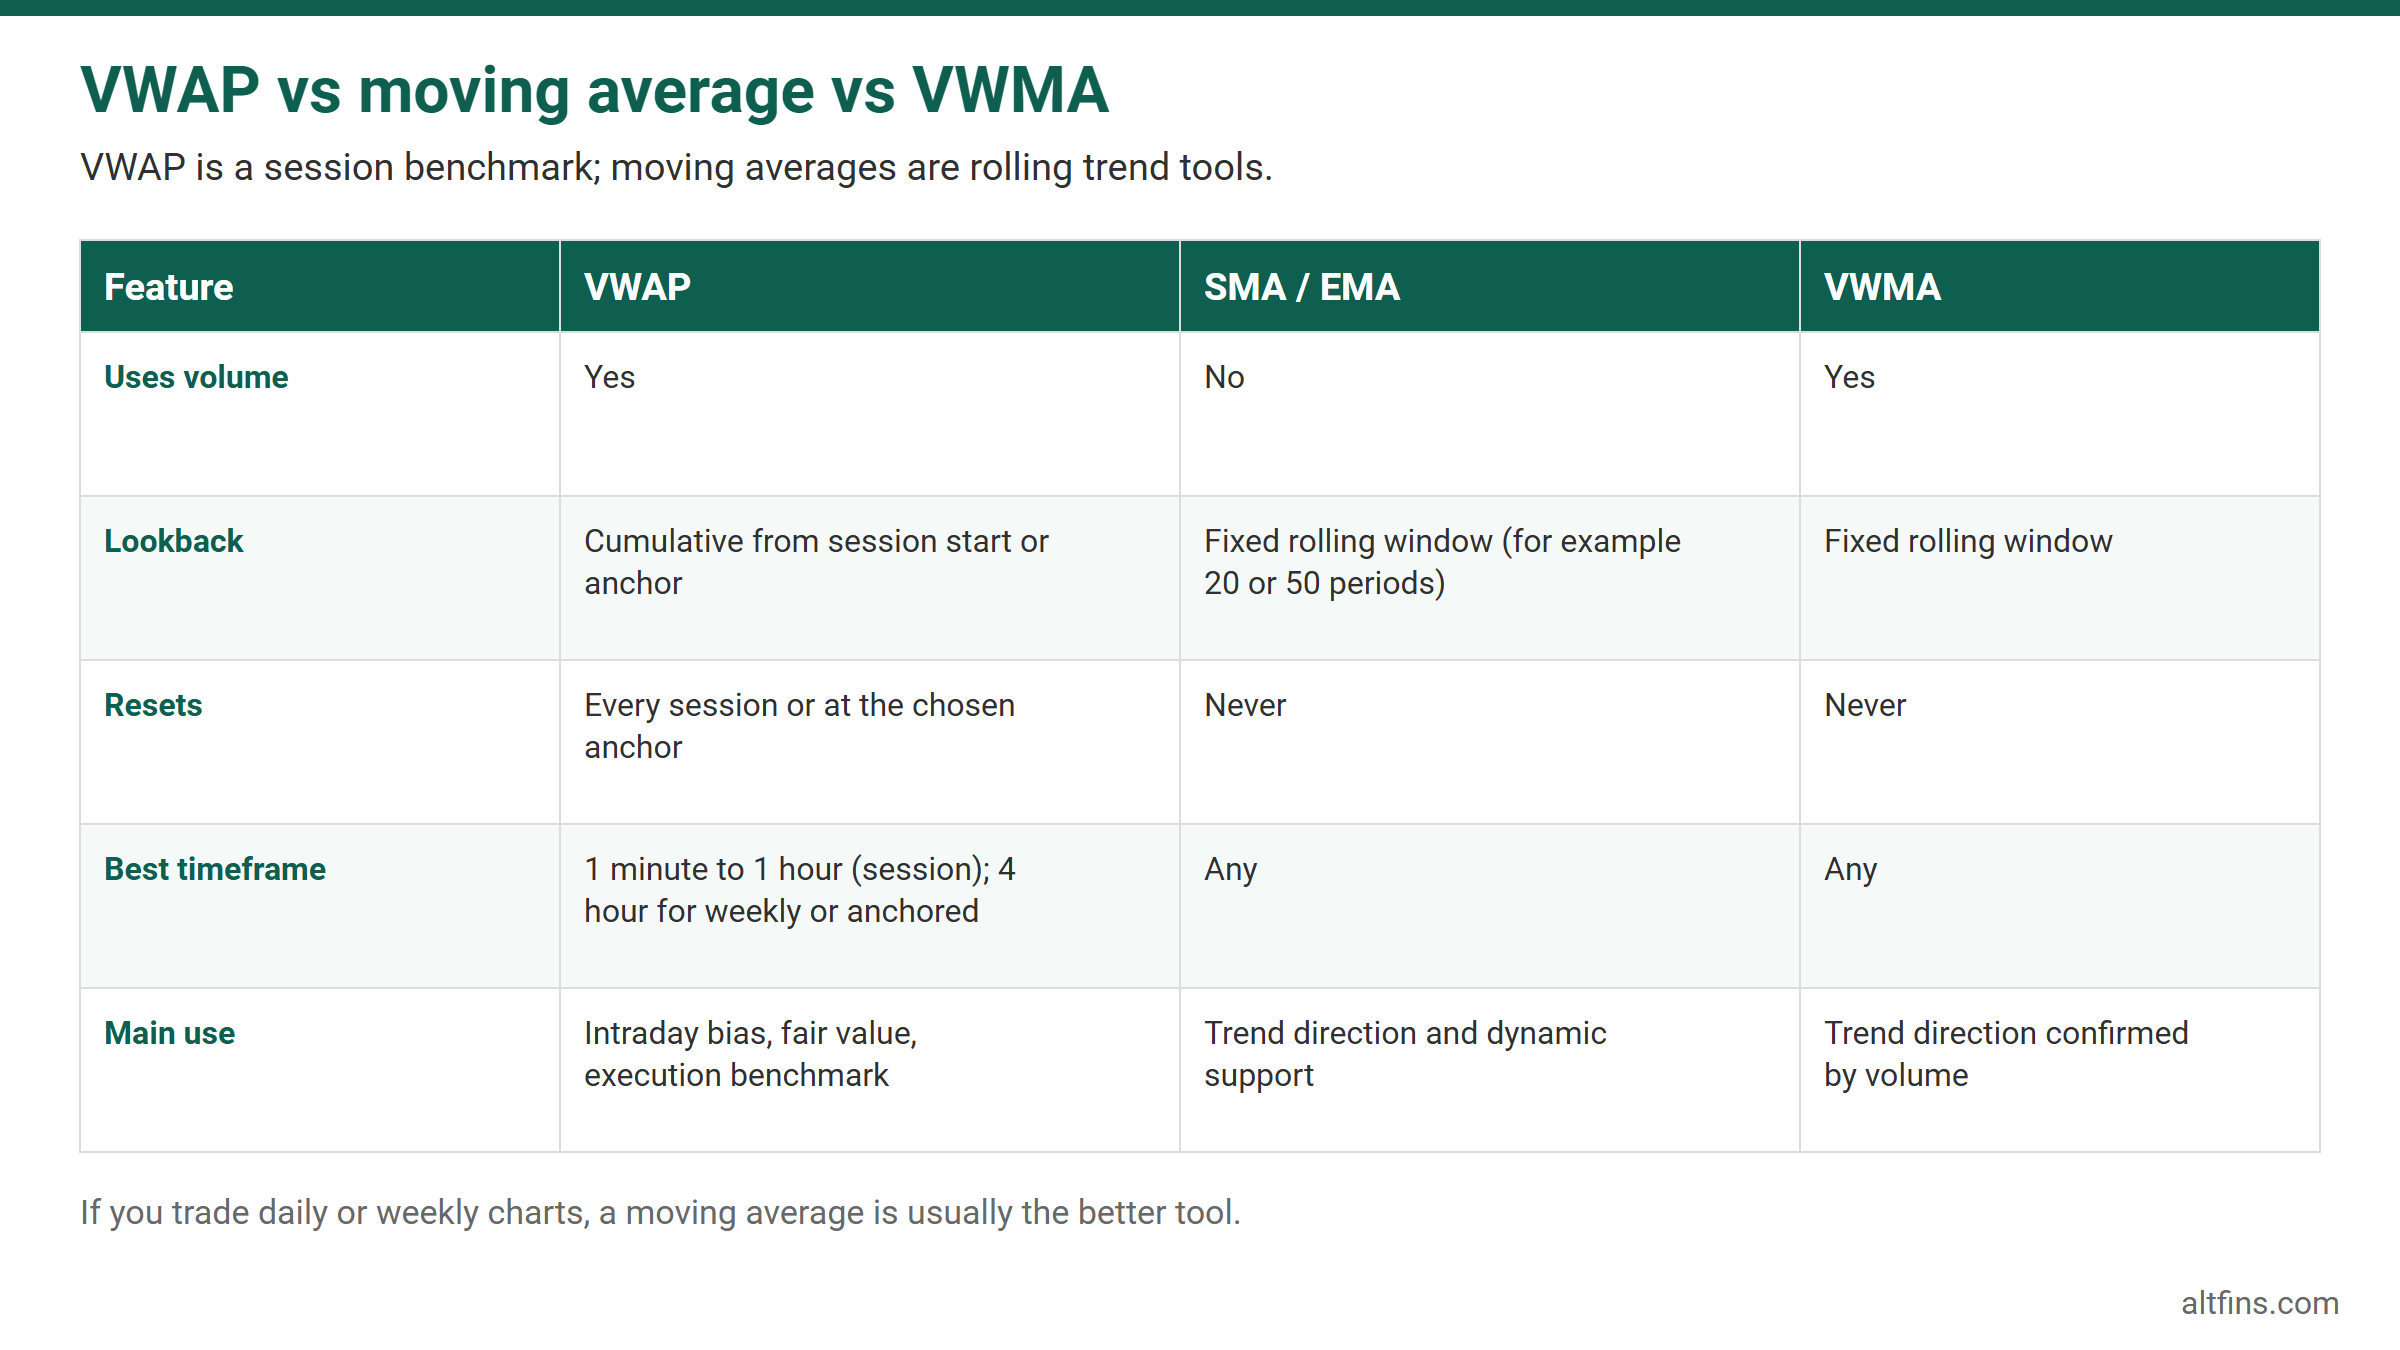
| Feature | VWAP | SMA / EMA | VWMA |
|---|---|---|---|
| Uses volume | Yes | No | Yes |
| Lookback | Cumulative from session start or anchor | Fixed rolling window (for example 20 or 50 periods) | Fixed rolling window |
| Resets | Every session or at the chosen anchor | Never | Never |
| Best timeframe | 1 minute to 1 hour (session); 4 hour for weekly or anchored | Any | Any |
| Main use | Intraday bias, fair value, execution benchmark | Trend direction and dynamic support | Trend direction confirmed by volume |
If you trade daily or weekly charts, a moving average is usually the better tool. Our guide to SMA vs EMA explains which one to pick.
VWAP pros and cons
Takeaway: VWAP adds volume context that price-only tools miss, but it lags and it is a session tool.
| Pros | Cons |
|---|---|
| Weights price by real traded volume | Lags price, because it is an average of past data |
| Clear intraday bias: above is bullish, below is bearish | Barely moves late in a session, so it reacts slowly to reversals |
| Watched by institutions, so it often acts as support or resistance | Session start is a setting in crypto, so values differ between platforms |
| Anchored VWAP adapts to any event or swing point | Volume on a single exchange may not reflect the whole market for small altcoins |
Common VWAP mistakes to avoid
Takeaway: most VWAP losses come from using it on the wrong timeframe or without volume confirmation.
- Don’t use session VWAP on a daily chart. It resets every day, so it tells you nothing about the bigger trend.
- Don’t buy every touch of VWAP. In a downtrend, VWAP is resistance, not support.
- Don’t trust the first hour. VWAP is unstable early in the session because it is based on very little volume.
- Do confirm VWAP crosses with volume. Our guide to On-Balance Volume (OBV) shows another way to check whether volume supports the move.
- Do check the higher timeframe trend before trading an intraday VWAP setup.
- Do use a stop loss. A VWAP level is a zone, not a guarantee.
📊 How altFINS helps you trade with volume
Takeaway: use altFINS to find the coins where volume is confirming the move, then apply VWAP on your intraday chart.
VWAP tells you about one coin in one session. The hard part is knowing which of thousands of coins deserve your attention today. The altFINS tools below do that filtering for you:
- VWMA 20 in the screener: the altFINS Crypto Screener includes the 20-period volume-weighted moving average, VWAP’s rolling cousin. Filter for coins trading above VWMA 20 to find volume-backed uptrends.
- Relative volume and unusual volume: screen for coins trading well above their normal volume, or use the crypto volume tracker to spot sudden spikes before they show up on VWAP.
- OBV trend and breakouts: combine OBV trend filters with crypto breakout scans to catch moves that have real buying behind them.
- Signals and alerts: check the Signals Summary for fresh trend and momentum signals, and set price and indicator alerts so you do not have to watch VWAP all day.
How to screen for coins above VWMA in altFINS
- Open the Crypto Screener and click New Filter.
- Go to Custom Filters → Price → Last Price, set it to Above, and choose VWMA in the second dropdown. Click Add Filter.
- Go to Volume and add RVOL (relative volume) or OBV Trend to keep only coins where volume is rising.
- Click Done, sort by volume, and open the top coins on an intraday chart to check session VWAP.
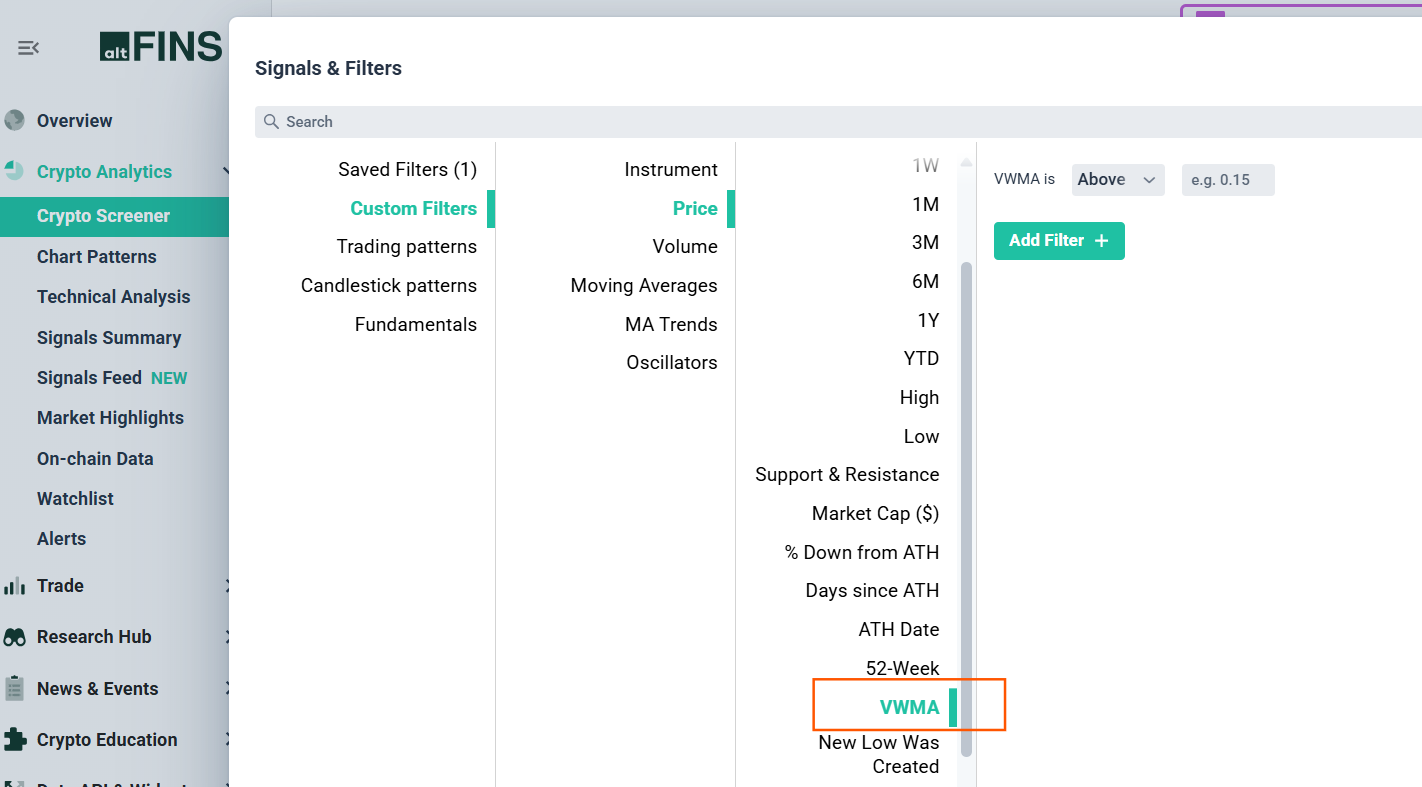
When we ran this filter on 28 September 2026, 1,214 of 2,369 coins in the altFINS screener were trading above their VWMA. Adding the RVOL filter narrows that list to the coins with unusual volume behind the move.
A simple workflow: screen for coins above VWMA with rising relative volume, open the shortlist on a 15 minute or 1 hour chart, and only take long setups while price holds above session VWAP.
Frequently asked questions
What does VWAP tell you?
VWAP tells you the average price everyone paid during the session, weighted by volume. If price trades above VWAP, the average buyer is in profit and the intraday bias is bullish. If price trades below VWAP, the average buyer is losing money and sellers have the upper hand. Institutions also use it to judge whether their orders were filled at a good price.
Is VWAP a good indicator for crypto?
Yes, for intraday trading on liquid coins such as BTC, ETH and SOL. VWAP adds volume context that moving averages lack and often acts as support or resistance. It is weaker on thinly traded altcoins, where a few large trades can distort it, and it is not designed for daily or weekly swing analysis unless you use a weekly or anchored VWAP.
What is the difference between VWAP and a moving average?
A moving average gives every candle in a fixed window equal weight and never resets. VWAP weights each price by its traded volume and accumulates from the start of the session or a chosen anchor, then resets. That makes VWAP a session fair value benchmark, while moving averages are rolling trend tools better suited to higher timeframes.
Does VWAP reset every day in crypto?
Session VWAP resets at the start of each session. Crypto trades 24/7, so the session start is a platform setting, most often 00:00 UTC. You can also change the anchor period to week, month or quarter, or use anchored VWAP from any candle you choose. Always check your settings, because a different session start produces a different VWAP line.
What is anchored VWAP?
Anchored VWAP starts the VWAP calculation from a point you pick, such as a major swing low, a breakout candle or a news event, instead of the session open. It shows the average price paid by everyone who bought since that event. Price holding above an anchored VWAP suggests those buyers are in profit and the trend is healthy.
What timeframe is best for VWAP?
Session VWAP works best on intraday charts from 1 minute to 1 hour. Day traders often use the 5 minute or 15 minute chart. For swing trading, switch to a weekly or monthly VWAP on the 4 hour chart, or use anchored VWAP from a key high or low. On daily candles, a classic session VWAP carries little useful information.
Conclusion
VWAP is the volume-weighted average price for a session and one of the simplest ways to read who controls the market today. Above VWAP, favour longs and buy pullbacks to the line. Below it, favour shorts or stay out. Confirm crosses with volume, set the right session for 24/7 crypto, and switch to weekly or anchored VWAP when you trade bigger swings.
Want to find the coins where volume is backing the move? Try the altFINS Crypto Screener and filter 2,000+ coins by VWMA 20, relative volume and OBV trend.
This article is for educational purposes only and does not constitute financial advice. Cryptocurrency trading involves significant risk, including the possible loss of your entire investment. The Bitcoin VWAP example uses historical altFINS data for 26 September 2026 and does not predict future prices. Always do your own research and manage your risk.
