

Search Knowledge Base by Keyword
Evening Star Candlestick Pattern: How to Trade It in Crypto (2026)
The evening star candlestick pattern is a three-candle bearish reversal signal that forms at the top of an uptrend: a long bullish candle, a small “star” candle that shows buyers stalling, and a long bearish candle that closes below the middle of the first candle. It tells you the rally has lost its buyers and sellers have taken control.
This guide is for crypto traders who already know basic candlesticks and want a repeatable way to spot tops before they turn into sharp pullbacks. You will learn the exact identification rules, why the pattern looks different in a 24/7 crypto market, how it compares with the evening doji star, shooting star and bearish engulfing, and how to set entry, stop loss and target.
We also walk through two real evening stars that printed on daily charts in the last week of September 2026 (Jito and Canton), using altFINS price data, so you can see what the pattern looks like when it actually happens.
Quick answer: An evening star is a bearish three-candle top: a strong green candle, a small-bodied star, then a strong red candle that closes below the midpoint of the first candle. Thomas Bulkowski’s research found it acts as a bearish reversal 72% of the time (stock data). In crypto, sell or tighten stops only after the third candle closes, place the stop above the star’s high, and confirm with overbought RSI, bearish divergence or rising volume.
Skip the manual chart hunting. On 30 September 2026 the altFINS screener flagged 32 coins with an evening star in their last 5 daily candles. Scan 2,000+ coins for evening stars in the altFINS Crypto Screener and see today’s list in seconds.
What is the evening star candlestick pattern?
Takeaway: it is a three-step story of buyers winning, stalling, then losing.
The name comes from Japanese candlestick charting. The evening star is Venus, the bright planet that appears just before darkness, and the pattern appears just before prices turn lower. It is the bearish mirror image of the morning star candlestick pattern, which marks bottoms.
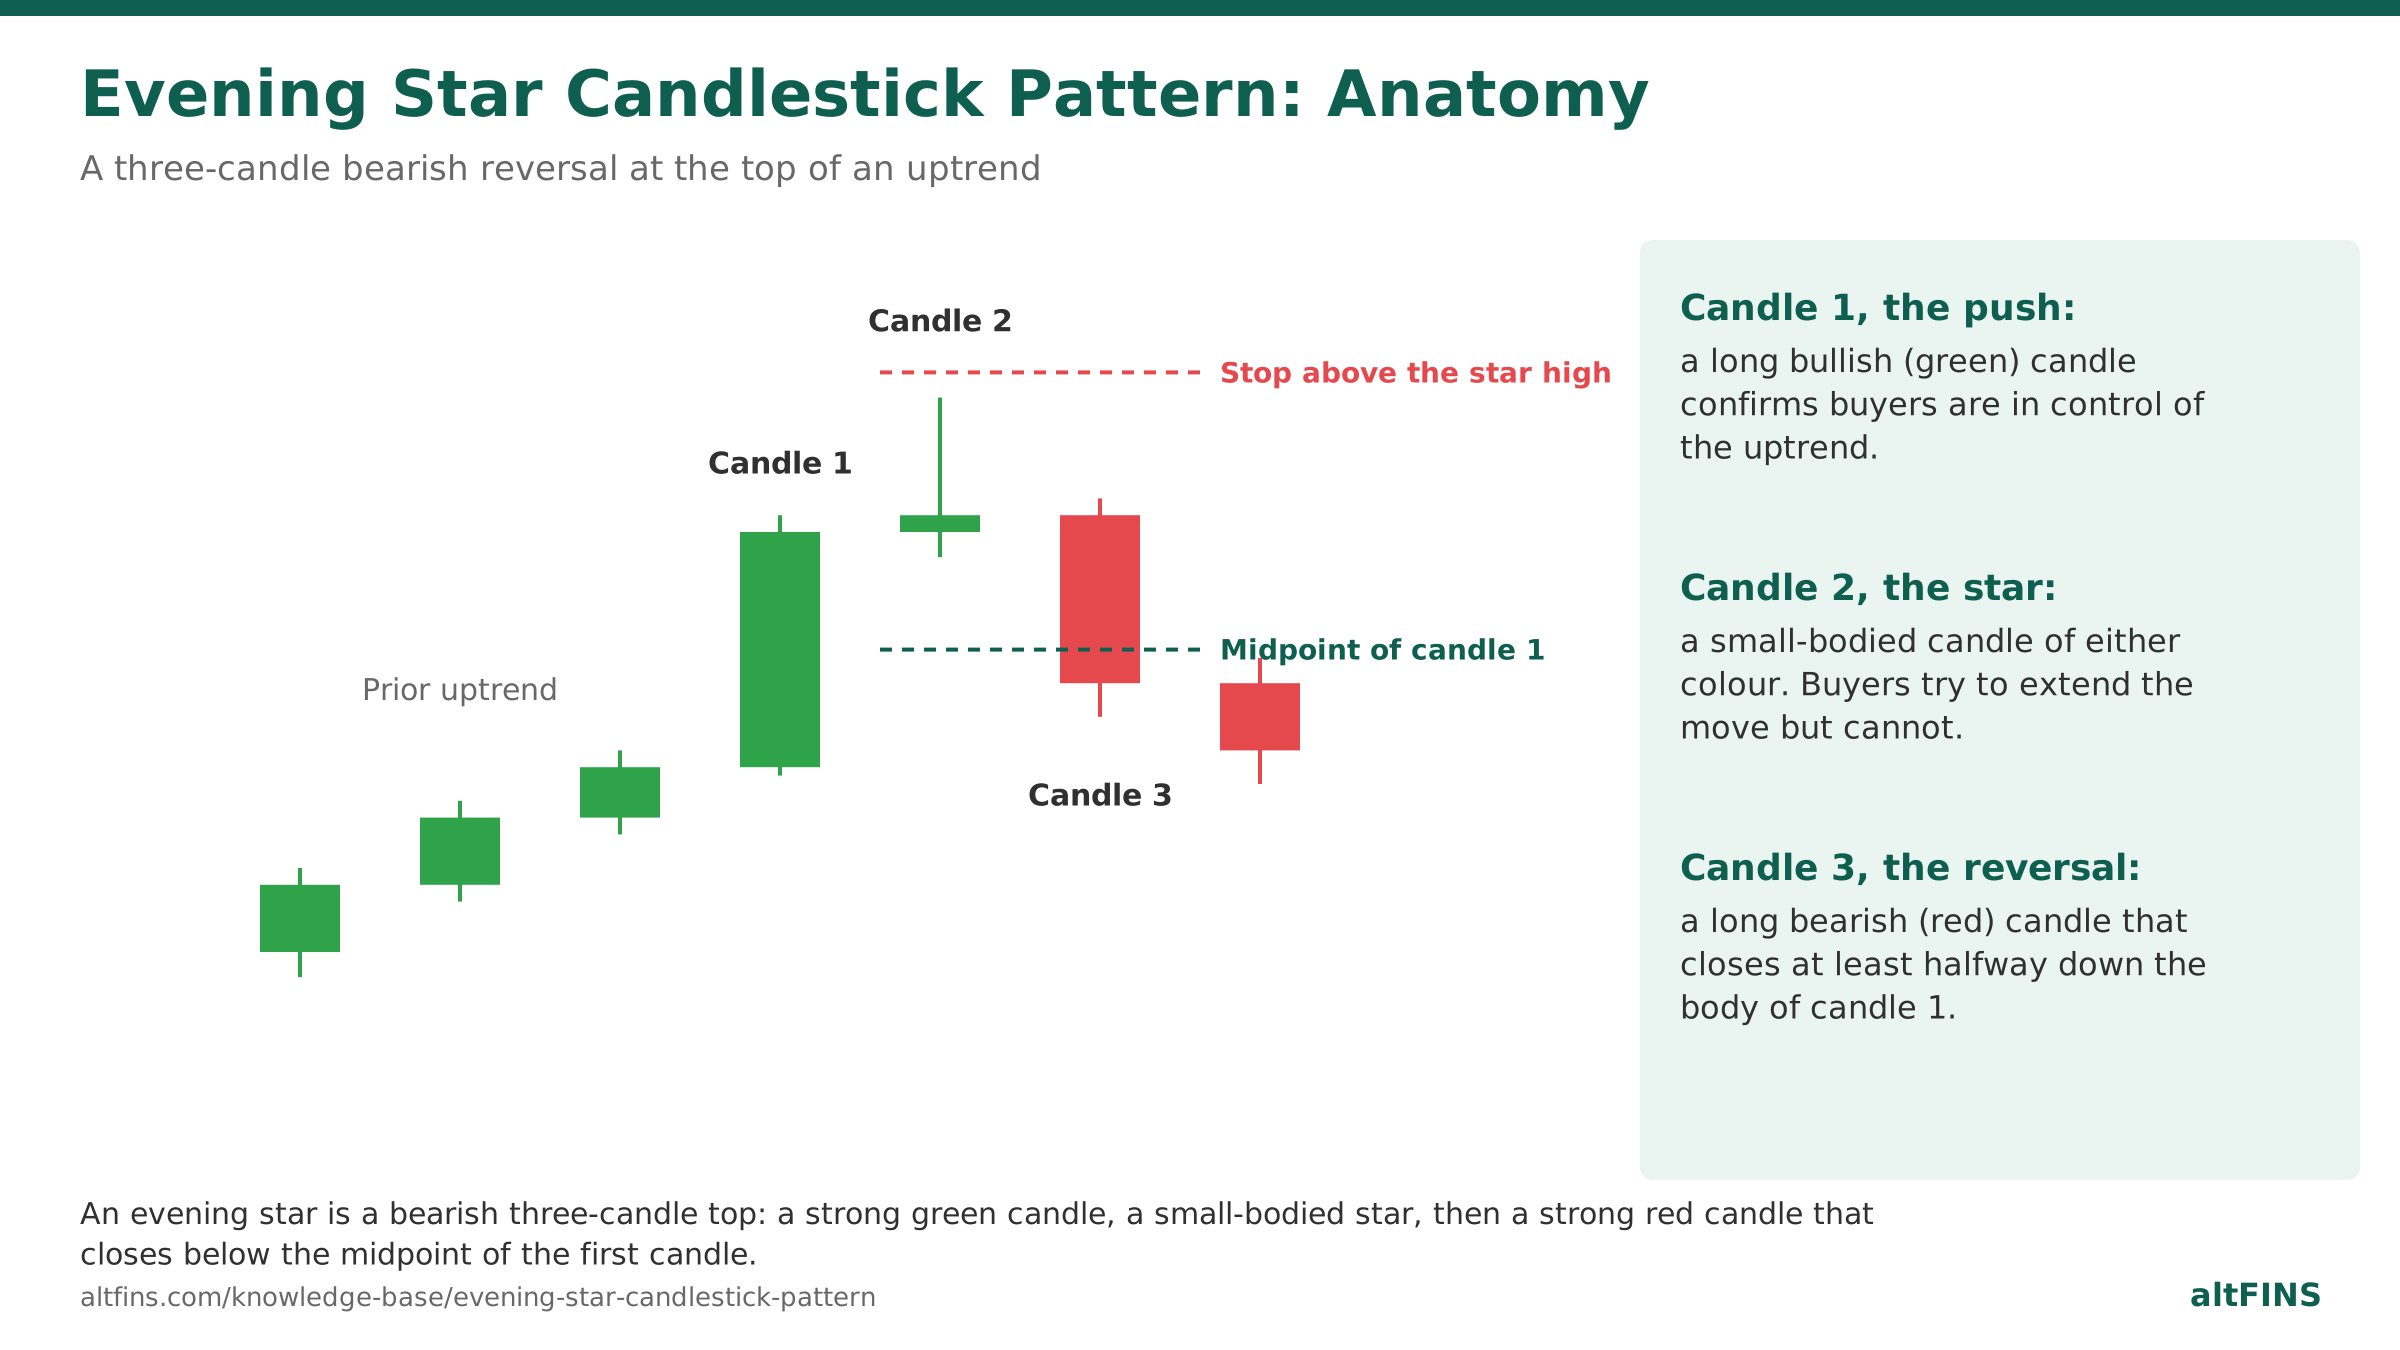
Each candle has a job:
- Candle 1, the push: a long bullish (green) candle confirms buyers are in control of the uptrend.
- Candle 2, the star: a small-bodied candle of either colour. Buyers try to extend the move but cannot. The small real body (the part between open and close) shows indecision at the top.
- Candle 3, the reversal: a long bearish (red) candle that closes at least halfway down the body of candle 1. Sellers have now erased much of the prior gain.
Because the pattern needs three candles, it gives more confirmation than a single-candle warning such as a shooting star, at the cost of a later entry.
How to identify an evening star: 5 rules
Takeaway: if any rule is missing, it is not a valid evening star.
- Prior uptrend. Price must be rising into the pattern. An evening star in a sideways range means little.
- Long bullish first candle. Its body should be clearly larger than the recent average candle.
- Small-bodied star. The second candle’s body is small compared with candle 1. Long wicks are fine. If it is a doji (open and close almost equal), you have an evening doji star.
- Long bearish third candle. It closes below the midpoint of candle 1’s body. The deeper the close, the stronger the signal.
- Location. The star sits at or near resistance, a prior high or an overbought reading. Context turns a shape into a signal.
Do it in altFINS: open the Crypto Screener, add a Candlestick Pattern filter, choose Evening Star and set the look-back to 1 to 5 candles. Add RSI 14 above 60 to keep only setups that come after a real run up.
The crypto twist: why you rarely see a gap
Takeaway: in 24/7 markets, judge the star by its small body and rejection wick, not by a gap.
Textbook definitions, written for stocks, say the star gaps above the bodies of candles 1 and 3. Stock markets close overnight, so gaps are common. Crypto trades around the clock, so each daily candle usually opens exactly where the previous one closed. A true gap almost never appears on Bitcoin, Ether or large altcoins.
Most crypto traders, and the altFINS pattern engine, therefore treat the gap as optional. What matters is that the star’s body is small, it prints at or near the high of the move, and candle 3 closes deep into candle 1. A long upper wick on the star is a bonus: it shows price was pushed higher and rejected.
Evening star vs similar bearish patterns
Takeaway: the evening star trades speed for confirmation.
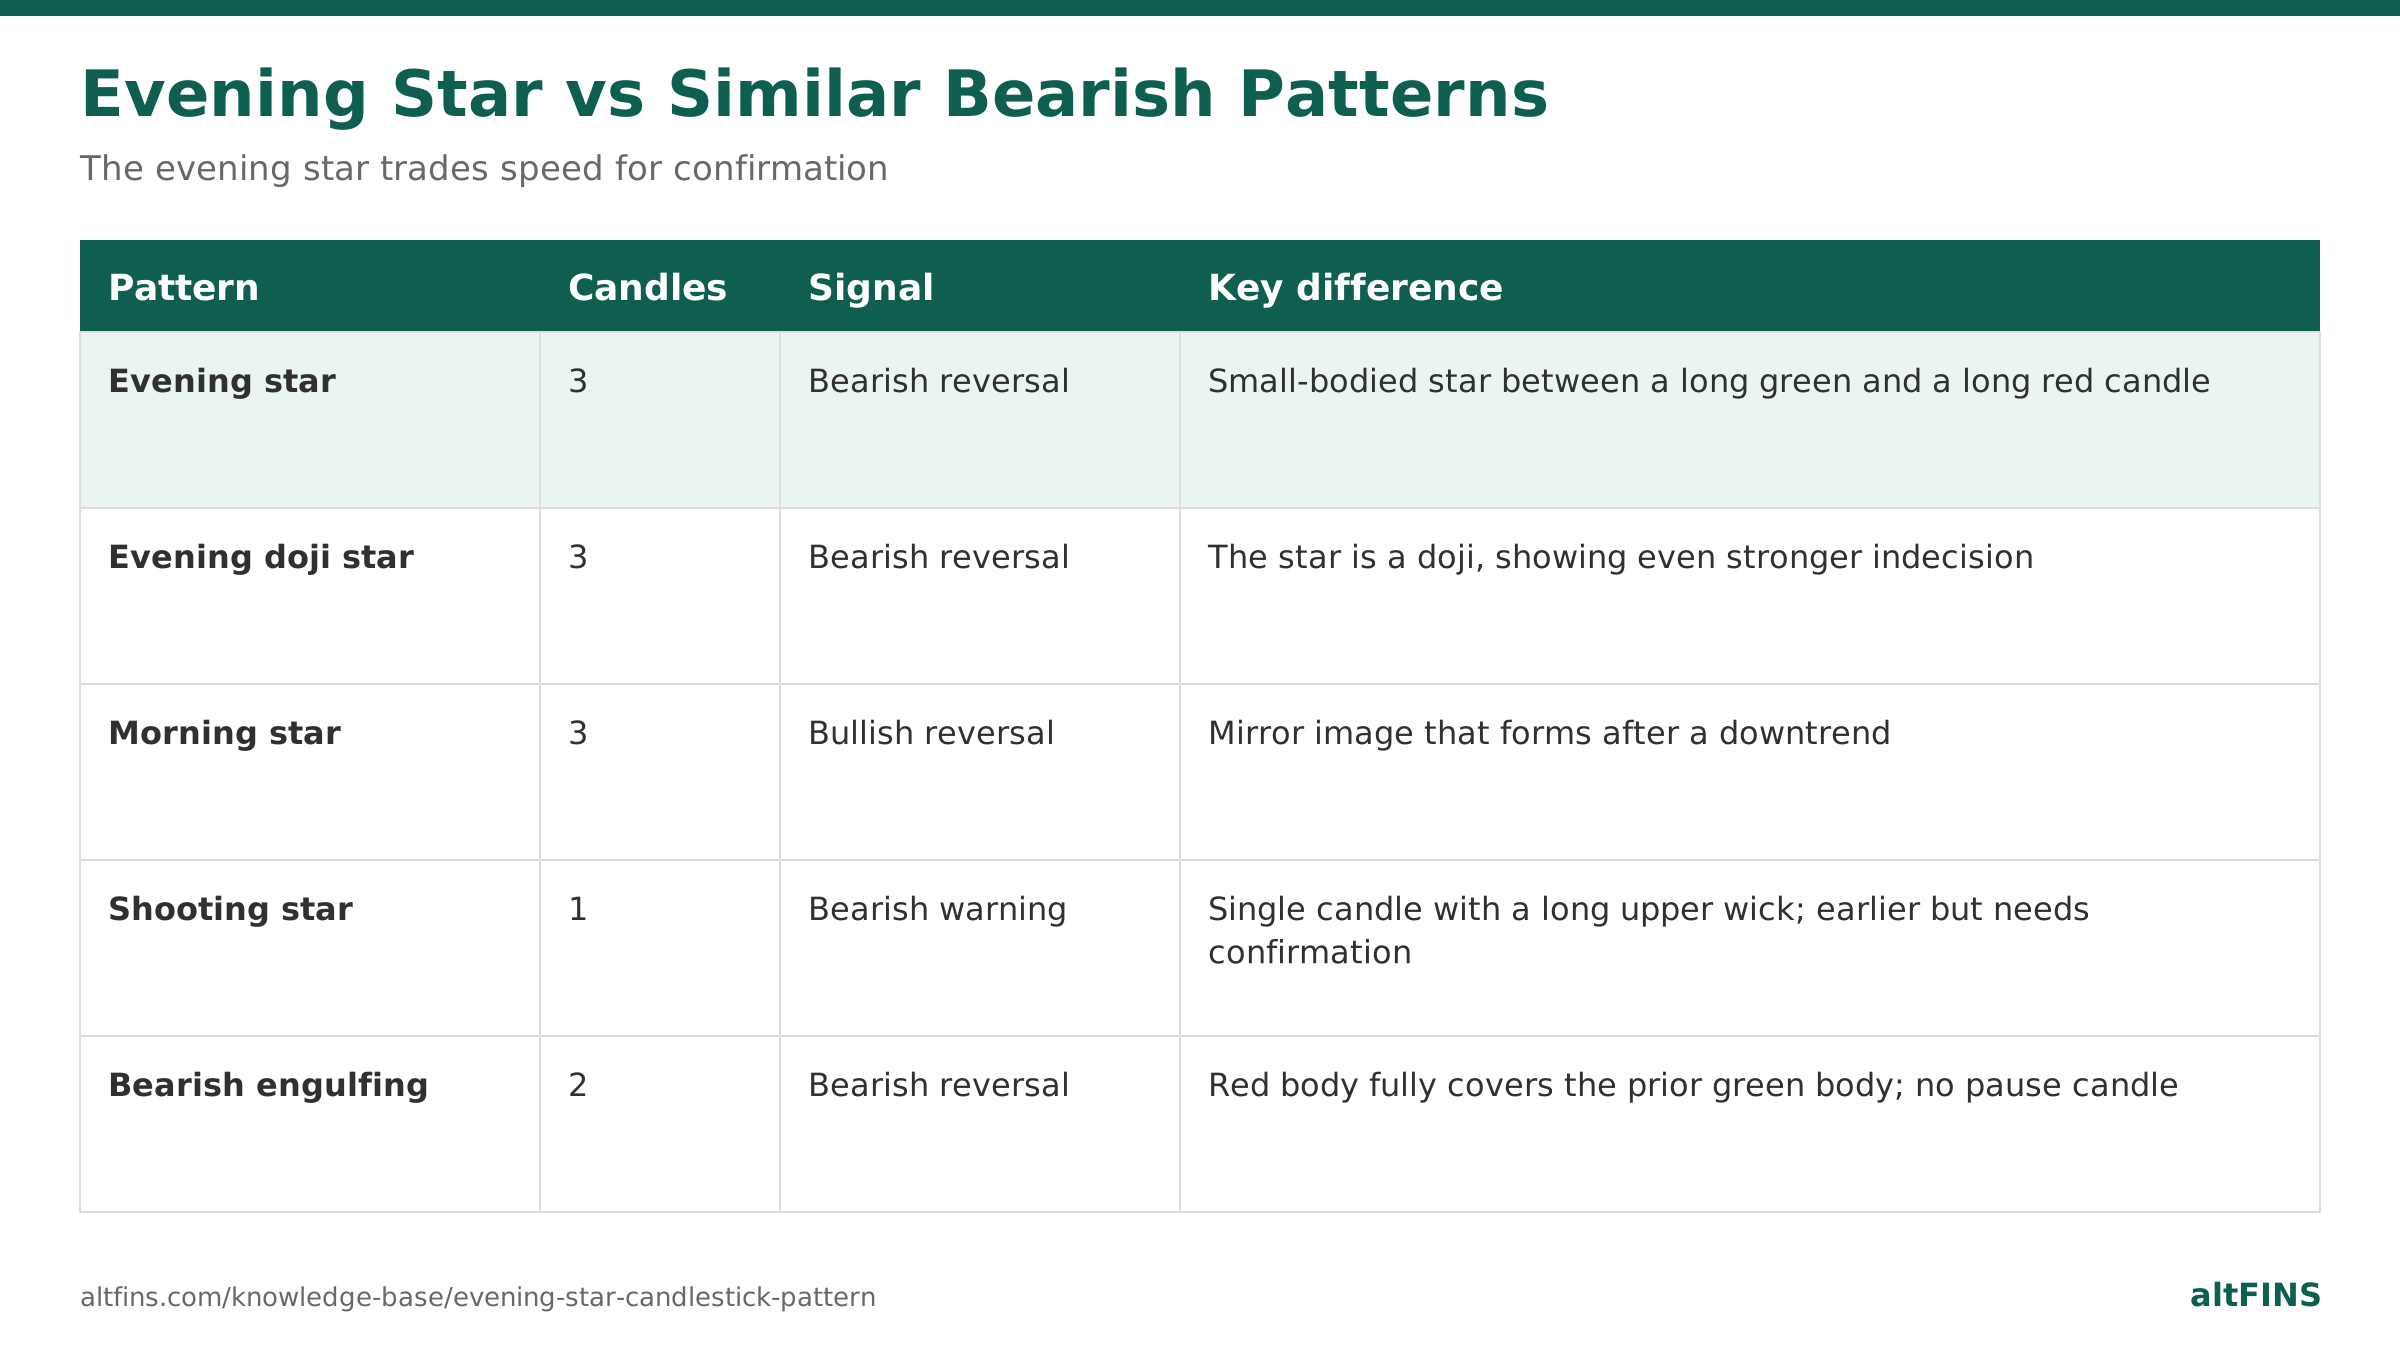
| Pattern | Candles | Signal | Key difference |
|---|---|---|---|
| Evening star | 3 | Bearish reversal | Small-bodied star between a long green and a long red candle |
| Evening doji star | 3 | Bearish reversal | The star is a doji, showing even stronger indecision |
| Morning star | 3 | Bullish reversal | Mirror image that forms after a downtrend |
| Shooting star | 1 | Bearish warning | Single candle with a long upper wick; earlier but needs confirmation |
| Bearish engulfing | 2 | Bearish reversal | Red body fully covers the prior green body; no pause candle |
A shooting star often becomes the middle candle of an evening star. If you see one at resistance, watch the next candle. Read our guides to the shooting star candlestick pattern and the gravestone doji for the single-candle versions of the same idea.
How reliable is the evening star pattern?
Takeaway: it is one of the more reliable candlestick tops, but never a guarantee.
Thomas Bulkowski, who tested candlestick patterns on millions of candle lines, reports that the evening star acts as a bearish reversal 72% of the time. His data comes from stocks, not crypto, so treat it as a guide rather than a promise.
Crypto adds three risks you need to price in:
- Volatility: altcoins can move 10% to 20% in a day, so a valid evening star can still be wicked out before it works.
- Timeframe noise: the pattern is more dependable on 4-hour, daily and weekly charts than on 15-minute charts.
- Trend strength: in a strong bull market, many evening stars mark a pause, not a top. Price dips and then continues higher.
That is why the rest of this guide focuses on confirmation and risk control rather than on the shape alone.
How to trade the evening star in crypto, step by step
Takeaway: wait for candle 3 to close, risk to the star’s high, target the next support.
Step 1: Confirm the context
Check that price has been rising for several candles and is near resistance. The altFINS support and resistance levels are drawn on every chart, so you can see at a glance whether the star formed at a ceiling.
Step 2: Wait for the third candle to close
Do not act on the star alone. The third candle must close below the midpoint of candle 1’s body. Entering early is the most common mistake with this pattern.
Step 3: Choose your action
- Holders: take partial profit or raise your stop loss.
- Short sellers: enter at the close of candle 3, or on a small bounce toward candle 3’s midpoint for a better price.
Step 4: Set the stop loss
Place it just above the highest point of the pattern, which is usually the star’s upper wick. If price climbs back above that high, the sellers have failed and the pattern is invalid.
Step 5: Set the target and size the position
Candlestick patterns have no measured-move target. Use the next support level or aim for a reward at least 1.5 times your risk. Then size the trade so that a stop-out costs no more than 1% to 2% of your account. The wider the pattern, the smaller the position.
Never miss the third candle. altFINS alerts cover dozens of candlestick patterns, including the evening star. Set an evening star alert on your watchlist and get notified by email or push when the pattern completes, instead of watching charts all day.
Real examples: evening stars in September 2026
Takeaway: the pattern works best when the third candle is strong and volume confirms it.
Jito (JTO), daily chart
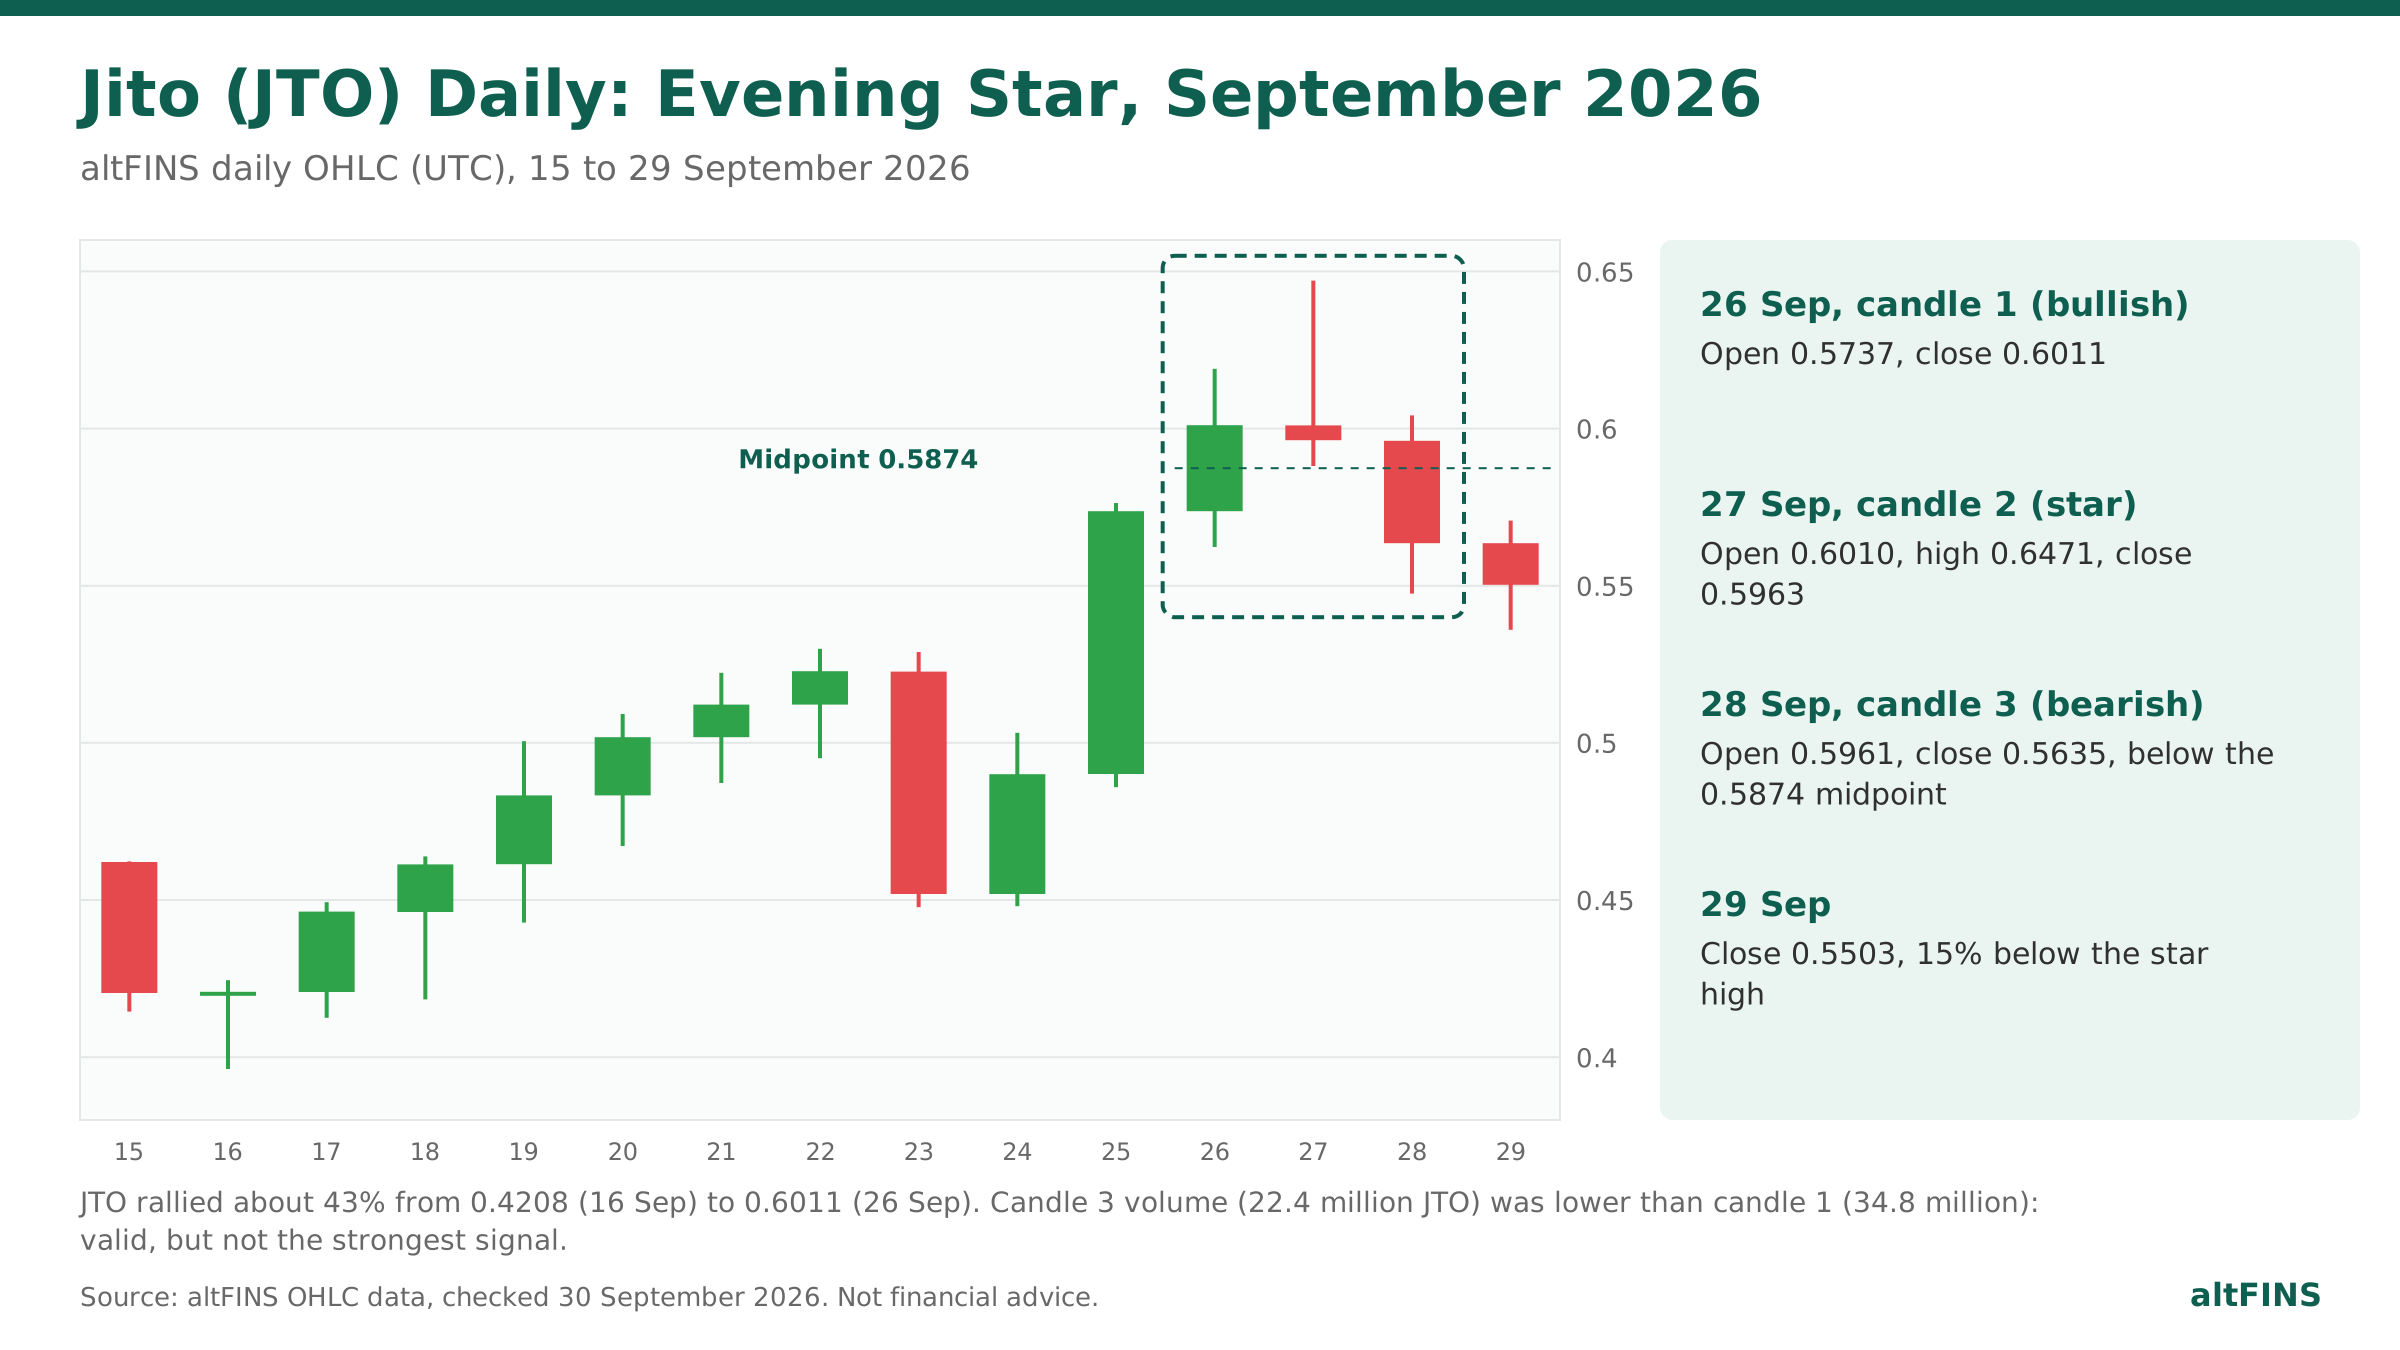
JTO rallied about 43% from a close of 0.4208 on 16 September to 0.6011 on 26 September 2026. Then the evening star printed (altFINS daily OHLC data, UTC):
| Date (2026) | Role | Open | High | Close |
|---|---|---|---|---|
| 26 Sep | Candle 1, bullish | 0.5737 | 0.6190 | 0.6011 |
| 27 Sep | Candle 2, star | 0.6010 | 0.6471 | 0.5963 |
| 28 Sep | Candle 3, bearish | 0.5961 | 0.6042 | 0.5635 |
The star had a tiny body and a long upper wick to 0.6471: buyers pushed higher and were rejected. Candle 3 closed at 0.5635, below the 0.5874 midpoint of candle 1’s body, which completed the pattern. By 29 September JTO closed at 0.5503, 15% below the star’s high. One caution: candle 3’s volume (22.4 million JTO) was lower than candle 1’s (34.8 million), so the signal was valid but not the strongest possible. A stop above 0.6471 meant about 15% risk from the 0.5635 close, which is why position size matters so much on altcoins.
Canton (CC), daily chart
Canton, a coin with a market cap of about 3.76 billion dollars on 30 September 2026, printed a cleaner volume signal. Candle 1 on 26 September closed at 0.1359 (open 0.1295). The star on 27 September had a small body (0.1358 to 0.1373). On 28 September price spiked to 0.1469, then reversed and closed at 0.1312, below the 0.1327 midpoint, on 373 million CC of volume, the highest daily volume in the prior two weeks. CC closed at 0.1236 on 29 September, 16% below the 0.1469 high.
These are recent examples, not proof of future results. Both could still reverse higher, which is exactly why the stop above the pattern high is not optional.
Confirmation tools that make the evening star stronger
Takeaway: two or more confirmations turn a shape into a trade.
- RSI above 70: the Relative Strength Index measures momentum on a 0 to 100 scale. An evening star while RSI is overbought signals an exhausted rally.
- Bearish RSI divergence: price makes a higher high while RSI makes a lower high. Learn it in our guide to RSI and RSI divergence.
- Volume: candle 3 on higher volume than candle 1 shows real selling, as in the Canton example.
- MACD: a bearish crossover of the MACD line under its signal line soon after the pattern adds momentum confirmation.
- Resistance: a star that forms right at a horizontal resistance or an all-time high is more meaningful than one in open space.
Do it in altFINS: stack filters in the screener: Evening Star (last 3 candles) plus RSI Divergence set to Bearish plus MACD below signal. You get only the evening stars with momentum already rolling over.
Do’s and don’ts
| Do | Don’t |
|---|---|
| Wait for candle 3 to close below candle 1’s midpoint | Sell on the star candle alone |
| Trade it after a clear uptrend, near resistance | Trade it in a flat, choppy range |
| Put the stop above the pattern high | Hold a short after price closes back above the star |
| Prefer 4-hour, daily and weekly charts | Rely on 5 to 15 minute charts, where noise dominates |
| Size the trade from the stop distance | Use high leverage on a volatile altcoin |
🚀 How altFINS helps you trade evening stars
Takeaway: altFINS finds the pattern, checks the context and alerts you, across thousands of coins.
- Crypto Screener: filter 2,000+ coins by Evening Star on 15-minute, 1-hour, 4-hour, 12-hour or daily candles, and combine it with RSI, MACD, trend and volume filters.
- Alerts: get notified when an evening star completes on a coin you hold. See how to create an alert.
- Signals Summary: see bullish and bearish setups in one feed, so you can check whether an evening star lines up with other bearish signals.
- Chart Patterns: AI-detected rising wedges, double tops and head and shoulders often form at the same tops where evening stars appear. A candlestick top inside a bearish chart pattern is a stronger setup.
Frequently asked questions
Is the evening star bullish or bearish?
The evening star is bearish. It forms at the top of an uptrend and signals that buying pressure has faded and sellers are taking control. Its bullish counterpart is the morning star, which forms after a downtrend. Treat an evening star as a warning to protect profits or look for short setups, but only after the third candle has closed and confirmed the reversal.
How accurate is the evening star pattern?
Thomas Bulkowski’s research on stocks found the evening star acts as a bearish reversal 72% of the time, which makes it one of the stronger candlestick patterns. Crypto is more volatile, so real results depend on timeframe, trend strength and confirmation. Combining the pattern with overbought RSI, bearish divergence, rising volume or resistance usually filters out many false signals.
What is the difference between an evening star and an evening doji star?
Both are three-candle bearish reversals with the same first and third candles. In an evening star the middle candle has a small body. In an evening doji star the middle candle is a doji, where the open and close are almost equal. The doji shows even stronger indecision at the top, so many traders see the doji version as a slightly stronger warning.
What is the difference between an evening star and a shooting star?
A shooting star is one candle with a small body and a long upper wick at the top of an uptrend. An evening star is a three-candle pattern that includes a confirming bearish candle. The shooting star warns earlier, while the evening star confirms more. A shooting star often becomes the middle candle of an evening star if the next candle closes strongly lower.
Which timeframe is best for the evening star in crypto?
Daily and 4-hour charts give the best balance between signal quality and frequency. Weekly evening stars are rarer but carry more weight. On 5 to 15 minute charts, crypto noise creates many small patterns that fail quickly. If you trade lower timeframes, check that the higher timeframe trend and resistance level agree with the signal before entering.
Where should I put my stop loss on an evening star trade?
Place the stop loss just above the highest point of the pattern, usually the star’s upper wick. If price closes above that level, sellers have failed and the reversal is invalid. Because crypto candles can be large, calculate the distance to the stop first and size the position so a loss costs only 1% to 2% of your account.
Verdict: is the evening star worth trading in crypto?
Yes, as a confirmed warning, not as a standalone sell button. The evening star has solid historical reliability, a clear invalidation level and a logic you can see on the chart. In crypto, drop the gap rule, wait for the third candle, demand at least one confirmation and let the stop above the star’s high do its job. Used that way, it is one of the most practical tools for protecting profits after a strong altcoin rally.
Find today’s evening stars in one click. Open the altFINS Crypto Screener, add the Evening Star filter and set alerts on the coins you hold. Need more filters, alerts and history? Compare altFINS plans.
Want the full set of reversal candles? Read essential candlestick patterns for crypto traders, or see Investopedia’s evening star definition for the classic stock-market view.
Disclaimer: This article is for educational purposes only and is not financial advice. Cryptocurrency trading carries a high level of risk and may not be suitable for all investors. Past patterns and statistics do not guarantee future results. Price data cited is from altFINS daily OHLC (UTC) as of 30 September 2026. Always do your own research and manage your risk.
